
 Login Sign Up


| |||||
 |  | ||||

| 12Stocks.com Market Intelligence |
Best SmallCap Stocks
|
| In a hurry? Small Cap Stock Lists: Performance Trends Table, Stock Charts
Sort Small Cap stocks: Daily, Weekly, Year-to-Date, Market Cap & Trends. Filter Small Cap stocks list by sector: Show all, Tech, Finance, Energy, Staples, Retail, Industrial, Materials, Utilities and HealthCare Filter Small Cap stocks list by size: All Large Medium Small and MicroCap |
| 12Stocks.com Small Cap Stocks Performances & Trends Daily | |||||||||
|
|  The overall Smart Investing & Trading Score is 80 (0-bearish to 100-bullish) which puts Small Cap index in short term neutral to bullish trend. The Smart Investing & Trading Score from previous trading session is 100 and hence a deterioration of trend.
| ||||||||
Here are the Smart Investing & Trading Scores of the most requested small cap stocks at 12Stocks.com (click stock name for detailed review):
|


| 12Stocks.com: Investing in Smallcap Index with Stocks | |
|
The following table helps investors and traders sort through current performance and trends (as measured by Smart Investing & Trading Score) of various
stocks in the Smallcap Index. Quick View: Move mouse or cursor over stock symbol (ticker) to view short-term technical chart and over stock name to view long term chart. Click on  to add stock symbol to your watchlist and to add stock symbol to your watchlist and  to view watchlist. Click on any ticker or stock name for detailed market intelligence report for that stock. to view watchlist. Click on any ticker or stock name for detailed market intelligence report for that stock. |
12Stocks.com Performance of Stocks in Smallcap Index
| Ticker | Stock Name | Watchlist | Category | Recent Price | Smart Investing & Trading Score | Change % | YTD Change% |
| ENTA | Enanta |   | Health Care | 8.53 | 60 | -2.61% | 49.39% |
| ADUS | Addus HomeCare | | Health Care | 115.51 | 70 | -0.58% | -8.91% |
| MUR | Murphy Oil | | Energy | 24.66 | 90 | 1.76% | -23.31% |
| HCAT | Health Catalyst | | Technology | 3.69 | 80 | 4.79% | -56.72% |
| IRT | Independence Realty | | Financials | 17.72 | 80 | -0.69% | -12.01% |
| JRVR | James River | | Financials | 5.64 | 30 | -1.19% | 20.00% |
| PPBI | Pacific Premier | | Financials | 24.63 | 100 | -1.21% | -4.47% |
| ACHR | Archer Aviation | | Industrials | 9.15 | 0 | 1.63% | -3.79% |
| BV | BrightView | | Industrials | 14.84 | 0 | 1.17% | -8.13% |
| DCGO | DocGo | | Health Care | 1.62 | 40 | -0.62% | -62.26% |
| SBSI | Southside Bancshares | | Financials | 31.39 | 90 | -1.72% | -4.16% |
| KALU | Kaiser Aluminum | | Materials | 78.70 | 70 | 1.58% | 11.32% |
| HURN | Huron Consulting | | Services & Goods | 138.25 | 50 | 0.07% | 8.96% |
| ALG | Alamo Group | | Industrials | 217.54 | 20 | -0.80% | 14.95% |
| DRH | DiamondRock Hospitality | | Financials | 8.59 | 100 | 0.12% | -9.11% |
| BCC | Boise Cascade | | Industrials | 88.05 | 40 | 0.20% | -28.45% |
| TRS | TriMas | | Industrials | 38.67 | 80 | 0.86% | 53.92% |
| CRK | Comstock Resources | | Energy | 15.77 | 60 | 1.36% | -14.27% |
| AMWD | American Woodmark | | Consumer Staples | 66.47 | 50 | 0.02% | -21.61% |
| CENTA | Central Garden | | Materials | 32.66 | 70 | 1.23% | -2.54% |
| LZB | La-Z-Boy | | Consumer Staples | 36.86 | 30 | 1.22% | -19.29% |
| AESI | Atlas Energy | | Energy | 11.70 | 46 | 0.00% | -47.66% |
| PIII | P3 Health | | Health Care | 7.85 | 100 | -0.07% | -34.99% |
| MEI | Methode Electronics | | Technology | 7.76 | 80 | -0.30% | -40.78% |
| FLWS | 1-800-FLOWERS.COM | | Services & Goods | 5.60 | 70 | -2.18% | -34.15% |
| For chart view version of above stock list: Chart View ➞ 0 - 25 , 25 - 50 , 50 - 75 , 75 - 100 , 100 - 125 , 125 - 150 , 150 - 175 , 175 - 200 , 200 - 225 , 225 - 250 , 250 - 275 , 275 - 300 , 300 - 325 | ||
 | Click To Change The Sort Order: By Market Cap or Company Size Performance: Year-to-date, Week and Day |  |
| Too many stocks? View smallcap stocks filtered by marketcap & sector |
| Marketcap: All SmallCap Stocks (default-no microcap), Large, Mid-Range, Small |
| Smallcap Sector: Tech, Finance, Energy, Staples, Retail, Industrial, Materials, & Medical |
|
Get the most comprehensive stock market coverage daily at 12Stocks.com ➞ Best Stocks Today ➞ Best Stocks Weekly ➞ Best Stocks Year-to-Date ➞ Best Stocks Trends ➞  Best Stocks Today 12Stocks.com Best Nasdaq Stocks ➞ Best S&P 500 Stocks ➞ Best Tech Stocks ➞ Best Biotech Stocks ➞ |
| Detailed Overview of SmallCap Stocks |
| SmallCap Technical Overview, Leaders & Laggards, Top SmallCap ETF Funds & Detailed SmallCap Stocks List, Charts, Trends & More |
| Smallcap: Technical Analysis, Trends & YTD Performance | |
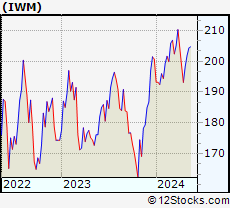
| SmallCap segment as represented by
IWM, an exchange-traded fund [ETF], holds basket of thousands of smallcap stocks from across all major sectors of the US stock market. The smallcap index (contains stocks like Riverbed & Sotheby's) is up by 4.36% and is currently underperforming the overall market by -2.9% year-to-date. Below is a quick view of technical charts and trends: | |
 IWM Weekly Chart |
|
| Long Term Trend: Very Good | |
| Medium Term Trend: Very Good | |
 IWM Daily Chart |
|
| Short Term Trend: Very Good | |
| Overall Trend Score: 80 | |
| YTD Performance: 4.36% | |
| **Trend Scores & Views Are Only For Educational Purposes And Not For Investing | |
| 12Stocks.com: Top Performing Small Cap Index Stocks | ||||||||||||||||||||||||||||||||||||||||||||||||
 The top performing Small Cap Index stocks year to date are
Now, more recently, over last week, the top performing Small Cap Index stocks on the move are


|
||||||||||||||||||||||||||||||||||||||||||||||||
| 12Stocks.com: Investing in Smallcap Index using Exchange Traded Funds | |
|
The following table shows list of key exchange traded funds (ETF) that
help investors track Smallcap index. The following list also includes leveraged ETF funds that track twice or thrice the daily returns of Smallcap indices. Short or inverse ETF funds move in the opposite direction to the index they track and are useful during market pullbacks or during bear markets. Quick View: Move mouse or cursor over ETF symbol (ticker) to view short-term technical chart and over ETF name to view long term chart. Click on ticker or stock name for detailed view. Click on to add stock symbol to your watchlist and to view watchlist. |
12Stocks.com List of ETFs that track Smallcap Index
| Ticker | ETF Name | Watchlist | Recent Price | Smart Investing & Trading Score | Change % | Week % | Year-to-date % |
| IWM | iShares Russell 2000 | | 235.17 | 80 | -0.44 | 0.14 | 4.36% |
| IJR | iShares Core S&P Small-Cap | | 118.76 | 100 | -0.08 | -0.89 | -0.29% |
| VTWO | Vanguard Russell 2000 ETF | | 95.43 | 80 | 0.24 | -0.93 | 2.92% |
| IWN | iShares Russell 2000 Value | | 174.53 | 100 | -0.01 | -0.85 | 2.1% |
| IWO | iShares Russell 2000 Growth | | 308.59 | 80 | 0.51 | -1.11 | 3.5% |
| IJS | iShares S&P Small-Cap 600 Value | | 110.04 | 100 | -0.22 | -0.99 | -2.29% |
| IJT | iShares S&P Small-Cap 600 Growth | | 141.94 | 70 | 0.05 | -0.89 | 1.68% |
| XSLV | PowerShares S&P SmallCap Low Volatil ETF | | 47.68 | 100 | -0.3 | -0.13 | -1.1% |
| SAA | ProShares Ultra SmallCap600 | | 25.65 | 100 | -0.31 | -2.17 | -8.34% |
| SMLV | SPDR SSGA US Small Cap Low Volatil ETF | | 133.28 | 100 | -0.09 | 2.75 | 2.13% |
| SDD | ProShares UltraShort SmallCap600 | | 13.29 | 30 | -100 | -100 | -100% |
| SBB | ProShares Short SmallCap600 | | 13.98 | 20 | 0.15 | 0.97 | 0.93% |
| 12Stocks.com: Charts, Trends, Fundamental Data and Performances of SmallCap Stocks | |
|
We now take in-depth look at all SmallCap stocks including charts, multi-period performances and overall trends (as measured by Smart Investing & Trading Score). One can sort SmallCap stocks (click link to choose) by Daily, Weekly and by Year-to-Date performances. Also, one can sort by size of the company or by market capitalization. |
| Select Your Default Chart Type: | |||||
| |||||
| Click on stock symbol or name for detailed view. Click on to add stock symbol to your watchlist and to view watchlist. Quick View: Move mouse or cursor over "Daily" to quickly view daily technical stock chart and over "Weekly" to view weekly technical stock chart. | |||||

 | ENTA Enanta Pharmaceuticals, Inc. |
| Sector: Health Care | |
| SubSector: Biotechnology | |
| MarketCap: 998.385 Millions | |
| Recent Price: 8.53 Smart Investing & Trading Score: 60 | |
| Day Percent Change: -2.61% Day Change: -0.23 | |
| Week Change: 10.98% Year-to-date Change: 49.4% | |
| ENTA Links: Profile News Message Board | |
| Charts:- Daily , Weekly | |
| Add ENTA to Watchlist: View: Get Complete ENTA Trend Analysis ➞ | |
 | ADUS Addus HomeCare Corporation |
| Sector: Health Care | |
| SubSector: Home Health Care | |
| MarketCap: 994.795 Millions | |
| Recent Price: 115.51 Smart Investing & Trading Score: 70 | |
| Day Percent Change: -0.58% Day Change: -0.67 | |
| Week Change: 0.28% Year-to-date Change: -8.9% | |
| ADUS Links: Profile News Message Board | |
| Charts:- Daily , Weekly | |
| Add ADUS to Watchlist: View: Get Complete ADUS Trend Analysis ➞ | |
 | MUR Murphy Oil Corporation |
| Sector: Energy | |
| SubSector: Independent Oil & Gas | |
| MarketCap: 985.993 Millions | |
| Recent Price: 24.66 Smart Investing & Trading Score: 90 | |
| Day Percent Change: 1.76% Day Change: 0.39 | |
| Week Change: -2.63% Year-to-date Change: -23.3% | |
| MUR Links: Profile News Message Board | |
| Charts:- Daily , Weekly | |
| Add MUR to Watchlist: View: Get Complete MUR Trend Analysis ➞ | |
 | HCAT Health Catalyst, Inc. |
| Sector: Technology | |
| SubSector: Healthcare Information Services | |
| MarketCap: 983.955 Millions | |
| Recent Price: 3.69 Smart Investing & Trading Score: 80 | |
| Day Percent Change: 4.79% Day Change: 0.14 | |
| Week Change: 4.62% Year-to-date Change: -56.7% | |
| HCAT Links: Profile News Message Board | |
| Charts:- Daily , Weekly | |
| Add HCAT to Watchlist: View: Get Complete HCAT Trend Analysis ➞ | |
 | IRT Independence Realty Trust, Inc. |
| Sector: Financials | |
| SubSector: REIT - Residential | |
| MarketCap: 980.161 Millions | |
| Recent Price: 17.72 Smart Investing & Trading Score: 80 | |
| Day Percent Change: -0.69% Day Change: -0.12 | |
| Week Change: -0.92% Year-to-date Change: -12.0% | |
| IRT Links: Profile News Message Board | |
| Charts:- Daily , Weekly | |
| Add IRT to Watchlist: View: Get Complete IRT Trend Analysis ➞ | |
 | JRVR James River Group Holdings, Ltd. |
| Sector: Financials | |
| SubSector: Property & Casualty Insurance | |
| MarketCap: 978.312 Millions | |
| Recent Price: 5.64 Smart Investing & Trading Score: 30 | |
| Day Percent Change: -1.19% Day Change: -0.07 | |
| Week Change: -0.68% Year-to-date Change: 20.0% | |
| JRVR Links: Profile News Message Board | |
| Charts:- Daily , Weekly | |
| Add JRVR to Watchlist: View: Get Complete JRVR Trend Analysis ➞ | |
 | PPBI Pacific Premier Bancorp, Inc. |
| Sector: Financials | |
| SubSector: Regional - Pacific Banks | |
| MarketCap: 978.029 Millions | |
| Recent Price: 24.63 Smart Investing & Trading Score: 100 | |
| Day Percent Change: -1.21% Day Change: -0.28 | |
| Week Change: -3.27% Year-to-date Change: -4.5% | |
| PPBI Links: Profile News Message Board | |
| Charts:- Daily , Weekly | |
| Add PPBI to Watchlist: View: Get Complete PPBI Trend Analysis ➞ | |
 | ACHR Archer Aviation Inc. |
| Sector: Industrials | |
| SubSector: Aerospace & Defense | |
| MarketCap: 976 Millions | |
| Recent Price: 9.15 Smart Investing & Trading Score: 0 | |
| Day Percent Change: 1.63% Day Change: 0.15 | |
| Week Change: -6.11% Year-to-date Change: -3.8% | |
| ACHR Links: Profile News Message Board | |
| Charts:- Daily , Weekly | |
| Add ACHR to Watchlist: View: Get Complete ACHR Trend Analysis ➞ | |
 | BV BrightView Holdings, Inc. |
| Sector: Industrials | |
| SubSector: General Contractors | |
| MarketCap: 973.763 Millions | |
| Recent Price: 14.84 Smart Investing & Trading Score: 0 | |
| Day Percent Change: 1.17% Day Change: 0.17 | |
| Week Change: -0.68% Year-to-date Change: -8.1% | |
| BV Links: Profile News Message Board | |
| Charts:- Daily , Weekly | |
| Add BV to Watchlist: View: Get Complete BV Trend Analysis ➞ | |
 | DCGO DocGo Inc. |
| Sector: Health Care | |
| SubSector: Medical Care Facilities | |
| MarketCap: 972 Millions | |
| Recent Price: 1.62 Smart Investing & Trading Score: 40 | |
| Day Percent Change: -0.62% Day Change: -0.01 | |
| Week Change: -1.84% Year-to-date Change: -62.3% | |
| DCGO Links: Profile News Message Board | |
| Charts:- Daily , Weekly | |
| Add DCGO to Watchlist: View: Get Complete DCGO Trend Analysis ➞ | |
 | SBSI Southside Bancshares, Inc. |
| Sector: Financials | |
| SubSector: Regional - Mid-Atlantic Banks | |
| MarketCap: 971.259 Millions | |
| Recent Price: 31.39 Smart Investing & Trading Score: 90 | |
| Day Percent Change: -1.72% Day Change: -0.52 | |
| Week Change: -2.84% Year-to-date Change: -4.2% | |
| SBSI Links: Profile News Message Board | |
| Charts:- Daily , Weekly | |
| Add SBSI to Watchlist: View: Get Complete SBSI Trend Analysis ➞ | |
 | KALU Kaiser Aluminum Corporation |
| Sector: Materials | |
| SubSector: Aluminum | |
| MarketCap: 969.808 Millions | |
| Recent Price: 78.70 Smart Investing & Trading Score: 70 | |
| Day Percent Change: 1.58% Day Change: 1.18 | |
| Week Change: 0.32% Year-to-date Change: 11.3% | |
| KALU Links: Profile News Message Board | |
| Charts:- Daily , Weekly | |
| Add KALU to Watchlist: View: Get Complete KALU Trend Analysis ➞ | |
 | HURN Huron Consulting Group Inc. |
| Sector: Services & Goods | |
| SubSector: Management Services | |
| MarketCap: 968.645 Millions | |
| Recent Price: 138.25 Smart Investing & Trading Score: 50 | |
| Day Percent Change: 0.07% Day Change: 0.1 | |
| Week Change: 1.87% Year-to-date Change: 9.0% | |
| HURN Links: Profile News Message Board | |
| Charts:- Daily , Weekly | |
| Add HURN to Watchlist: View: Get Complete HURN Trend Analysis ➞ | |
 | ALG Alamo Group Inc. |
| Sector: Industrials | |
| SubSector: Farm & Construction Machinery | |
| MarketCap: 964.107 Millions | |
| Recent Price: 217.54 Smart Investing & Trading Score: 20 | |
| Day Percent Change: -0.8% Day Change: -1.72 | |
| Week Change: -6.06% Year-to-date Change: 15.0% | |
| ALG Links: Profile News Message Board | |
| Charts:- Daily , Weekly | |
| Add ALG to Watchlist: View: Get Complete ALG Trend Analysis ➞ | |
 | DRH DiamondRock Hospitality Company |
| Sector: Financials | |
| SubSector: REIT - Hotel/Motel | |
| MarketCap: 964 Millions | |
| Recent Price: 8.59 Smart Investing & Trading Score: 100 | |
| Day Percent Change: 0.12% Day Change: 0.01 | |
| Week Change: 0.88% Year-to-date Change: -9.1% | |
| DRH Links: Profile News Message Board | |
| Charts:- Daily , Weekly | |
| Add DRH to Watchlist: View: Get Complete DRH Trend Analysis ➞ | |
 | BCC Boise Cascade Company |
| Sector: Industrials | |
| SubSector: Lumber, Wood Production | |
| MarketCap: 963.938 Millions | |
| Recent Price: 88.05 Smart Investing & Trading Score: 40 | |
| Day Percent Change: 0.2% Day Change: 0.17 | |
| Week Change: -2.25% Year-to-date Change: -28.5% | |
| BCC Links: Profile News Message Board | |
| Charts:- Daily , Weekly | |
| Add BCC to Watchlist: View: Get Complete BCC Trend Analysis ➞ | |
 | TRS TriMas Corporation |
| Sector: Industrials | |
| SubSector: Industrial Equipment & Components | |
| MarketCap: 963.509 Millions | |
| Recent Price: 38.67 Smart Investing & Trading Score: 80 | |
| Day Percent Change: 0.86% Day Change: 0.32 | |
| Week Change: 1.89% Year-to-date Change: 53.9% | |
| TRS Links: Profile News Message Board | |
| Charts:- Daily , Weekly | |
| Add TRS to Watchlist: View: Get Complete TRS Trend Analysis ➞ | |
 | CRK Comstock Resources, Inc. |
| Sector: Energy | |
| SubSector: Independent Oil & Gas | |
| MarketCap: 959.793 Millions | |
| Recent Price: 15.77 Smart Investing & Trading Score: 60 | |
| Day Percent Change: 1.36% Day Change: 0.21 | |
| Week Change: -1.95% Year-to-date Change: -14.3% | |
| CRK Links: Profile News Message Board | |
| Charts:- Daily , Weekly | |
| Add CRK to Watchlist: View: Get Complete CRK Trend Analysis ➞ | |
 | AMWD American Woodmark Corporation |
| Sector: Consumer Staples | |
| SubSector: Home Furnishings & Fixtures | |
| MarketCap: 958.435 Millions | |
| Recent Price: 66.47 Smart Investing & Trading Score: 50 | |
| Day Percent Change: 0.02% Day Change: 0.01 | |
| Week Change: -3.62% Year-to-date Change: -21.6% | |
| AMWD Links: Profile News Message Board | |
| Charts:- Daily , Weekly | |
| Add AMWD to Watchlist: View: Get Complete AMWD Trend Analysis ➞ | |
 | CENTA Central Garden & Pet Company |
| Sector: Materials | |
| SubSector: Agricultural Chemicals | |
| MarketCap: 953 Millions | |
| Recent Price: 32.66 Smart Investing & Trading Score: 70 | |
| Day Percent Change: 1.23% Day Change: 0.39 | |
| Week Change: -1.77% Year-to-date Change: -2.5% | |
| CENTA Links: Profile News Message Board | |
| Charts:- Daily , Weekly | |
| Add CENTA to Watchlist: View: Get Complete CENTA Trend Analysis ➞ | |
 | LZB La-Z-Boy Incorporated |
| Sector: Consumer Staples | |
| SubSector: Home Furnishings & Fixtures | |
| MarketCap: 951.635 Millions | |
| Recent Price: 36.86 Smart Investing & Trading Score: 30 | |
| Day Percent Change: 1.22% Day Change: 0.42 | |
| Week Change: -9.87% Year-to-date Change: -19.3% | |
| LZB Links: Profile News Message Board | |
| Charts:- Daily , Weekly | |
| Add LZB to Watchlist: View: Get Complete LZB Trend Analysis ➞ | |
 | AESI Atlas Energy Solutions Inc. |
| Sector: Energy | |
| SubSector: Oil & Gas Equipment & Services | |
| MarketCap: 947 Millions | |
| Recent Price: 11.70 Smart Investing & Trading Score: 46 | |
| Day Percent Change: 0% Day Change: 0 | |
| Week Change: -0.53% Year-to-date Change: -47.7% | |
| AESI Links: Profile News Message Board | |
| Charts:- Daily , Weekly | |
| Add AESI to Watchlist: View: Get Complete AESI Trend Analysis ➞ | |
 | PIII P3 Health Partners Inc. |
| Sector: Health Care | |
| SubSector: Medical Care Facilities | |
| MarketCap: 944 Millions | |
| Recent Price: 7.85 Smart Investing & Trading Score: 100 | |
| Day Percent Change: -0.07% Day Change: 0 | |
| Week Change: 5.33% Year-to-date Change: -35.0% | |
| PIII Links: Profile News Message Board | |
| Charts:- Daily , Weekly | |
| Add PIII to Watchlist: View: Get Complete PIII Trend Analysis ➞ | |
 | MEI Methode Electronics, Inc. |
| Sector: Technology | |
| SubSector: Diversified Electronics | |
| MarketCap: 941.896 Millions | |
| Recent Price: 7.76 Smart Investing & Trading Score: 80 | |
| Day Percent Change: -0.3% Day Change: -0.02 | |
| Week Change: -2.2% Year-to-date Change: -40.8% | |
| MEI Links: Profile News Message Board | |
| Charts:- Daily , Weekly | |
| Add MEI to Watchlist: View: Get Complete MEI Trend Analysis ➞ | |
 | FLWS 1-800-FLOWERS.COM, Inc. |
| Sector: Services & Goods | |
| SubSector: Specialty Retail, Other | |
| MarketCap: 940 Millions | |
| Recent Price: 5.60 Smart Investing & Trading Score: 70 | |
| Day Percent Change: -2.18% Day Change: -0.12 | |
| Week Change: -3.06% Year-to-date Change: -34.2% | |
| FLWS Links: Profile News Message Board | |
| Charts:- Daily , Weekly | |
| Add FLWS to Watchlist: View: Get Complete FLWS Trend Analysis ➞ | |
| For tabular summary view of above stock list: Summary View ➞ 0 - 25 , 25 - 50 , 50 - 75 , 75 - 100 , 100 - 125 , 125 - 150 , 150 - 175 , 175 - 200 , 200 - 225 , 225 - 250 , 250 - 275 , 275 - 300 , 300 - 325 | ||
| Click To Change The Sort Order: By Market Cap or Company Size Performance: Year-to-date, Week and Day | |
| Select Chart Type: | ||
| Too many stocks? View smallcap stocks filtered by marketcap & sector |
| Marketcap: All SmallCap Stocks (default-no microcap), Large, Mid-Range, Small & MicroCap |
| Sector: Tech, Finance, Energy, Staples, Retail, Industrial, Materials, Utilities & Medical |
|
Best Stocks Today 12Stocks.com |
© 2025 12Stocks.com Terms & Conditions Privacy Contact Us
All Information Provided Only For Education And Not To Be Used For Investing or Trading. See Terms & Conditions


One More Thing ... Get Best Stocks Delivered Daily!
Never Ever Miss A Move With Our Top Ten Stocks Lists
Find Best Stocks In Any Market - Bull or Bear Market
Take A Peek At Our Top Ten Stocks Lists: Daily, Weekly, Year-to-Date & Top Trends
Find Best Stocks In Any Market - Bull or Bear Market
Take A Peek At Our Top Ten Stocks Lists: Daily, Weekly, Year-to-Date & Top Trends
Smallcap Stocks With Best Up Trends [0-bearish to 100-bullish]: Cato [100], ALX Oncology[100], Cooper-Standard [100], Precigen [100], Designer Brands[100], Babcock & Wilcox Enterprises[100], Design [100], Ironwood [100], Teekay Tankers[100], Green Plains[100], i-80 Gold[100]
Best Smallcap Stocks Year-to-Date:
Celcuity [284.87%], OptimizeRx [232.1%], Precigen [225%], CommScope Holding[195.39%], Willdan Group[179%], 908 Devices[173.64%], Centrus Energy[166.15%], nLIGHT [157.86%], Cooper-Standard [153.02%], Rigel [149.64%], Kratos Defense[145.56%] Best Smallcap Stocks This Week:
Precigen [96.76%], ALX Oncology[57.25%], Immuneering [52.3%], Plymouth Industrial[40.4%], Array [37.99%], Cato [34.15%], SelectQuote [30.15%], Karyopharm [29.46%], Zentalis [26.35%], Guess [25.88%], Shoals [25.49%] Best Smallcap Stocks Daily:
SelectQuote [41.53%], Immuneering [34.99%], Cato [34.15%], ALX Oncology[23.8%], Cooper-Standard [16.38%], Tyra Biosciences[14.26%], Zentalis [14.02%], Zura Bio[13.71%], X4 [13.57%], Precigen [13.4%], Mersana [11.25%]