
 Login Sign Up


| |||||
 |  | ||||

| 12Stocks.com Market Intelligence |
Best SmallCap Stocks
|
| In a hurry? Small Cap Stock Lists: Performance Trends Table, Stock Charts
Sort Small Cap stocks: Daily, Weekly, Year-to-Date, Market Cap & Trends. Filter Small Cap stocks list by sector: Show all, Tech, Finance, Energy, Staples, Retail, Industrial, Materials, Utilities and HealthCare Filter Small Cap stocks list by size: All Large Medium Small and MicroCap |
| 12Stocks.com Small Cap Stocks Performances & Trends Daily | |||||||||
|
|  The overall Smart Investing & Trading Score is 80 (0-bearish to 100-bullish) which puts Small Cap index in short term neutral to bullish trend. The Smart Investing & Trading Score from previous trading session is 100 and hence a deterioration of trend.
| ||||||||
Here are the Smart Investing & Trading Scores of the most requested small cap stocks at 12Stocks.com (click stock name for detailed review):
|


| 12Stocks.com: Investing in Smallcap Index with Stocks | |
|
The following table helps investors and traders sort through current performance and trends (as measured by Smart Investing & Trading Score) of various
stocks in the Smallcap Index. Quick View: Move mouse or cursor over stock symbol (ticker) to view short-term technical chart and over stock name to view long term chart. Click on  to add stock symbol to your watchlist and to add stock symbol to your watchlist and  to view watchlist. Click on any ticker or stock name for detailed market intelligence report for that stock. to view watchlist. Click on any ticker or stock name for detailed market intelligence report for that stock. |
12Stocks.com Performance of Stocks in Smallcap Index
| Ticker | Stock Name | Watchlist | Category | Recent Price | Smart Investing & Trading Score | Change % | YTD Change% |
| MNTK | Montauk Renewables |   | Utilities | 2.19 | 60 | 4.52 | -47.74% |
| CDZI | Cadiz | | Utilities | 3.66 | 60 | 2.99 | -33.65% |
| EE | Excelerate Energy | | Utilities | 24.44 | 50 | 2.95 | -19.03% |
| RGCO | RGC Resources | | Utilities | 22.24 | 70 | 1.06 | 12.69% |
| BE | Bloom Energy | | Utilities | 50.85 | 100 | 0.72 | 101.85% |
| ORA | Ormat | | Utilities | 92.31 | 70 | 0.35 | 37.19% |
| CWCO | Consolidated Water | | Utilities | 33.38 | 70 | 0.31 | 27.58% |
| GWRS | Global Water | | Utilities | 9.66 | 0 | 0.31 | -13.99% |
| ARIS | Aris Water | | Utilities | 23.86 | 80 | 0.30 | 0.19% |
| SWX | Southwest Gas | | Utilities | 78.21 | 100 | 0.24 | 10.16% |
| OGS | ONE Gas | | Utilities | 76.52 | 100 | 0.19 | 10.64% |
| CWT | California Water | | Utilities | 47.15 | 80 | 0.17 | 5.21% |
| CPK | Chesapeake Utilities | | Utilities | 123.82 | 50 | 0.07 | 3.81% |
| NJR | New Jersey | | Utilities | 47.42 | 90 | 0.06 | 2.76% |
| YORW | York Water | | Utilities | 31.27 | 50 | 0.03 | -3.76% |
| NWN | Northwest Natural | | Utilities | 41.50 | 90 | -0.05 | 6.63% |
| ALE | ALLETE | | Utilities | 64.33 | 0 | -0.08 | 1.78% |
| OTTR | Otter Tail | | Utilities | 84.99 | 60 | -0.10 | 14.04% |
| BIPC | Brookfield Infrastructure | | Utilities | 40.51 | 50 | -0.18 | -0.53% |
| SR | Spire | | Utilities | 76.95 | 80 | -0.20 | 14.42% |
| MGEE | MGE Energy | | Utilities | 87.49 | 20 | -0.21 | -8.72% |
| ARTNA | Artesian Resources | | Utilities | 33.19 | 20 | -0.27 | 6.23% |
| BKH | Black Hills | | Utilities | 60.32 | 50 | -0.52 | 4.42% |
| AVA | Avista | | Utilities | 37.05 | 0 | -0.52 | 2.54% |
| MSEX | Middlesex Water | | Utilities | 53.98 | 80 | -0.56 | 1.65% |
| For chart view version of above stock list: Chart View ➞ 0 - 25 , 25 - 50 | ||
 | Click To Change The Sort Order: By Market Cap or Company Size Performance: Year-to-date, Week and Day |  |
| Too many stocks? View smallcap stocks filtered by marketcap & sector |
| Marketcap: All SmallCap Stocks (default-no microcap), Large, Mid-Range, Small |
| Smallcap Sector: Tech, Finance, Energy, Staples, Retail, Industrial, Materials, & Medical |
|
Get the most comprehensive stock market coverage daily at 12Stocks.com ➞ Best Stocks Today ➞ Best Stocks Weekly ➞ Best Stocks Year-to-Date ➞ Best Stocks Trends ➞  Best Stocks Today 12Stocks.com Best Nasdaq Stocks ➞ Best S&P 500 Stocks ➞ Best Tech Stocks ➞ Best Biotech Stocks ➞ |
| Detailed Overview of SmallCap Stocks |
| SmallCap Technical Overview, Leaders & Laggards, Top SmallCap ETF Funds & Detailed SmallCap Stocks List, Charts, Trends & More |
| Smallcap: Technical Analysis, Trends & YTD Performance | |
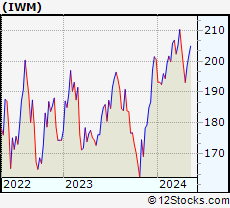
| SmallCap segment as represented by
IWM, an exchange-traded fund [ETF], holds basket of thousands of smallcap stocks from across all major sectors of the US stock market. The smallcap index (contains stocks like Riverbed & Sotheby's) is up by 4.36% and is currently underperforming the overall market by -2.9% year-to-date. Below is a quick view of technical charts and trends: | |
 IWM Weekly Chart |
|
| Long Term Trend: Very Good | |
| Medium Term Trend: Very Good | |
 IWM Daily Chart |
|
| Short Term Trend: Very Good | |
| Overall Trend Score: 80 | |
| YTD Performance: 4.36% | |
| **Trend Scores & Views Are Only For Educational Purposes And Not For Investing | |
| 12Stocks.com: Top Performing Small Cap Index Stocks | ||||||||||||||||||||||||||||||||||||||||||||||||
 The top performing Small Cap Index stocks year to date are
Now, more recently, over last week, the top performing Small Cap Index stocks on the move are


|
||||||||||||||||||||||||||||||||||||||||||||||||
| 12Stocks.com: Investing in Smallcap Index using Exchange Traded Funds | |
|
The following table shows list of key exchange traded funds (ETF) that
help investors track Smallcap index. The following list also includes leveraged ETF funds that track twice or thrice the daily returns of Smallcap indices. Short or inverse ETF funds move in the opposite direction to the index they track and are useful during market pullbacks or during bear markets. Quick View: Move mouse or cursor over ETF symbol (ticker) to view short-term technical chart and over ETF name to view long term chart. Click on ticker or stock name for detailed view. Click on to add stock symbol to your watchlist and to view watchlist. |
12Stocks.com List of ETFs that track Smallcap Index
| Ticker | ETF Name | Watchlist | Recent Price | Smart Investing & Trading Score | Change % | Week % | Year-to-date % |
| IWM | iShares Russell 2000 | | 235.17 | 80 | -0.44 | 0.14 | 4.36% |
| IJR | iShares Core S&P Small-Cap | | 118.76 | 100 | -0.08 | -0.89 | -0.29% |
| VTWO | Vanguard Russell 2000 ETF | | 95.43 | 80 | 0.24 | -0.93 | 2.92% |
| IWN | iShares Russell 2000 Value | | 174.53 | 100 | -0.01 | -0.85 | 2.1% |
| IWO | iShares Russell 2000 Growth | | 308.59 | 80 | 0.51 | -1.11 | 3.5% |
| IJS | iShares S&P Small-Cap 600 Value | | 110.04 | 100 | -0.22 | -0.99 | -2.29% |
| IJT | iShares S&P Small-Cap 600 Growth | | 141.94 | 70 | 0.05 | -0.89 | 1.68% |
| XSLV | PowerShares S&P SmallCap Low Volatil ETF | | 47.68 | 100 | -0.3 | -0.13 | -1.1% |
| SAA | ProShares Ultra SmallCap600 | | 25.65 | 100 | -0.31 | -2.17 | -8.34% |
| SMLV | SPDR SSGA US Small Cap Low Volatil ETF | | 133.28 | 100 | -0.09 | 2.75 | 2.13% |
| SDD | ProShares UltraShort SmallCap600 | | 13.29 | 30 | -100 | -100 | -100% |
| SBB | ProShares Short SmallCap600 | | 13.98 | 20 | 0.15 | 0.97 | 0.93% |
| 12Stocks.com: Charts, Trends, Fundamental Data and Performances of SmallCap Stocks | |
|
We now take in-depth look at all SmallCap stocks including charts, multi-period performances and overall trends (as measured by Smart Investing & Trading Score). One can sort SmallCap stocks (click link to choose) by Daily, Weekly and by Year-to-Date performances. Also, one can sort by size of the company or by market capitalization. |
| Select Your Default Chart Type: | |||||
| |||||
| Click on stock symbol or name for detailed view. Click on to add stock symbol to your watchlist and to view watchlist. Quick View: Move mouse or cursor over "Daily" to quickly view daily technical stock chart and over "Weekly" to view weekly technical stock chart. | |||||

 | MNTK Montauk Renewables, Inc. |
| Sector: Utilities | |
| SubSector: Utilities - Diversified | |
| MarketCap: 1020 Millions | |
| Recent Price: 2.19 Smart Investing & Trading Score: 60 | |
| Day Percent Change: 4.52% Day Change: 0.09 | |
| Week Change: 2.97% Year-to-date Change: -47.7% | |
| MNTK Links: Profile News Message Board | |
| Charts:- Daily , Weekly | |
| Add MNTK to Watchlist: View: Get Complete MNTK Trend Analysis ➞ | |
 | CDZI Cadiz Inc. |
| Sector: Utilities | |
| SubSector: Water Utilities | |
| MarketCap: 265.502 Millions | |
| Recent Price: 3.66 Smart Investing & Trading Score: 60 | |
| Day Percent Change: 2.99% Day Change: 0.1 | |
| Week Change: -4.43% Year-to-date Change: -33.7% | |
| CDZI Links: Profile News Message Board | |
| Charts:- Daily , Weekly | |
| Add CDZI to Watchlist: View: Get Complete CDZI Trend Analysis ➞ | |
 | EE Excelerate Energy, Inc. |
| Sector: Utilities | |
| SubSector: Utilities - Renewable | |
| MarketCap: 2140 Millions | |
| Recent Price: 24.44 Smart Investing & Trading Score: 50 | |
| Day Percent Change: 2.95% Day Change: 0.7 | |
| Week Change: -0.04% Year-to-date Change: -19.0% | |
| EE Links: Profile News Message Board | |
| Charts:- Daily , Weekly | |
| Add EE to Watchlist: View: Get Complete EE Trend Analysis ➞ | |
 | RGCO RGC Resources, Inc. |
| Sector: Utilities | |
| SubSector: Gas Utilities | |
| MarketCap: 215.277 Millions | |
| Recent Price: 22.24 Smart Investing & Trading Score: 70 | |
| Day Percent Change: 1.06% Day Change: 0.23 | |
| Week Change: -0.23% Year-to-date Change: 12.7% | |
| RGCO Links: Profile News Message Board | |
| Charts:- Daily , Weekly | |
| Add RGCO to Watchlist: View: Get Complete RGCO Trend Analysis ➞ | |
 | BE Bloom Energy Corporation |
| Sector: Utilities | |
| SubSector: Electric Utilities | |
| MarketCap: 567.514 Millions | |
| Recent Price: 50.85 Smart Investing & Trading Score: 100 | |
| Day Percent Change: 0.72% Day Change: 0.32 | |
| Week Change: -0.62% Year-to-date Change: 101.9% | |
| BE Links: Profile News Message Board | |
| Charts:- Daily , Weekly | |
| Add BE to Watchlist: View: Get Complete BE Trend Analysis ➞ | |
 | ORA Ormat Technologies, Inc. |
| Sector: Utilities | |
| SubSector: Electric Utilities | |
| MarketCap: 3610.74 Millions | |
| Recent Price: 92.31 Smart Investing & Trading Score: 70 | |
| Day Percent Change: 0.35% Day Change: 0.32 | |
| Week Change: 4.8% Year-to-date Change: 37.2% | |
| ORA Links: Profile News Message Board | |
| Charts:- Daily , Weekly | |
| Add ORA to Watchlist: View: Get Complete ORA Trend Analysis ➞ | |
 | CWCO Consolidated Water Co. Ltd. |
| Sector: Utilities | |
| SubSector: Water Utilities | |
| MarketCap: 223.302 Millions | |
| Recent Price: 33.38 Smart Investing & Trading Score: 70 | |
| Day Percent Change: 0.31% Day Change: 0.1 | |
| Week Change: -0.43% Year-to-date Change: 27.6% | |
| CWCO Links: Profile News Message Board | |
| Charts:- Daily , Weekly | |
| Add CWCO to Watchlist: View: Get Complete CWCO Trend Analysis ➞ | |
 | GWRS Global Water Resources, Inc. |
| Sector: Utilities | |
| SubSector: Water Utilities | |
| MarketCap: 253.502 Millions | |
| Recent Price: 9.66 Smart Investing & Trading Score: 0 | |
| Day Percent Change: 0.31% Day Change: 0.03 | |
| Week Change: -2.11% Year-to-date Change: -14.0% | |
| GWRS Links: Profile News Message Board | |
| Charts:- Daily , Weekly | |
| Add GWRS to Watchlist: View: Get Complete GWRS Trend Analysis ➞ | |
 | ARIS Aris Water Solutions, Inc. |
| Sector: Utilities | |
| SubSector: Utilities - Regulated Water | |
| MarketCap: 575 Millions | |
| Recent Price: 23.86 Smart Investing & Trading Score: 80 | |
| Day Percent Change: 0.3% Day Change: 0.07 | |
| Week Change: -1.04% Year-to-date Change: 0.2% | |
| ARIS Links: Profile News Message Board | |
| Charts:- Daily , Weekly | |
| Add ARIS to Watchlist: View: Get Complete ARIS Trend Analysis ➞ | |
 | SWX Southwest Gas Holdings, Inc. |
| Sector: Utilities | |
| SubSector: Gas Utilities | |
| MarketCap: 3427.87 Millions | |
| Recent Price: 78.21 Smart Investing & Trading Score: 100 | |
| Day Percent Change: 0.24% Day Change: 0.18 | |
| Week Change: -3.65% Year-to-date Change: 10.2% | |
| SWX Links: Profile News Message Board | |
| Charts:- Daily , Weekly | |
| Add SWX to Watchlist: View: Get Complete SWX Trend Analysis ➞ | |
 | OGS ONE Gas, Inc. |
| Sector: Utilities | |
| SubSector: Gas Utilities | |
| MarketCap: 4051.17 Millions | |
| Recent Price: 76.52 Smart Investing & Trading Score: 100 | |
| Day Percent Change: 0.19% Day Change: 0.14 | |
| Week Change: -1.35% Year-to-date Change: 10.6% | |
| OGS Links: Profile News Message Board | |
| Charts:- Daily , Weekly | |
| Add OGS to Watchlist: View: Get Complete OGS Trend Analysis ➞ | |
 | CWT California Water Service Group |
| Sector: Utilities | |
| SubSector: Water Utilities | |
| MarketCap: 2790.92 Millions | |
| Recent Price: 47.15 Smart Investing & Trading Score: 80 | |
| Day Percent Change: 0.17% Day Change: 0.08 | |
| Week Change: 0.86% Year-to-date Change: 5.2% | |
| CWT Links: Profile News Message Board | |
| Charts:- Daily , Weekly | |
| Add CWT to Watchlist: View: Get Complete CWT Trend Analysis ➞ | |
 | CPK Chesapeake Utilities Corporation |
| Sector: Utilities | |
| SubSector: Gas Utilities | |
| MarketCap: 1465.77 Millions | |
| Recent Price: 123.82 Smart Investing & Trading Score: 50 | |
| Day Percent Change: 0.07% Day Change: 0.09 | |
| Week Change: -0.16% Year-to-date Change: 3.8% | |
| CPK Links: Profile News Message Board | |
| Charts:- Daily , Weekly | |
| Add CPK to Watchlist: View: Get Complete CPK Trend Analysis ➞ | |
 | NJR New Jersey Resources Corporation |
| Sector: Utilities | |
| SubSector: Gas Utilities | |
| MarketCap: 3320.27 Millions | |
| Recent Price: 47.42 Smart Investing & Trading Score: 90 | |
| Day Percent Change: 0.06% Day Change: 0.03 | |
| Week Change: -1.01% Year-to-date Change: 2.8% | |
| NJR Links: Profile News Message Board | |
| Charts:- Daily , Weekly | |
| Add NJR to Watchlist: View: Get Complete NJR Trend Analysis ➞ | |
 | YORW The York Water Company |
| Sector: Utilities | |
| SubSector: Water Utilities | |
| MarketCap: 539.502 Millions | |
| Recent Price: 31.27 Smart Investing & Trading Score: 50 | |
| Day Percent Change: 0.03% Day Change: 0.01 | |
| Week Change: 1.27% Year-to-date Change: -3.8% | |
| YORW Links: Profile News Message Board | |
| Charts:- Daily , Weekly | |
| Add YORW to Watchlist: View: Get Complete YORW Trend Analysis ➞ | |
 | NWN Northwest Natural Holding Company |
| Sector: Utilities | |
| SubSector: Gas Utilities | |
| MarketCap: 2058.17 Millions | |
| Recent Price: 41.50 Smart Investing & Trading Score: 90 | |
| Day Percent Change: -0.05% Day Change: -0.02 | |
| Week Change: -0.29% Year-to-date Change: 6.6% | |
| NWN Links: Profile News Message Board | |
| Charts:- Daily , Weekly | |
| Add NWN to Watchlist: View: Get Complete NWN Trend Analysis ➞ | |
 | ALE ALLETE, Inc. |
| Sector: Utilities | |
| SubSector: Diversified Utilities | |
| MarketCap: 3145.4 Millions | |
| Recent Price: 64.33 Smart Investing & Trading Score: 0 | |
| Day Percent Change: -0.08% Day Change: -0.05 | |
| Week Change: -1.9% Year-to-date Change: 1.8% | |
| ALE Links: Profile News Message Board | |
| Charts:- Daily , Weekly | |
| Add ALE to Watchlist: View: Get Complete ALE Trend Analysis ➞ | |
 | OTTR Otter Tail Corporation |
| Sector: Utilities | |
| SubSector: Diversified Utilities | |
| MarketCap: 1728.2 Millions | |
| Recent Price: 84.99 Smart Investing & Trading Score: 60 | |
| Day Percent Change: -0.1% Day Change: -0.08 | |
| Week Change: 1.21% Year-to-date Change: 14.0% | |
| OTTR Links: Profile News Message Board | |
| Charts:- Daily , Weekly | |
| Add OTTR to Watchlist: View: Get Complete OTTR Trend Analysis ➞ | |
 | BIPC Brookfield Infrastructure Corporation |
| Sector: Utilities | |
| SubSector: Utilities Regulated Gas | |
| MarketCap: 31197 Millions | |
| Recent Price: 40.51 Smart Investing & Trading Score: 50 | |
| Day Percent Change: -0.18% Day Change: -0.07 | |
| Week Change: 1.06% Year-to-date Change: -0.5% | |
| BIPC Links: Profile News Message Board | |
| Charts:- Daily , Weekly | |
| Add BIPC to Watchlist: View: Get Complete BIPC Trend Analysis ➞ | |
 | SR Spire Inc. |
| Sector: Utilities | |
| SubSector: Gas Utilities | |
| MarketCap: 3745.87 Millions | |
| Recent Price: 76.95 Smart Investing & Trading Score: 80 | |
| Day Percent Change: -0.2% Day Change: -0.15 | |
| Week Change: -1.96% Year-to-date Change: 14.4% | |
| SR Links: Profile News Message Board | |
| Charts:- Daily , Weekly | |
| Add SR to Watchlist: View: Get Complete SR Trend Analysis ➞ | |
 | MGEE MGE Energy, Inc. |
| Sector: Utilities | |
| SubSector: Diversified Utilities | |
| MarketCap: 2608.3 Millions | |
| Recent Price: 87.49 Smart Investing & Trading Score: 20 | |
| Day Percent Change: -0.21% Day Change: -0.18 | |
| Week Change: 0.37% Year-to-date Change: -8.7% | |
| MGEE Links: Profile News Message Board | |
| Charts:- Daily , Weekly | |
| Add MGEE to Watchlist: View: Get Complete MGEE Trend Analysis ➞ | |
 | ARTNA Artesian Resources Corporation |
| Sector: Utilities | |
| SubSector: Water Utilities | |
| MarketCap: 299.402 Millions | |
| Recent Price: 33.19 Smart Investing & Trading Score: 20 | |
| Day Percent Change: -0.27% Day Change: -0.09 | |
| Week Change: -1.08% Year-to-date Change: 6.2% | |
| ARTNA Links: Profile News Message Board | |
| Charts:- Daily , Weekly | |
| Add ARTNA to Watchlist: View: Get Complete ARTNA Trend Analysis ➞ | |
 | BKH Black Hills Corporation |
| Sector: Utilities | |
| SubSector: Electric Utilities | |
| MarketCap: 3666.94 Millions | |
| Recent Price: 60.32 Smart Investing & Trading Score: 50 | |
| Day Percent Change: -0.52% Day Change: -0.31 | |
| Week Change: -3.07% Year-to-date Change: 4.4% | |
| BKH Links: Profile News Message Board | |
| Charts:- Daily , Weekly | |
| Add BKH to Watchlist: View: Get Complete BKH Trend Analysis ➞ | |
 | AVA Avista Corporation |
| Sector: Utilities | |
| SubSector: Diversified Utilities | |
| MarketCap: 2755.7 Millions | |
| Recent Price: 37.05 Smart Investing & Trading Score: 0 | |
| Day Percent Change: -0.52% Day Change: -0.19 | |
| Week Change: -2.37% Year-to-date Change: 2.5% | |
| AVA Links: Profile News Message Board | |
| Charts:- Daily , Weekly | |
| Add AVA to Watchlist: View: Get Complete AVA Trend Analysis ➞ | |
 | MSEX Middlesex Water Company |
| Sector: Utilities | |
| SubSector: Water Utilities | |
| MarketCap: 1082.02 Millions | |
| Recent Price: 53.98 Smart Investing & Trading Score: 80 | |
| Day Percent Change: -0.56% Day Change: -0.3 | |
| Week Change: -0.41% Year-to-date Change: 1.7% | |
| MSEX Links: Profile News Message Board | |
| Charts:- Daily , Weekly | |
| Add MSEX to Watchlist: View: Get Complete MSEX Trend Analysis ➞ | |
| For tabular summary view of above stock list: Summary View ➞ 0 - 25 , 25 - 50 | ||
| Click To Change The Sort Order: By Market Cap or Company Size Performance: Year-to-date, Week and Day | |
| Select Chart Type: | ||
| Too many stocks? View smallcap stocks filtered by marketcap & sector |
| Marketcap: All SmallCap Stocks (default-no microcap), Large, Mid-Range, Small & MicroCap |
| Sector: Tech, Finance, Energy, Staples, Retail, Industrial, Materials, Utilities & Medical |
|
Best Stocks Today 12Stocks.com |
© 2025 12Stocks.com Terms & Conditions Privacy Contact Us
All Information Provided Only For Education And Not To Be Used For Investing or Trading. See Terms & Conditions


One More Thing ... Get Best Stocks Delivered Daily!
Never Ever Miss A Move With Our Top Ten Stocks Lists
Find Best Stocks In Any Market - Bull or Bear Market
Take A Peek At Our Top Ten Stocks Lists: Daily, Weekly, Year-to-Date & Top Trends
Find Best Stocks In Any Market - Bull or Bear Market
Take A Peek At Our Top Ten Stocks Lists: Daily, Weekly, Year-to-Date & Top Trends
Smallcap Stocks With Best Up Trends [0-bearish to 100-bullish]: Cato [100], ALX Oncology[100], Cooper-Standard [100], Precigen [100], Designer Brands[100], Babcock & Wilcox Enterprises[100], Design [100], Ironwood [100], Teekay Tankers[100], Green Plains[100], i-80 Gold[100]
Best Smallcap Stocks Year-to-Date:
Celcuity [284.87%], OptimizeRx [232.1%], Precigen [225%], CommScope Holding[195.39%], Willdan Group[179%], 908 Devices[173.64%], Centrus Energy[166.15%], nLIGHT [157.86%], Cooper-Standard [153.02%], Rigel [149.64%], Kratos Defense[145.56%] Best Smallcap Stocks This Week:
Precigen [96.76%], ALX Oncology[57.25%], Immuneering [52.3%], Plymouth Industrial[40.4%], Array [37.99%], Cato [34.15%], SelectQuote [30.15%], Karyopharm [29.46%], Zentalis [26.35%], Guess [25.88%], Shoals [25.49%] Best Smallcap Stocks Daily:
SelectQuote [41.53%], Immuneering [34.99%], Cato [34.15%], ALX Oncology[23.8%], Cooper-Standard [16.38%], Tyra Biosciences[14.26%], Zentalis [14.02%], Zura Bio[13.71%], X4 [13.57%], Precigen [13.4%], Mersana [11.25%]