
 Login Sign Up


| |||||
 |  | ||||

| 12Stocks.com Market Intelligence |
Best Materials Stocks
| In a hurry? Materials Stocks Lists: Performance Trends Table, Stock Charts
Sort Materials stocks: Daily, Weekly, Year-to-Date, Market Cap & Trends. Filter Materials stocks list by size: All Materials Large Mid-Range Small |
| 12Stocks.com Materials Stocks Performances & Trends Daily | |||||||||
|
|  The overall Smart Investing & Trading Score is 90 (0-bearish to 100-bullish) which puts Materials sector in short term bullish trend. The Smart Investing & Trading Score from previous trading session is 70 and hence an improvement of trend.
| ||||||||
Here are the Smart Investing & Trading Scores of the most requested Materials stocks at 12Stocks.com (click stock name for detailed review):
|


| Consider signing up for our daily 12Stocks.com "Best Stocks Newsletter". You will never ever miss a big stock move again! |
| 12Stocks.com: Investing in Materials sector with Stocks | |
|
The following table helps investors and traders sort through current performance and trends (as measured by Smart Investing & Trading Score) of various
stocks in the Materials sector. Quick View: Move mouse or cursor over stock symbol (ticker) to view short-term Technical chart and over stock name to view long term chart. Click on  to add stock symbol to your watchlist and to add stock symbol to your watchlist and  to view watchlist. Click on any ticker or stock name for detailed market intelligence report for that stock. to view watchlist. Click on any ticker or stock name for detailed market intelligence report for that stock. |
12Stocks.com Performance of Stocks in Materials Sector
| Ticker | Stock Name | Watchlist | Category | Recent Price | Smart Investing & Trading Score | Change % | YTD Change% |
| ASTL | Algoma Steel |   | Steel | 4.58 | 50 | 5.05% | -52.42% |
| DDC | Dominion Diamond | | Mining | 13.45 | 60 | 28.83% | 207.43% |
| EQX | Equinox Gold | | Gold | 7.90 | 90 | 1.94% | 57.37% |
| MTRN | Materion | | Metals/Minerals | 109.59 | 90 | -0.12% | 11.18% |
| LVRO | Lavoro | | Agricultural Inputs | 1.67 | 71 | -1.76% | -65.14% |
| CSTM | Constellium SE | | Aluminum | 14.24 | 90 | -1.11% | 38.66% |
| IAUX | i-80 Gold | | Gold | 0.72 | 100 | 6.31% | 48.29% |
| ORGN | Origin | | Chemicals | 0.57 | 50 | 7.47% | -55.50% |
| ARLP | Alliance | | Metals/Minerals | 23.16 | 30 | 0.83% | -5.08% |
| SA | Seabridge Gold | | Gold | 16.39 | 70 | 1.24% | 43.65% |
| DRD | DRDGOLD | | Gold | 16.74 | 80 | 8.49% | 96.24% |
| TG | Tredegar | | Chemicals | 7.60 | 50 | 0.00% | -1.04% |
| WLKP | Westlake Chemical | | Chemicals | 22.01 | 90 | -0.41% | 1.11% |
| SVM | Silvercorp Metals | | Silver | 4.47 | 70 | 1.59% | 49.43% |
| OEC | Orion Engineered | | Chemicals | 10.19 | 60 | -0.97% | -35.13% |
| IONR | ioneer | | Other Industrial Metals & Mining | 3.23 | 48 | 1.09% | -18.92% |
| METCB | Ramaco | | Coking Coal | 15.39 | 78 | 0.72% | 63.10% |
| ACET | Aceto | | Chemicals | 0.68 | 90 | 6.67% | -29.03% |
| FF | FutureFuel | | Chemicals | 3.71 | 70 | -1.33% | -27.79% |
| NEXA | Nexa | | Metals/Minerals | 4.90 | 70 | 1.03% | -43.15% |
| AVD | American Vanguard | | Chemicals | 5.02 | 90 | -3.09% | 8.42% |
| HWKN | Hawkins | | Chemicals | 168.09 | 40 | 0.11% | 37.43% |
| NGD | New Gold | | Gold | 5.44 | 100 | 3.42% | 119.35% |
| VHI | Valhi | | Chemicals | 16.35 | 70 | 1.87% | -29.40% |
| ASIX | AdvanSix | | Chemicals | 19.73 | 70 | -1.35% | -29.24% |
| For chart view version of above stock list: Chart View ➞ 0 - 25 , 25 - 50 , 50 - 75 , 75 - 100 , 100 - 125 , 125 - 150 , 150 - 175 | ||
 | Click To Change The Sort Order: By Market Cap or Company Size Performance: Year-to-date, Week and Day |  |
|
Get the most comprehensive stock market coverage daily at 12Stocks.com ➞ Best Stocks Today ➞ Best Stocks Weekly ➞ Best Stocks Year-to-Date ➞ Best Stocks Trends ➞  Best Stocks Today 12Stocks.com Best Nasdaq Stocks ➞ Best S&P 500 Stocks ➞ Best Tech Stocks ➞ Best Biotech Stocks ➞ |
| Detailed Overview of Materials Stocks |
| Materials Technical Overview, Leaders & Laggards, Top Materials ETF Funds & Detailed Materials Stocks List, Charts, Trends & More |
| Materials Sector: Technical Analysis, Trends & YTD Performance | |
| Materials sector is composed of stocks
from mining, metals, agricultural, precious metals
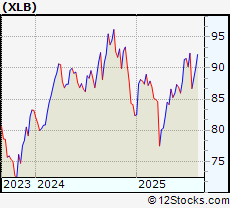
and chemical subsectors. Materials sector, as represented by XLB, an exchange-traded fund [ETF] that holds basket of Materials stocks (e.g, Dow Chemical, Newmont Mining) is up by 4.84% and is currently underperforming the overall market by -2.41% year-to-date. Below is a quick view of Technical charts and trends: |
|
 XLB Weekly Chart |
|
| Long Term Trend: Very Good | |
| Medium Term Trend: Very Good | |
 XLB Daily Chart |
|
| Short Term Trend: Very Good | |
| Overall Trend Score: 90 | |
| YTD Performance: 4.84% | |
| **Trend Scores & Views Are Only For Educational Purposes And Not For Investing | |
| 12Stocks.com: Top Performing Materials Sector Stocks | ||||||||||||||||||||||||||||||||||||||||||||||||
 The top performing Materials sector stocks year to date are
Now, more recently, over last week, the top performing Materials sector stocks on the move are


|
||||||||||||||||||||||||||||||||||||||||||||||||
| 12Stocks.com: Investing in Materials Sector using Exchange Traded Funds | |
|
The following table shows list of key exchange traded funds (ETF) that
help investors track Materials Index. For detailed view, check out our ETF Funds section of our website. Quick View: Move mouse or cursor over ETF symbol (ticker) to view short-term Technical chart and over ETF name to view long term chart. Click on ticker or stock name for detailed view. Click on to add stock symbol to your watchlist and to view watchlist. |
12Stocks.com List of ETFs that track Materials Index
| Ticker | ETF Name | Watchlist | Recent Price | Smart Investing & Trading Score | Change % | Week % | Year-to-date % |
| XLB | Materials | | 92.18 | 90 | 1.98 | 2.39 | 4.84% |
| IYM | Basic Materials | | 146.07 | 100 | 0.24 | 0.13 | 13.21% |
| VAW | Materials | | 203.94 | 100 | 0.22 | 0.06 | 9.5% |
| GDX | Gold Miners | | 60.18 | 100 | 1.5 | 3.26 | 54.47% |
| UYM | Basic Materials | | 25.92 | 90 | 4.43 | 5.28 | 3.59% |
| XME | Metals and Mining | | 80.16 | 90 | 3.45 | 0.48 | 35.53% |
| MOO | Agribusiness | | 75.67 | 90 | 1.53 | 2.58 | 9.25% |
| DBA | Agriculture | | 27.59 | 100 | 1.14 | 1.96 | -0.04% |
| GLD | Gold | | 310.58 | 80 | 1.07 | 1.02 | 20.12% |
| SLV | Silver | | 35.33 | 90 | 2.08 | 2.41 | 23.92% |
| SLX | Steel | | 70.97 | 80 | 3.27 | 2.01 | 16.52% |
| COPX | Copper Miners | | 46.63 | 100 | 0.78 | 0.28 | 22.81% |
| SIL | Silver Miners | | 53.92 | 100 | 1.7 | 0.22 | 70% |
| MXI | Global Materials | | 88.52 | 100 | 0.11 | 0.47 | 14.18% |
| RTM | S&P 500 Eq | | 33.04 | 90 | 0.59 | 0.27 | 2.57% |
| GDXJ | Junior Gold Miners | | 74.77 | 100 | 2.03 | 2.75 | 74.9% |
| PSCM | SmallCap Materials | | 75.83 | 100 | -0.05 | -2.19 | 3.61% |
| 12Stocks.com: Charts, Trends, Fundamental Data and Performances of Materials Stocks | |
|
We now take in-depth look at all Materials stocks including charts, multi-period performances and overall trends (as measured by Smart Investing & Trading Score). One can sort Materials stocks (click link to choose) by Daily, Weekly and by Year-to-Date performances. Also, one can sort by size of the company or by market capitalization. |
| Select Your Default Chart Type: | |||||
| |||||
| Click on stock symbol or name for detailed view. Click on to add stock symbol to your watchlist and to view watchlist. Quick View: Move mouse or cursor over "Daily" to quickly view daily Technical stock chart and over "Weekly" to view weekly Technical stock chart. | |||||

 | ASTL Algoma Steel Group Inc. |
| Sector: Materials | |
| SubSector: Steel | |
| MarketCap: 731 Millions | |
| Recent Price: 4.58 Smart Investing & Trading Score: 50 | |
| Day Percent Change: 5.05% Day Change: 0.22 | |
| Week Change: -1.93% Year-to-date Change: -52.4% | |
| ASTL Links: Profile News Message Board | |
| Charts:- Daily , Weekly | |
| Add ASTL to Watchlist: View: Get Complete ASTL Trend Analysis ➞ | |
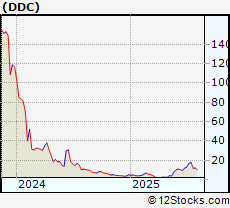 | DDC Dominion Diamond Corporation |
| Sector: Materials | |
| SubSector: Nonmetallic Mineral Mining | |
| MarketCap: 713.29 Millions | |
| Recent Price: 13.45 Smart Investing & Trading Score: 60 | |
| Day Percent Change: 28.83% Day Change: 3.01 | |
| Week Change: 33.17% Year-to-date Change: 207.4% | |
| DDC Links: Profile News Message Board | |
| Charts:- Daily , Weekly | |
| Add DDC to Watchlist: View: Get Complete DDC Trend Analysis ➞ | |
 | EQX Equinox Gold Corp. |
| Sector: Materials | |
| SubSector: Gold | |
| MarketCap: 706.119 Millions | |
| Recent Price: 7.90 Smart Investing & Trading Score: 90 | |
| Day Percent Change: 1.94% Day Change: 0.15 | |
| Week Change: 1.02% Year-to-date Change: 57.4% | |
| EQX Links: Profile News Message Board | |
| Charts:- Daily , Weekly | |
| Add EQX to Watchlist: View: Get Complete EQX Trend Analysis ➞ | |
 | MTRN Materion Corporation |
| Sector: Materials | |
| SubSector: Industrial Metals & Minerals | |
| MarketCap: 703.71 Millions | |
| Recent Price: 109.59 Smart Investing & Trading Score: 90 | |
| Day Percent Change: -0.12% Day Change: -0.13 | |
| Week Change: -2.75% Year-to-date Change: 11.2% | |
| MTRN Links: Profile News Message Board | |
| Charts:- Daily , Weekly | |
| Add MTRN to Watchlist: View: Get Complete MTRN Trend Analysis ➞ | |
 | LVRO Lavoro Limited |
| Sector: Materials | |
| SubSector: Agricultural Inputs | |
| MarketCap: 686 Millions | |
| Recent Price: 1.67 Smart Investing & Trading Score: 71 | |
| Day Percent Change: -1.76% Day Change: -0.03 | |
| Week Change: -18.54% Year-to-date Change: -65.1% | |
| LVRO Links: Profile News Message Board | |
| Charts:- Daily , Weekly | |
| Add LVRO to Watchlist: View: Get Complete LVRO Trend Analysis ➞ | |
 | CSTM Constellium SE |
| Sector: Materials | |
| SubSector: Aluminum | |
| MarketCap: 646.608 Millions | |
| Recent Price: 14.24 Smart Investing & Trading Score: 90 | |
| Day Percent Change: -1.11% Day Change: -0.16 | |
| Week Change: 1.14% Year-to-date Change: 38.7% | |
| CSTM Links: Profile News Message Board | |
| Charts:- Daily , Weekly | |
| Add CSTM to Watchlist: View: Get Complete CSTM Trend Analysis ➞ | |
 | IAUX i-80 Gold Corp. |
| Sector: Materials | |
| SubSector: Gold | |
| MarketCap: 616 Millions | |
| Recent Price: 0.72 Smart Investing & Trading Score: 100 | |
| Day Percent Change: 6.31% Day Change: 0.04 | |
| Week Change: 12.09% Year-to-date Change: 48.3% | |
| IAUX Links: Profile News Message Board | |
| Charts:- Daily , Weekly | |
| Add IAUX to Watchlist: View: Get Complete IAUX Trend Analysis ➞ | |
 | ORGN Origin Materials, Inc. |
| Sector: Materials | |
| SubSector: Chemicals | |
| MarketCap: 586 Millions | |
| Recent Price: 0.57 Smart Investing & Trading Score: 50 | |
| Day Percent Change: 7.47% Day Change: 0.04 | |
| Week Change: -32.09% Year-to-date Change: -55.5% | |
| ORGN Links: Profile News Message Board | |
| Charts:- Daily , Weekly | |
| Add ORGN to Watchlist: View: Get Complete ORGN Trend Analysis ➞ | |
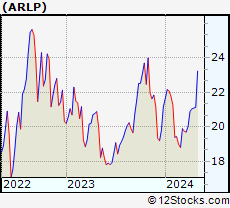 | ARLP Alliance Resource Partners, L.P. |
| Sector: Materials | |
| SubSector: Industrial Metals & Minerals | |
| MarketCap: 574.81 Millions | |
| Recent Price: 23.16 Smart Investing & Trading Score: 30 | |
| Day Percent Change: 0.83% Day Change: 0.19 | |
| Week Change: -9.07% Year-to-date Change: -5.1% | |
| ARLP Links: Profile News Message Board | |
| Charts:- Daily , Weekly | |
| Add ARLP to Watchlist: View: Get Complete ARLP Trend Analysis ➞ | |
 | SA Seabridge Gold Inc. |
| Sector: Materials | |
| SubSector: Gold | |
| MarketCap: 565.419 Millions | |
| Recent Price: 16.39 Smart Investing & Trading Score: 70 | |
| Day Percent Change: 1.24% Day Change: 0.2 | |
| Week Change: -1.09% Year-to-date Change: 43.7% | |
| SA Links: Profile News Message Board | |
| Charts:- Daily , Weekly | |
| Add SA to Watchlist: View: Get Complete SA Trend Analysis ➞ | |
 | DRD DRDGOLD Limited |
| Sector: Materials | |
| SubSector: Gold | |
| MarketCap: 556.919 Millions | |
| Recent Price: 16.74 Smart Investing & Trading Score: 80 | |
| Day Percent Change: 8.49% Day Change: 1.31 | |
| Week Change: 12.42% Year-to-date Change: 96.2% | |
| DRD Links: Profile News Message Board | |
| Charts:- Daily , Weekly | |
| Add DRD to Watchlist: View: Get Complete DRD Trend Analysis ➞ | |
 | TG Tredegar Corporation |
| Sector: Materials | |
| SubSector: Specialty Chemicals | |
| MarketCap: 545.057 Millions | |
| Recent Price: 7.60 Smart Investing & Trading Score: 50 | |
| Day Percent Change: 0% Day Change: 0 | |
| Week Change: 1.2% Year-to-date Change: -1.0% | |
| TG Links: Profile News Message Board | |
| Charts:- Daily , Weekly | |
| Add TG to Watchlist: View: Get Complete TG Trend Analysis ➞ | |
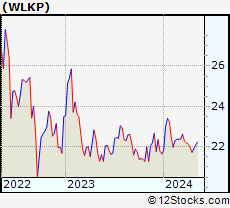 | WLKP Westlake Chemical Partners LP |
| Sector: Materials | |
| SubSector: Chemicals - Major Diversified | |
| MarketCap: 538.836 Millions | |
| Recent Price: 22.01 Smart Investing & Trading Score: 90 | |
| Day Percent Change: -0.41% Day Change: -0.09 | |
| Week Change: 0.36% Year-to-date Change: 1.1% | |
| WLKP Links: Profile News Message Board | |
| Charts:- Daily , Weekly | |
| Add WLKP to Watchlist: View: Get Complete WLKP Trend Analysis ➞ | |
 | SVM Silvercorp Metals Inc. |
| Sector: Materials | |
| SubSector: Silver | |
| MarketCap: 504.056 Millions | |
| Recent Price: 4.47 Smart Investing & Trading Score: 70 | |
| Day Percent Change: 1.59% Day Change: 0.07 | |
| Week Change: -1.97% Year-to-date Change: 49.4% | |
| SVM Links: Profile News Message Board | |
| Charts:- Daily , Weekly | |
| Add SVM to Watchlist: View: Get Complete SVM Trend Analysis ➞ | |
 | OEC Orion Engineered Carbons S.A. |
| Sector: Materials | |
| SubSector: Specialty Chemicals | |
| MarketCap: 493.457 Millions | |
| Recent Price: 10.19 Smart Investing & Trading Score: 60 | |
| Day Percent Change: -0.97% Day Change: -0.1 | |
| Week Change: -4.59% Year-to-date Change: -35.1% | |
| OEC Links: Profile News Message Board | |
| Charts:- Daily , Weekly | |
| Add OEC to Watchlist: View: Get Complete OEC Trend Analysis ➞ | |
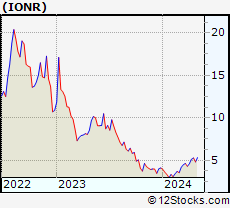 | IONR ioneer Ltd |
| Sector: Materials | |
| SubSector: Other Industrial Metals & Mining | |
| MarketCap: 471 Millions | |
| Recent Price: 3.23 Smart Investing & Trading Score: 48 | |
| Day Percent Change: 1.09% Day Change: 0.04 | |
| Week Change: -1.37% Year-to-date Change: -18.9% | |
| IONR Links: Profile News Message Board | |
| Charts:- Daily , Weekly | |
| Add IONR to Watchlist: View: Get Complete IONR Trend Analysis ➞ | |
 | METCB Ramaco Resources, Inc. |
| Sector: Materials | |
| SubSector: Coking Coal | |
| MarketCap: 469 Millions | |
| Recent Price: 15.39 Smart Investing & Trading Score: 78 | |
| Day Percent Change: 0.72% Day Change: 0.11 | |
| Week Change: -10.05% Year-to-date Change: 63.1% | |
| METCB Links: Profile News Message Board | |
| Charts:- Daily , Weekly | |
| Add METCB to Watchlist: View: Get Complete METCB Trend Analysis ➞ | |
 | ACET Aceto Corporation |
| Sector: Materials | |
| SubSector: Chemicals - Major Diversified | |
| MarketCap: 453.16 Millions | |
| Recent Price: 0.68 Smart Investing & Trading Score: 90 | |
| Day Percent Change: 6.67% Day Change: 0.04 | |
| Week Change: 5.06% Year-to-date Change: -29.0% | |
| ACET Links: Profile News Message Board | |
| Charts:- Daily , Weekly | |
| Add ACET to Watchlist: View: Get Complete ACET Trend Analysis ➞ | |
 | FF FutureFuel Corp. |
| Sector: Materials | |
| SubSector: Chemicals - Major Diversified | |
| MarketCap: 450.736 Millions | |
| Recent Price: 3.71 Smart Investing & Trading Score: 70 | |
| Day Percent Change: -1.33% Day Change: -0.05 | |
| Week Change: 0.54% Year-to-date Change: -27.8% | |
| FF Links: Profile News Message Board | |
| Charts:- Daily , Weekly | |
| Add FF to Watchlist: View: Get Complete FF Trend Analysis ➞ | |
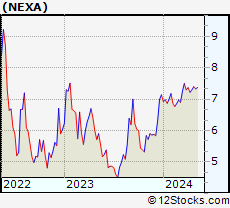 | NEXA Nexa Resources S.A. |
| Sector: Materials | |
| SubSector: Industrial Metals & Minerals | |
| MarketCap: 437.31 Millions | |
| Recent Price: 4.90 Smart Investing & Trading Score: 70 | |
| Day Percent Change: 1.03% Day Change: 0.05 | |
| Week Change: 0.41% Year-to-date Change: -43.2% | |
| NEXA Links: Profile News Message Board | |
| Charts:- Daily , Weekly | |
| Add NEXA to Watchlist: View: Get Complete NEXA Trend Analysis ➞ | |
 | AVD American Vanguard Corporation |
| Sector: Materials | |
| SubSector: Agricultural Chemicals | |
| MarketCap: 419.329 Millions | |
| Recent Price: 5.02 Smart Investing & Trading Score: 90 | |
| Day Percent Change: -3.09% Day Change: -0.16 | |
| Week Change: -7.21% Year-to-date Change: 8.4% | |
| AVD Links: Profile News Message Board | |
| Charts:- Daily , Weekly | |
| Add AVD to Watchlist: View: Get Complete AVD Trend Analysis ➞ | |
 | HWKN Hawkins, Inc. |
| Sector: Materials | |
| SubSector: Specialty Chemicals | |
| MarketCap: 398.957 Millions | |
| Recent Price: 168.09 Smart Investing & Trading Score: 40 | |
| Day Percent Change: 0.11% Day Change: 0.19 | |
| Week Change: -2.44% Year-to-date Change: 37.4% | |
| HWKN Links: Profile News Message Board | |
| Charts:- Daily , Weekly | |
| Add HWKN to Watchlist: View: Get Complete HWKN Trend Analysis ➞ | |
 | NGD New Gold Inc. |
| Sector: Materials | |
| SubSector: Gold | |
| MarketCap: 398.119 Millions | |
| Recent Price: 5.44 Smart Investing & Trading Score: 100 | |
| Day Percent Change: 3.42% Day Change: 0.18 | |
| Week Change: 6.67% Year-to-date Change: 119.4% | |
| NGD Links: Profile News Message Board | |
| Charts:- Daily , Weekly | |
| Add NGD to Watchlist: View: Get Complete NGD Trend Analysis ➞ | |
 | VHI Valhi, Inc. |
| Sector: Materials | |
| SubSector: Chemicals - Major Diversified | |
| MarketCap: 394.336 Millions | |
| Recent Price: 16.35 Smart Investing & Trading Score: 70 | |
| Day Percent Change: 1.87% Day Change: 0.3 | |
| Week Change: -3.65% Year-to-date Change: -29.4% | |
| VHI Links: Profile News Message Board | |
| Charts:- Daily , Weekly | |
| Add VHI to Watchlist: View: Get Complete VHI Trend Analysis ➞ | |
 | ASIX AdvanSix Inc. |
| Sector: Materials | |
| SubSector: Chemicals - Major Diversified | |
| MarketCap: 394.136 Millions | |
| Recent Price: 19.73 Smart Investing & Trading Score: 70 | |
| Day Percent Change: -1.35% Day Change: -0.27 | |
| Week Change: 0.2% Year-to-date Change: -29.2% | |
| ASIX Links: Profile News Message Board | |
| Charts:- Daily , Weekly | |
| Add ASIX to Watchlist: View: Get Complete ASIX Trend Analysis ➞ | |
| For tabular summary view of above stock list: Summary View ➞ 0 - 25 , 25 - 50 , 50 - 75 , 75 - 100 , 100 - 125 , 125 - 150 , 150 - 175 | ||
| Click To Change The Sort Order: By Market Cap or Company Size Performance: Year-to-date, Week and Day | |
| Select Chart Type: | ||
|
Best Stocks Today 12Stocks.com |
© 2025 12Stocks.com Terms & Conditions Privacy Contact Us
All Information Provided Only For Education And Not To Be Used For Investing or Trading. See Terms & Conditions


One More Thing ... Get Best Stocks Delivered Daily!
Never Ever Miss A Move With Our Top Ten Stocks Lists
Find Best Stocks In Any Market - Bull or Bear Market
Take A Peek At Our Top Ten Stocks Lists: Daily, Weekly, Year-to-Date & Top Trends
Find Best Stocks In Any Market - Bull or Bear Market
Take A Peek At Our Top Ten Stocks Lists: Daily, Weekly, Year-to-Date & Top Trends
Materials Stocks With Best Up Trends [0-bearish to 100-bullish]: Energy Fuels[100], i-80 Gold[100], GrowGeneration [100], Alamos Gold[100], Fortuna Silver[100], IAMGOLD [100], New Gold[100], Sandstorm Gold[100], SSR [100], BHP [100], Pan American[100]
Best Materials Stocks Year-to-Date:
MP [337.69%], Dominion Diamond[207.43%], Gold Royalty[161.16%], Sibanye Stillwater[148.79%], AngloGold Ashanti[143.42%], SSR [143.1%], Gold Fields[133.46%], New Gold[119.35%], Ramaco [117.85%], Kinross Gold[111.46%], Coeur [104.02%] Best Materials Stocks This Week:
Dominion Diamond[33.17%], DRDGOLD [12.42%], i-80 Gold[12.09%], Alamos Gold[9.37%], New Gold[6.67%], Trilogy Metals[5.77%], IAMGOLD [5.75%], FMC [5.47%], McEwen [5.39%], SSR [5.22%], Braskem S.A[5.21%] Best Materials Stocks Daily:
Dominion Diamond[28.83%], Energy Fuels[10.2%], DRDGOLD [8.49%], 5E Advanced[8.29%], Origin [7.47%], Green Plains[6.96%], Gold Royalty[6.76%], Aceto [6.67%], i-80 Gold[6.31%], GrowGeneration [5.13%], Ramaco [5.05%]