
 Login Sign Up


| |||||
 |  | ||||

| 12Stocks.com Market Intelligence |
Best Industrial Stocks
| In a hurry? Industrial Stocks Lists: Performance Trends Table, Stock Charts
Sort Industrial stocks: Daily, Weekly, Year-to-Date, Market Cap & Trends. Filter Industrial stocks list by size:All Industrial Large Mid-Range Small |
| 12Stocks.com Industrial Stocks Performances & Trends Daily | |||||||||
|
|  The overall Smart Investing & Trading Score is 50 (0-bearish to 100-bullish) which puts Industrial sector in short term neutral trend. The Smart Investing & Trading Score from previous trading session is 60 and hence a deterioration of trend.
| ||||||||
Here are the Smart Investing & Trading Scores of the most requested Industrial stocks at 12Stocks.com (click stock name for detailed review):
|


| 12Stocks.com: Investing in Industrial sector with Stocks | |
|
The following table helps investors and traders sort through current performance and trends (as measured by Smart Investing & Trading Score) of various
stocks in the Industrial sector. Quick View: Move mouse or cursor over stock symbol (ticker) to view short-term Technical chart and over stock name to view long term chart. Click on  to add stock symbol to your watchlist and to add stock symbol to your watchlist and  to view watchlist. Click on any ticker or stock name for detailed market intelligence report for that stock. to view watchlist. Click on any ticker or stock name for detailed market intelligence report for that stock. |
12Stocks.com Performance of Stocks in Industrial Sector
| Ticker | Stock Name | Watchlist | Category | Recent Price | Smart Investing & Trading Score | Change % | YTD Change% |
| LMB | Limbach |   | Building Products & Equipment | 114.56 | 20 | 1.53% | 39.93% |
| BBSI | Barrett Business | | Staffing & Employment | 48.80 | 50 | -0.22% | 6.94% |
| RDW | Redwire | | Aerospace & Defense | 8.91 | 10 | 0.00% | -47.14% |
| PRLB | Proto Labs | | Fabrication | 49.81 | 70 | 1.17% | 23.46% |
| ALGT | Allegiant Travel | | Airlines | 62.66 | 70 | -0.07% | -40.61% |
| ULCC | Frontier | | Airlines | 4.90 | 60 | -2.58% | -41.63% |
| EVEX | Eve Holding | | Aerospace & Defense | 3.93 | 46 | -3.41% | -27.21% |
| GRC | Gorman-Rupp Co | | Specialty Industrial Machinery | 42.77 | 90 | 0.00% | 9.79% |
| GSL | Global Ship | | Marine Shipping | 30.05 | 100 | 0.80% | 43.61% |
| SFL | SFL | | Marine Shipping | 8.13 | 50 | 1.86% | -14.55% |
| ASTE | Astec Industries | | Farm & Heavy Construction Machinery | 46.29 | 100 | -1.22% | 30.88% |
| MEG | Montrose Environmental | | Waste Mgmt | 31.06 | 70 | 2.04% | 50.84% |
| HSII | Heidrick & Struggles | | Staffing & Employment | 50.81 | 50 | -0.16% | 10.45% |
| WLFC | Willis Lease | | Rental & Leasing | 148.68 | 60 | 0.07% | -29.06% |
| SWIM | Latham | | Building Products & Equipment | 8.03 | 90 | 1.72% | 10.34% |
| MRTN | Marten Transport | | Trucking | 11.84 | 50 | -0.25% | -24.12% |
| PLPC | Preformed Line | | Electrical Equipment & Parts | 191.07 | 80 | 2.55% | 45.05% |
| APOG | Apogee Enterprises | | Building Products & Equipment | 43.98 | 80 | -0.30% | -39.43% |
| FWRD | Forward Air | | Integrated Freight & Logistics | 30.03 | 50 | 0.40% | -13.49% |
| AMPX | Amprius Technologies | | Electrical Equipment & Parts | 7.09 | 51 | 0.74% | 142.50% |
| DLX | Deluxe Corp | | Conglomerates | 19.66 | 80 | -0.42% | -12.76% |
| TH | Target Hospitality | | Specialty | 9.07 | 60 | -1.67% | -8.43% |
| EH | EHang | | Aerospace & Defense | 15.83 | 40 | 1.10% | 10.83% |
| THR | Thermon | | Specialty Industrial Machinery | 26.52 | 10 | 0.08% | -12.76% |
| NX | Quanex Building | | Building Products & Equipment | 21.27 | 10 | -0.62% | -13.36% |
| For chart view version of above stock list: Chart View ➞ 0 - 25 , 25 - 50 , 50 - 75 , 75 - 100 , 100 - 125 , 125 - 150 , 150 - 175 , 175 - 200 , 200 - 225 , 225 - 250 , 250 - 275 , 275 - 300 , 300 - 325 , 325 - 350 , 350 - 375 , 375 - 400 , 400 - 425 | ||
 | Click To Change The Sort Order: By Market Cap or Company Size Performance: Year-to-date, Week and Day |  |
|
Get the most comprehensive stock market coverage daily at 12Stocks.com ➞ Best Stocks Today ➞ Best Stocks Weekly ➞ Best Stocks Year-to-Date ➞ Best Stocks Trends ➞  Best Stocks Today 12Stocks.com Best Nasdaq Stocks ➞ Best S&P 500 Stocks ➞ Best Tech Stocks ➞ Best Biotech Stocks ➞ |
| Detailed Overview of Industrial Stocks |
| Industrial Technical Overview, Leaders & Laggards, Top Industrial ETF Funds & Detailed Industrial Stocks List, Charts, Trends & More |
| Industrial Sector: Technical Analysis, Trends & YTD Performance | |
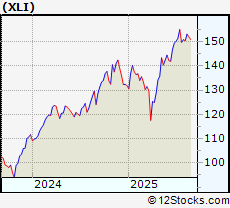
| Industrial sector is composed of stocks
from industrial machinery, aerospace, defense, farm/construction
and industrial services subsectors. Industrial sector, as represented by XLI, an exchange-traded fund [ETF] that holds basket of Industrial stocks (e.g, Caterpillar, Boeing) is up by 11.44% and is currently outperforming the overall market by 3.72% year-to-date. Below is a quick view of Technical charts and trends: |
|
 XLI Weekly Chart |
|
| Long Term Trend: Good | |
| Medium Term Trend: Good | |
 XLI Daily Chart |
|
| Short Term Trend: Good | |
| Overall Trend Score: 50 | |
| YTD Performance: 11.44% | |
| **Trend Scores & Views Are Only For Educational Purposes And Not For Investing | |
| 12Stocks.com: Top Performing Industrial Sector Stocks | ||||||||||||||||||||||||||||||||||||||||||||||||
 The top performing Industrial sector stocks year to date are
Now, more recently, over last week, the top performing Industrial sector stocks on the move are


|
||||||||||||||||||||||||||||||||||||||||||||||||
| 12Stocks.com: Investing in Industrial Sector using Exchange Traded Funds | |
|
The following table shows list of key exchange traded funds (ETF) that
help investors track Industrial Index. For detailed view, check out our ETF Funds section of our website. Quick View: Move mouse or cursor over ETF symbol (ticker) to view short-term Technical chart and over ETF name to view long term chart. Click on ticker or stock name for detailed view. Click on to add stock symbol to your watchlist and to view watchlist. |
12Stocks.com List of ETFs that track Industrial Index
| Ticker | ETF Name | Watchlist | Recent Price | Smart Investing & Trading Score | Change % | Week % | Year-to-date % |
| 12Stocks.com: Charts, Trends, Fundamental Data and Performances of Industrial Stocks | |
|
We now take in-depth look at all Industrial stocks including charts, multi-period performances and overall trends (as measured by Smart Investing & Trading Score). One can sort Industrial stocks (click link to choose) by Daily, Weekly and by Year-to-Date performances. Also, one can sort by size of the company or by market capitalization. |
| Select Your Default Chart Type: | |||||
| |||||
| Click on stock symbol or name for detailed view. Click on to add stock symbol to your watchlist and to view watchlist. Quick View: Move mouse or cursor over "Daily" to quickly view daily Technical stock chart and over "Weekly" to view weekly Technical stock chart. | |||||

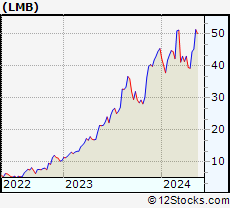 | LMB Limbach Holdings Inc |
| Sector: Industrials | |
| SubSector: Building Products & Equipment | |
| MarketCap: 1253.95 Millions | |
| Recent Price: 114.56 Smart Investing & Trading Score: 20 | |
| Day Percent Change: 1.53% Day Change: 1.8 | |
| Week Change: 3.97% Year-to-date Change: 39.9% | |
| LMB Links: Profile News Message Board | |
| Charts:- Daily , Weekly | |
| Add LMB to Watchlist: View: Get Complete LMB Trend Analysis ➞ | |
 | BBSI Barrett Business Services Inc |
| Sector: Industrials | |
| SubSector: Staffing & Employment Services | |
| MarketCap: 1236.7 Millions | |
| Recent Price: 48.80 Smart Investing & Trading Score: 50 | |
| Day Percent Change: -0.22% Day Change: -0.1 | |
| Week Change: -0.9% Year-to-date Change: 6.9% | |
| BBSI Links: Profile News Message Board | |
| Charts:- Daily , Weekly | |
| Add BBSI to Watchlist: View: Get Complete BBSI Trend Analysis ➞ | |
 | RDW Redwire Corporation |
| Sector: Industrials | |
| SubSector: Aerospace & Defense | |
| MarketCap: 1198.41 Millions | |
| Recent Price: 8.91 Smart Investing & Trading Score: 10 | |
| Day Percent Change: 0% Day Change: 0 | |
| Week Change: -4.29% Year-to-date Change: -47.1% | |
| RDW Links: Profile News Message Board | |
| Charts:- Daily , Weekly | |
| Add RDW to Watchlist: View: Get Complete RDW Trend Analysis ➞ | |
 | PRLB Proto Labs Inc |
| Sector: Industrials | |
| SubSector: Metal Fabrication | |
| MarketCap: 1192.07 Millions | |
| Recent Price: 49.81 Smart Investing & Trading Score: 70 | |
| Day Percent Change: 1.17% Day Change: 0.56 | |
| Week Change: 0.86% Year-to-date Change: 23.5% | |
| PRLB Links: Profile News Message Board | |
| Charts:- Daily , Weekly | |
| Add PRLB to Watchlist: View: Get Complete PRLB Trend Analysis ➞ | |
 | ALGT Allegiant Travel |
| Sector: Industrials | |
| SubSector: Airlines | |
| MarketCap: 1184.14 Millions | |
| Recent Price: 62.66 Smart Investing & Trading Score: 70 | |
| Day Percent Change: -0.07% Day Change: -0.04 | |
| Week Change: -6.68% Year-to-date Change: -40.6% | |
| ALGT Links: Profile News Message Board | |
| Charts:- Daily , Weekly | |
| Add ALGT to Watchlist: View: Get Complete ALGT Trend Analysis ➞ | |
 | ULCC Frontier Group Holdings Inc |
| Sector: Industrials | |
| SubSector: Airlines | |
| MarketCap: 1181.85 Millions | |
| Recent Price: 4.90 Smart Investing & Trading Score: 60 | |
| Day Percent Change: -2.58% Day Change: -0.11 | |
| Week Change: -6.32% Year-to-date Change: -41.6% | |
| ULCC Links: Profile News Message Board | |
| Charts:- Daily , Weekly | |
| Add ULCC to Watchlist: View: Get Complete ULCC Trend Analysis ➞ | |
 | EVEX Eve Holding Inc |
| Sector: Industrials | |
| SubSector: Aerospace & Defense | |
| MarketCap: 1179.46 Millions | |
| Recent Price: 3.93 Smart Investing & Trading Score: 46 | |
| Day Percent Change: -3.41% Day Change: -0.14 | |
| Week Change: -10.41% Year-to-date Change: -27.2% | |
| EVEX Links: Profile News Message Board | |
| Charts:- Daily , Weekly | |
| Add EVEX to Watchlist: View: Get Complete EVEX Trend Analysis ➞ | |
 | GRC Gorman-Rupp Co |
| Sector: Industrials | |
| SubSector: Specialty Industrial Machinery | |
| MarketCap: 1137.24 Millions | |
| Recent Price: 42.77 Smart Investing & Trading Score: 90 | |
| Day Percent Change: 0% Day Change: 0 | |
| Week Change: -2.25% Year-to-date Change: 9.8% | |
| GRC Links: Profile News Message Board | |
| Charts:- Daily , Weekly | |
| Add GRC to Watchlist: View: Get Complete GRC Trend Analysis ➞ | |
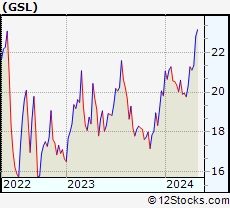 | GSL Global Ship Lease Inc |
| Sector: Industrials | |
| SubSector: Marine Shipping | |
| MarketCap: 1117.88 Millions | |
| Recent Price: 30.05 Smart Investing & Trading Score: 100 | |
| Day Percent Change: 0.8% Day Change: 0.24 | |
| Week Change: -0.66% Year-to-date Change: 43.6% | |
| GSL Links: Profile News Message Board | |
| Charts:- Daily , Weekly | |
| Add GSL to Watchlist: View: Get Complete GSL Trend Analysis ➞ | |
 | SFL SFL Corporation Ltd |
| Sector: Industrials | |
| SubSector: Marine Shipping | |
| MarketCap: 1092.43 Millions | |
| Recent Price: 8.13 Smart Investing & Trading Score: 50 | |
| Day Percent Change: 1.86% Day Change: 0.15 | |
| Week Change: -8.99% Year-to-date Change: -14.6% | |
| SFL Links: Profile News Message Board | |
| Charts:- Daily , Weekly | |
| Add SFL to Watchlist: View: Get Complete SFL Trend Analysis ➞ | |
 | ASTE Astec Industries Inc |
| Sector: Industrials | |
| SubSector: Farm & Heavy Construction Machinery | |
| MarketCap: 1081.52 Millions | |
| Recent Price: 46.29 Smart Investing & Trading Score: 100 | |
| Day Percent Change: -1.22% Day Change: -0.54 | |
| Week Change: -4.77% Year-to-date Change: 30.9% | |
| ASTE Links: Profile News Message Board | |
| Charts:- Daily , Weekly | |
| Add ASTE to Watchlist: View: Get Complete ASTE Trend Analysis ➞ | |
 | MEG Montrose Environmental Group Inc |
| Sector: Industrials | |
| SubSector: Waste Management | |
| MarketCap: 1073.06 Millions | |
| Recent Price: 31.06 Smart Investing & Trading Score: 70 | |
| Day Percent Change: 2.04% Day Change: 0.56 | |
| Week Change: -0.36% Year-to-date Change: 50.8% | |
| MEG Links: Profile News Message Board | |
| Charts:- Daily , Weekly | |
| Add MEG to Watchlist: View: Get Complete MEG Trend Analysis ➞ | |
 | HSII Heidrick & Struggles International, Inc |
| Sector: Industrials | |
| SubSector: Staffing & Employment Services | |
| MarketCap: 1044.49 Millions | |
| Recent Price: 50.81 Smart Investing & Trading Score: 50 | |
| Day Percent Change: -0.16% Day Change: -0.08 | |
| Week Change: 1.4% Year-to-date Change: 10.5% | |
| HSII Links: Profile News Message Board | |
| Charts:- Daily , Weekly | |
| Add HSII to Watchlist: View: Get Complete HSII Trend Analysis ➞ | |
 | WLFC Willis Lease Finance Corp |
| Sector: Industrials | |
| SubSector: Rental & Leasing Services | |
| MarketCap: 1014.84 Millions | |
| Recent Price: 148.68 Smart Investing & Trading Score: 60 | |
| Day Percent Change: 0.07% Day Change: 0.1 | |
| Week Change: -9.95% Year-to-date Change: -29.1% | |
| WLFC Links: Profile News Message Board | |
| Charts:- Daily , Weekly | |
| Add WLFC to Watchlist: View: Get Complete WLFC Trend Analysis ➞ | |
 | SWIM Latham Group Inc |
| Sector: Industrials | |
| SubSector: Building Products & Equipment | |
| MarketCap: 960.31 Millions | |
| Recent Price: 8.03 Smart Investing & Trading Score: 90 | |
| Day Percent Change: 1.72% Day Change: 0.13 | |
| Week Change: -2.78% Year-to-date Change: 10.3% | |
| SWIM Links: Profile News Message Board | |
| Charts:- Daily , Weekly | |
| Add SWIM to Watchlist: View: Get Complete SWIM Trend Analysis ➞ | |
 | MRTN Marten Transport, Ltd |
| Sector: Industrials | |
| SubSector: Trucking | |
| MarketCap: 957.05 Millions | |
| Recent Price: 11.84 Smart Investing & Trading Score: 50 | |
| Day Percent Change: -0.25% Day Change: -0.03 | |
| Week Change: -3.29% Year-to-date Change: -24.1% | |
| MRTN Links: Profile News Message Board | |
| Charts:- Daily , Weekly | |
| Add MRTN to Watchlist: View: Get Complete MRTN Trend Analysis ➞ | |
 | PLPC Preformed Line Products Co |
| Sector: Industrials | |
| SubSector: Electrical Equipment & Parts | |
| MarketCap: 946.21 Millions | |
| Recent Price: 191.07 Smart Investing & Trading Score: 80 | |
| Day Percent Change: 2.55% Day Change: 4.59 | |
| Week Change: 0.5% Year-to-date Change: 45.1% | |
| PLPC Links: Profile News Message Board | |
| Charts:- Daily , Weekly | |
| Add PLPC to Watchlist: View: Get Complete PLPC Trend Analysis ➞ | |
 | APOG Apogee Enterprises Inc |
| Sector: Industrials | |
| SubSector: Building Products & Equipment | |
| MarketCap: 939.12 Millions | |
| Recent Price: 43.98 Smart Investing & Trading Score: 80 | |
| Day Percent Change: -0.3% Day Change: -0.13 | |
| Week Change: -2.61% Year-to-date Change: -39.4% | |
| APOG Links: Profile News Message Board | |
| Charts:- Daily , Weekly | |
| Add APOG to Watchlist: View: Get Complete APOG Trend Analysis ➞ | |
 | FWRD Forward Air Corp |
| Sector: Industrials | |
| SubSector: Integrated Freight & Logistics | |
| MarketCap: 915.75 Millions | |
| Recent Price: 30.03 Smart Investing & Trading Score: 50 | |
| Day Percent Change: 0.4% Day Change: 0.11 | |
| Week Change: -8.49% Year-to-date Change: -13.5% | |
| FWRD Links: Profile News Message Board | |
| Charts:- Daily , Weekly | |
| Add FWRD to Watchlist: View: Get Complete FWRD Trend Analysis ➞ | |
 | AMPX Amprius Technologies Inc |
| Sector: Industrials | |
| SubSector: Electrical Equipment & Parts | |
| MarketCap: 889.29 Millions | |
| Recent Price: 7.09 Smart Investing & Trading Score: 51 | |
| Day Percent Change: 0.74% Day Change: 0.05 | |
| Week Change: -8.74% Year-to-date Change: 142.5% | |
| AMPX Links: Profile News Message Board | |
| Charts:- Daily , Weekly | |
| Add AMPX to Watchlist: View: Get Complete AMPX Trend Analysis ➞ | |
 | DLX Deluxe Corp |
| Sector: Industrials | |
| SubSector: Conglomerates | |
| MarketCap: 876.16 Millions | |
| Recent Price: 19.66 Smart Investing & Trading Score: 80 | |
| Day Percent Change: -0.42% Day Change: -0.08 | |
| Week Change: -1.55% Year-to-date Change: -12.8% | |
| DLX Links: Profile News Message Board | |
| Charts:- Daily , Weekly | |
| Add DLX to Watchlist: View: Get Complete DLX Trend Analysis ➞ | |
 | TH Target Hospitality Corp |
| Sector: Industrials | |
| SubSector: Specialty Business Services | |
| MarketCap: 876.06 Millions | |
| Recent Price: 9.07 Smart Investing & Trading Score: 60 | |
| Day Percent Change: -1.67% Day Change: -0.15 | |
| Week Change: 10.9% Year-to-date Change: -8.4% | |
| TH Links: Profile News Message Board | |
| Charts:- Daily , Weekly | |
| Add TH to Watchlist: View: Get Complete TH Trend Analysis ➞ | |
 | EH EHang Holdings Ltd ADR |
| Sector: Industrials | |
| SubSector: Aerospace & Defense | |
| MarketCap: 845.33 Millions | |
| Recent Price: 15.83 Smart Investing & Trading Score: 40 | |
| Day Percent Change: 1.1% Day Change: 0.19 | |
| Week Change: -1.41% Year-to-date Change: 10.8% | |
| EH Links: Profile News Message Board | |
| Charts:- Daily , Weekly | |
| Add EH to Watchlist: View: Get Complete EH Trend Analysis ➞ | |
 | THR Thermon Group Holdings Inc |
| Sector: Industrials | |
| SubSector: Specialty Industrial Machinery | |
| MarketCap: 845.14 Millions | |
| Recent Price: 26.52 Smart Investing & Trading Score: 10 | |
| Day Percent Change: 0.08% Day Change: 0.02 | |
| Week Change: -0.79% Year-to-date Change: -12.8% | |
| THR Links: Profile News Message Board | |
| Charts:- Daily , Weekly | |
| Add THR to Watchlist: View: Get Complete THR Trend Analysis ➞ | |
 | NX Quanex Building Products Corp |
| Sector: Industrials | |
| SubSector: Building Products & Equipment | |
| MarketCap: 835.79 Millions | |
| Recent Price: 21.27 Smart Investing & Trading Score: 10 | |
| Day Percent Change: -0.62% Day Change: -0.13 | |
| Week Change: -2.75% Year-to-date Change: -13.4% | |
| NX Links: Profile News Message Board | |
| Charts:- Daily , Weekly | |
| Add NX to Watchlist: View: Get Complete NX Trend Analysis ➞ | |
| For tabular summary view of above stock list: Summary View ➞ 0 - 25 , 25 - 50 , 50 - 75 , 75 - 100 , 100 - 125 , 125 - 150 , 150 - 175 , 175 - 200 , 200 - 225 , 225 - 250 , 250 - 275 , 275 - 300 , 300 - 325 , 325 - 350 , 350 - 375 , 375 - 400 , 400 - 425 | ||
| Click To Change The Sort Order: By Market Cap or Company Size Performance: Year-to-date, Week and Day | |
| Select Chart Type: | ||
|
Best Stocks Today 12Stocks.com |
© 2025 12Stocks.com Terms & Conditions Privacy Contact Us
All Information Provided Only For Education And Not To Be Used For Investing or Trading. See Terms & Conditions


One More Thing ... Get Best Stocks Delivered Daily!
Never Ever Miss A Move With Our Top Ten Stocks Lists
Find Best Stocks In Any Market - Bull or Bear Market
Take A Peek At Our Top Ten Stocks Lists: Daily, Weekly, Year-to-Date & Top Trends
Find Best Stocks In Any Market - Bull or Bear Market
Take A Peek At Our Top Ten Stocks Lists: Daily, Weekly, Year-to-Date & Top Trends
Industrial Stocks With Best Up Trends [0-bearish to 100-bullish]: Builders Firstsource[100], Stanley Black[100], Ardmore Shipping[100], Astronics Corp[100], Hexcel Corp[100], Grupo Aeroportuario[100], Genco Shipping[100], Costamare [100], Masco Corp[100], Tutor Perini[100], Brady Corp[100]
Best Industrial Stocks Year-to-Date:
Lightbridge Corp[200.63%], Willdan [179%], Power [176.97%], Kratos Defense[145.56%], Amprius Technologies[142.5%], Tutor Perini[135.62%], Euroseas [123.54%], Astronics Corp[123.06%], Bloom Energy[101.85%], Evolv Technologies[98.23%], American Superconductor[97.28%] Best Industrial Stocks This Week:
Twin Disc[25.39%], Euroseas [13.1%], Kimball Electronics[11.86%], Ameresco [11.37%], Target Hospitality[10.9%], Brookfield Business[9.78%], Ardmore Shipping[8.39%], Astronics Corp[8.27%], Navios Maritime[7.75%], Tetra Technologies[7.32%], DMC Global[6.43%] Best Industrial Stocks Daily:
Twin Disc[30.05%], Babcock & Wilcox Enterprises[8.11%], Novonix [7.08%], Corporacion America[6.87%], Satellogic [5.65%], Pool [4.77%], Xometry [4.58%], Equifax [4.41%], Navios Maritime[4.36%], FTAI Aviation[4.05%], Lightbridge Corp[3.95%]