
 Login Sign Up


| |||||
 |  | ||||

| 12Stocks.com Market Intelligence |
Best Industrial Stocks
| In a hurry? Industrial Stocks Lists: Performance Trends Table, Stock Charts
Sort Industrial stocks: Daily, Weekly, Year-to-Date, Market Cap & Trends. Filter Industrial stocks list by size:All Industrial Large Mid-Range Small |
| 12Stocks.com Industrial Stocks Performances & Trends Daily | |||||||||
|
|  The overall Smart Investing & Trading Score is 50 (0-bearish to 100-bullish) which puts Industrial sector in short term neutral trend. The Smart Investing & Trading Score from previous trading session is 60 and hence a deterioration of trend.
| ||||||||
Here are the Smart Investing & Trading Scores of the most requested Industrial stocks at 12Stocks.com (click stock name for detailed review):
|


| 12Stocks.com: Investing in Industrial sector with Stocks | |
|
The following table helps investors and traders sort through current performance and trends (as measured by Smart Investing & Trading Score) of various
stocks in the Industrial sector. Quick View: Move mouse or cursor over stock symbol (ticker) to view short-term Technical chart and over stock name to view long term chart. Click on  to add stock symbol to your watchlist and to add stock symbol to your watchlist and  to view watchlist. Click on any ticker or stock name for detailed market intelligence report for that stock. to view watchlist. Click on any ticker or stock name for detailed market intelligence report for that stock. |
12Stocks.com Performance of Stocks in Industrial Sector
| Ticker | Stock Name | Watchlist | Category | Recent Price | Smart Investing & Trading Score | Change % | YTD Change% |
| TEX | Terex Corp |   | Farm & Heavy Construction Machinery | 49.94 | 80 | -2.70% | 5.83% |
| VSEC | VSE Corp | | Aerospace & Defense | 162.40 | 90 | 1.99% | 71.77% |
| TNET | TriNet | | Staffing & Employment | 72.42 | 60 | -1.13% | -27.05% |
| MATX | Matson | | Marine Shipping | 104.05 | 70 | 1.24% | -22.95% |
| TPC | Tutor Perini | | Engineering & Construction | 58.94 | 100 | 1.84% | 135.62% |
| WOR | Worthington Enterprises | | Fabrication | 65.80 | 70 | -0.50% | 61.10% |
| POWL | Powell Industries | | Electrical Equipment & Parts | 266.16 | 70 | 1.79% | 13.52% |
| CBZ | Cbiz | | Specialty | 64.54 | 0 | 1.09% | -20.93% |
| UNF | Unifirst Corp | | Specialty | 177.82 | 60 | 0.44% | 2.45% |
| MGRC | McGrath Rentcorp | | Rental & Leasing | 121.49 | 100 | -0.53% | 6.69% |
| REVG | REV | | Farm & Heavy Construction Machinery | 53.21 | 100 | -0.81% | 58.95% |
| ABM | ABM Industries | | Specialty | 49.17 | 20 | -0.64% | -4.97% |
| AGX | Argan | | Engineering & Construction | 228.22 | 0 | 1.11% | 60.37% |
| GEO | Geo | | Security & Protection | 20.74 | 10 | -3.20% | -24.37% |
| FA | First Advantage | | Specialty | 16.36 | 20 | -1.15% | -12.87% |
| MYRG | MYR | | Engineering & Construction | 187.27 | 0 | 0.85% | 23.02% |
| AIR | AAR Corp | | Aerospace & Defense | 75.66 | 30 | -0.06% | 17.05% |
| RXO | RXO | | Trucking | 16.33 | 33 | 1.66% | -38.34% |
| ALG | Alamo | | Farm & Heavy Construction Machinery | 211.46 | 40 | -0.80% | 14.95% |
| XMTR | Xometry | | Specialty Industrial Machinery | 49.48 | 70 | 4.58% | 9.17% |
| SXI | Standex | | Specialty Industrial Machinery | 204.07 | 80 | 0.35% | 8.24% |
| HURN | Huron Consulting | | Consulting | 136.96 | 80 | 0.07% | 8.96% |
| BBU | Brookfield Business | | Conglomerates | 26.91 | 80 | -0.62% | 16.13% |
| PCT | PureCycle Technologies | | Pollution & Treatment Controls | 14.29 | 40 | -0.16% | 22.63% |
| TRN | Trinity Industries | | Railroads | 28.42 | 80 | -0.04% | -18.15% |
| For chart view version of above stock list: Chart View ➞ 0 - 25 , 25 - 50 , 50 - 75 , 75 - 100 , 100 - 125 , 125 - 150 , 150 - 175 , 175 - 200 , 200 - 225 , 225 - 250 , 250 - 275 , 275 - 300 , 300 - 325 , 325 - 350 , 350 - 375 , 375 - 400 , 400 - 425 | ||
 | Click To Change The Sort Order: By Market Cap or Company Size Performance: Year-to-date, Week and Day |  |
|
Get the most comprehensive stock market coverage daily at 12Stocks.com ➞ Best Stocks Today ➞ Best Stocks Weekly ➞ Best Stocks Year-to-Date ➞ Best Stocks Trends ➞  Best Stocks Today 12Stocks.com Best Nasdaq Stocks ➞ Best S&P 500 Stocks ➞ Best Tech Stocks ➞ Best Biotech Stocks ➞ |
| Detailed Overview of Industrial Stocks |
| Industrial Technical Overview, Leaders & Laggards, Top Industrial ETF Funds & Detailed Industrial Stocks List, Charts, Trends & More |
| Industrial Sector: Technical Analysis, Trends & YTD Performance | |
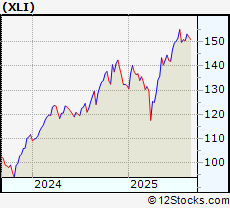
| Industrial sector is composed of stocks
from industrial machinery, aerospace, defense, farm/construction
and industrial services subsectors. Industrial sector, as represented by XLI, an exchange-traded fund [ETF] that holds basket of Industrial stocks (e.g, Caterpillar, Boeing) is up by 11.44% and is currently outperforming the overall market by 3.72% year-to-date. Below is a quick view of Technical charts and trends: |
|
 XLI Weekly Chart |
|
| Long Term Trend: Good | |
| Medium Term Trend: Good | |
 XLI Daily Chart |
|
| Short Term Trend: Good | |
| Overall Trend Score: 50 | |
| YTD Performance: 11.44% | |
| **Trend Scores & Views Are Only For Educational Purposes And Not For Investing | |
| 12Stocks.com: Top Performing Industrial Sector Stocks | ||||||||||||||||||||||||||||||||||||||||||||||||
 The top performing Industrial sector stocks year to date are
Now, more recently, over last week, the top performing Industrial sector stocks on the move are


|
||||||||||||||||||||||||||||||||||||||||||||||||
| 12Stocks.com: Investing in Industrial Sector using Exchange Traded Funds | |
|
The following table shows list of key exchange traded funds (ETF) that
help investors track Industrial Index. For detailed view, check out our ETF Funds section of our website. Quick View: Move mouse or cursor over ETF symbol (ticker) to view short-term Technical chart and over ETF name to view long term chart. Click on ticker or stock name for detailed view. Click on to add stock symbol to your watchlist and to view watchlist. |
12Stocks.com List of ETFs that track Industrial Index
| Ticker | ETF Name | Watchlist | Recent Price | Smart Investing & Trading Score | Change % | Week % | Year-to-date % |
| 12Stocks.com: Charts, Trends, Fundamental Data and Performances of Industrial Stocks | |
|
We now take in-depth look at all Industrial stocks including charts, multi-period performances and overall trends (as measured by Smart Investing & Trading Score). One can sort Industrial stocks (click link to choose) by Daily, Weekly and by Year-to-Date performances. Also, one can sort by size of the company or by market capitalization. |
| Select Your Default Chart Type: | |||||
| |||||
| Click on stock symbol or name for detailed view. Click on to add stock symbol to your watchlist and to view watchlist. Quick View: Move mouse or cursor over "Daily" to quickly view daily Technical stock chart and over "Weekly" to view weekly Technical stock chart. | |||||

 | TEX Terex Corp |
| Sector: Industrials | |
| SubSector: Farm & Heavy Construction Machinery | |
| MarketCap: 3474.83 Millions | |
| Recent Price: 49.94 Smart Investing & Trading Score: 80 | |
| Day Percent Change: -2.7% Day Change: -1.34 | |
| Week Change: -6.6% Year-to-date Change: 5.8% | |
| TEX Links: Profile News Message Board | |
| Charts:- Daily , Weekly | |
| Add TEX to Watchlist: View: Get Complete TEX Trend Analysis ➞ | |
 | VSEC VSE Corp |
| Sector: Industrials | |
| SubSector: Aerospace & Defense | |
| MarketCap: 3437.23 Millions | |
| Recent Price: 162.40 Smart Investing & Trading Score: 90 | |
| Day Percent Change: 1.99% Day Change: 3.18 | |
| Week Change: -0.54% Year-to-date Change: 71.8% | |
| VSEC Links: Profile News Message Board | |
| Charts:- Daily , Weekly | |
| Add VSEC to Watchlist: View: Get Complete VSEC Trend Analysis ➞ | |
 | TNET TriNet Group Inc |
| Sector: Industrials | |
| SubSector: Staffing & Employment Services | |
| MarketCap: 3433.37 Millions | |
| Recent Price: 72.42 Smart Investing & Trading Score: 60 | |
| Day Percent Change: -1.13% Day Change: -0.75 | |
| Week Change: -0.67% Year-to-date Change: -27.1% | |
| TNET Links: Profile News Message Board | |
| Charts:- Daily , Weekly | |
| Add TNET to Watchlist: View: Get Complete TNET Trend Analysis ➞ | |
 | MATX Matson Inc |
| Sector: Industrials | |
| SubSector: Marine Shipping | |
| MarketCap: 3355.65 Millions | |
| Recent Price: 104.05 Smart Investing & Trading Score: 70 | |
| Day Percent Change: 1.24% Day Change: 1.26 | |
| Week Change: -1.64% Year-to-date Change: -23.0% | |
| MATX Links: Profile News Message Board | |
| Charts:- Daily , Weekly | |
| Add MATX to Watchlist: View: Get Complete MATX Trend Analysis ➞ | |
 | TPC Tutor Perini Corp |
| Sector: Industrials | |
| SubSector: Engineering & Construction | |
| MarketCap: 3303.31 Millions | |
| Recent Price: 58.94 Smart Investing & Trading Score: 100 | |
| Day Percent Change: 1.84% Day Change: 1.03 | |
| Week Change: -0.4% Year-to-date Change: 135.6% | |
| TPC Links: Profile News Message Board | |
| Charts:- Daily , Weekly | |
| Add TPC to Watchlist: View: Get Complete TPC Trend Analysis ➞ | |
 | WOR Worthington Enterprises Inc |
| Sector: Industrials | |
| SubSector: Metal Fabrication | |
| MarketCap: 3240.06 Millions | |
| Recent Price: 65.80 Smart Investing & Trading Score: 70 | |
| Day Percent Change: -0.5% Day Change: -0.32 | |
| Week Change: -1.06% Year-to-date Change: 61.1% | |
| WOR Links: Profile News Message Board | |
| Charts:- Daily , Weekly | |
| Add WOR to Watchlist: View: Get Complete WOR Trend Analysis ➞ | |
 | POWL Powell Industries, Inc |
| Sector: Industrials | |
| SubSector: Electrical Equipment & Parts | |
| MarketCap: 3237.27 Millions | |
| Recent Price: 266.16 Smart Investing & Trading Score: 70 | |
| Day Percent Change: 1.79% Day Change: 4.41 | |
| Week Change: -1.79% Year-to-date Change: 13.5% | |
| POWL Links: Profile News Message Board | |
| Charts:- Daily , Weekly | |
| Add POWL to Watchlist: View: Get Complete POWL Trend Analysis ➞ | |
 | CBZ Cbiz Inc |
| Sector: Industrials | |
| SubSector: Specialty Business Services | |
| MarketCap: 3230.96 Millions | |
| Recent Price: 64.54 Smart Investing & Trading Score: 0 | |
| Day Percent Change: 1.09% Day Change: 0.7 | |
| Week Change: 3.35% Year-to-date Change: -20.9% | |
| CBZ Links: Profile News Message Board | |
| Charts:- Daily , Weekly | |
| Add CBZ to Watchlist: View: Get Complete CBZ Trend Analysis ➞ | |
 | UNF Unifirst Corp |
| Sector: Industrials | |
| SubSector: Specialty Business Services | |
| MarketCap: 3170.42 Millions | |
| Recent Price: 177.82 Smart Investing & Trading Score: 60 | |
| Day Percent Change: 0.44% Day Change: 0.77 | |
| Week Change: -0.03% Year-to-date Change: 2.5% | |
| UNF Links: Profile News Message Board | |
| Charts:- Daily , Weekly | |
| Add UNF to Watchlist: View: Get Complete UNF Trend Analysis ➞ | |
 | MGRC McGrath Rentcorp |
| Sector: Industrials | |
| SubSector: Rental & Leasing Services | |
| MarketCap: 3093.18 Millions | |
| Recent Price: 121.49 Smart Investing & Trading Score: 100 | |
| Day Percent Change: -0.53% Day Change: -0.63 | |
| Week Change: -1.46% Year-to-date Change: 6.7% | |
| MGRC Links: Profile News Message Board | |
| Charts:- Daily , Weekly | |
| Add MGRC to Watchlist: View: Get Complete MGRC Trend Analysis ➞ | |
 | REVG REV Group Inc |
| Sector: Industrials | |
| SubSector: Farm & Heavy Construction Machinery | |
| MarketCap: 3050.87 Millions | |
| Recent Price: 53.21 Smart Investing & Trading Score: 100 | |
| Day Percent Change: -0.81% Day Change: -0.41 | |
| Week Change: -4.65% Year-to-date Change: 59.0% | |
| REVG Links: Profile News Message Board | |
| Charts:- Daily , Weekly | |
| Add REVG to Watchlist: View: Get Complete REVG Trend Analysis ➞ | |
 | ABM ABM Industries Inc |
| Sector: Industrials | |
| SubSector: Specialty Business Services | |
| MarketCap: 3004.57 Millions | |
| Recent Price: 49.17 Smart Investing & Trading Score: 20 | |
| Day Percent Change: -0.64% Day Change: -0.31 | |
| Week Change: -1.1% Year-to-date Change: -5.0% | |
| ABM Links: Profile News Message Board | |
| Charts:- Daily , Weekly | |
| Add ABM to Watchlist: View: Get Complete ABM Trend Analysis ➞ | |
 | AGX Argan, Inc |
| Sector: Industrials | |
| SubSector: Engineering & Construction | |
| MarketCap: 2921.29 Millions | |
| Recent Price: 228.22 Smart Investing & Trading Score: 0 | |
| Day Percent Change: 1.11% Day Change: 2.4 | |
| Week Change: -2.78% Year-to-date Change: 60.4% | |
| AGX Links: Profile News Message Board | |
| Charts:- Daily , Weekly | |
| Add AGX to Watchlist: View: Get Complete AGX Trend Analysis ➞ | |
 | GEO Geo Group, Inc |
| Sector: Industrials | |
| SubSector: Security & Protection Services | |
| MarketCap: 2919.86 Millions | |
| Recent Price: 20.74 Smart Investing & Trading Score: 10 | |
| Day Percent Change: -3.2% Day Change: -0.7 | |
| Week Change: 1.93% Year-to-date Change: -24.4% | |
| GEO Links: Profile News Message Board | |
| Charts:- Daily , Weekly | |
| Add GEO to Watchlist: View: Get Complete GEO Trend Analysis ➞ | |
 | FA First Advantage Corp |
| Sector: Industrials | |
| SubSector: Specialty Business Services | |
| MarketCap: 2794.29 Millions | |
| Recent Price: 16.36 Smart Investing & Trading Score: 20 | |
| Day Percent Change: -1.15% Day Change: -0.19 | |
| Week Change: -2.97% Year-to-date Change: -12.9% | |
| FA Links: Profile News Message Board | |
| Charts:- Daily , Weekly | |
| Add FA to Watchlist: View: Get Complete FA Trend Analysis ➞ | |
 | MYRG MYR Group Inc |
| Sector: Industrials | |
| SubSector: Engineering & Construction | |
| MarketCap: 2792.25 Millions | |
| Recent Price: 187.27 Smart Investing & Trading Score: 0 | |
| Day Percent Change: 0.85% Day Change: 1.55 | |
| Week Change: 0.82% Year-to-date Change: 23.0% | |
| MYRG Links: Profile News Message Board | |
| Charts:- Daily , Weekly | |
| Add MYRG to Watchlist: View: Get Complete MYRG Trend Analysis ➞ | |
 | AIR AAR Corp |
| Sector: Industrials | |
| SubSector: Aerospace & Defense | |
| MarketCap: 2708.1 Millions | |
| Recent Price: 75.66 Smart Investing & Trading Score: 30 | |
| Day Percent Change: -0.06% Day Change: -0.04 | |
| Week Change: -7.03% Year-to-date Change: 17.1% | |
| AIR Links: Profile News Message Board | |
| Charts:- Daily , Weekly | |
| Add AIR to Watchlist: View: Get Complete AIR Trend Analysis ➞ | |
 | RXO RXO Inc |
| Sector: Industrials | |
| SubSector: Trucking | |
| MarketCap: 2707.43 Millions | |
| Recent Price: 16.33 Smart Investing & Trading Score: 33 | |
| Day Percent Change: 1.66% Day Change: 0.24 | |
| Week Change: -2.46% Year-to-date Change: -38.3% | |
| RXO Links: Profile News Message Board | |
| Charts:- Daily , Weekly | |
| Add RXO to Watchlist: View: Get Complete RXO Trend Analysis ➞ | |
 | ALG Alamo Group Inc |
| Sector: Industrials | |
| SubSector: Farm & Heavy Construction Machinery | |
| MarketCap: 2533.84 Millions | |
| Recent Price: 211.46 Smart Investing & Trading Score: 40 | |
| Day Percent Change: -0.8% Day Change: -1.72 | |
| Week Change: -6.06% Year-to-date Change: 15.0% | |
| ALG Links: Profile News Message Board | |
| Charts:- Daily , Weekly | |
| Add ALG to Watchlist: View: Get Complete ALG Trend Analysis ➞ | |
 | XMTR Xometry Inc |
| Sector: Industrials | |
| SubSector: Specialty Industrial Machinery | |
| MarketCap: 2524.46 Millions | |
| Recent Price: 49.48 Smart Investing & Trading Score: 70 | |
| Day Percent Change: 4.58% Day Change: 2.04 | |
| Week Change: -1.29% Year-to-date Change: 9.2% | |
| XMTR Links: Profile News Message Board | |
| Charts:- Daily , Weekly | |
| Add XMTR to Watchlist: View: Get Complete XMTR Trend Analysis ➞ | |
 | SXI Standex International Corp |
| Sector: Industrials | |
| SubSector: Specialty Industrial Machinery | |
| MarketCap: 2523.71 Millions | |
| Recent Price: 204.07 Smart Investing & Trading Score: 80 | |
| Day Percent Change: 0.35% Day Change: 0.71 | |
| Week Change: -1.31% Year-to-date Change: 8.2% | |
| SXI Links: Profile News Message Board | |
| Charts:- Daily , Weekly | |
| Add SXI to Watchlist: View: Get Complete SXI Trend Analysis ➞ | |
 | HURN Huron Consulting Group Inc |
| Sector: Industrials | |
| SubSector: Consulting Services | |
| MarketCap: 2444.94 Millions | |
| Recent Price: 136.96 Smart Investing & Trading Score: 80 | |
| Day Percent Change: 0.07% Day Change: 0.1 | |
| Week Change: 1.87% Year-to-date Change: 9.0% | |
| HURN Links: Profile News Message Board | |
| Charts:- Daily , Weekly | |
| Add HURN to Watchlist: View: Get Complete HURN Trend Analysis ➞ | |
 | BBU Brookfield Business Partners L.P |
| Sector: Industrials | |
| SubSector: Conglomerates | |
| MarketCap: 2444.54 Millions | |
| Recent Price: 26.91 Smart Investing & Trading Score: 80 | |
| Day Percent Change: -0.62% Day Change: -0.17 | |
| Week Change: 9.78% Year-to-date Change: 16.1% | |
| BBU Links: Profile News Message Board | |
| Charts:- Daily , Weekly | |
| Add BBU to Watchlist: View: Get Complete BBU Trend Analysis ➞ | |
 | PCT PureCycle Technologies Inc |
| Sector: Industrials | |
| SubSector: Pollution & Treatment Controls | |
| MarketCap: 2411.45 Millions | |
| Recent Price: 14.29 Smart Investing & Trading Score: 40 | |
| Day Percent Change: -0.16% Day Change: -0.02 | |
| Week Change: -5.84% Year-to-date Change: 22.6% | |
| PCT Links: Profile News Message Board | |
| Charts:- Daily , Weekly | |
| Add PCT to Watchlist: View: Get Complete PCT Trend Analysis ➞ | |
 | TRN Trinity Industries, Inc |
| Sector: Industrials | |
| SubSector: Railroads | |
| MarketCap: 2309.52 Millions | |
| Recent Price: 28.42 Smart Investing & Trading Score: 80 | |
| Day Percent Change: -0.04% Day Change: -0.01 | |
| Week Change: -0.54% Year-to-date Change: -18.2% | |
| TRN Links: Profile News Message Board | |
| Charts:- Daily , Weekly | |
| Add TRN to Watchlist: View: Get Complete TRN Trend Analysis ➞ | |
| For tabular summary view of above stock list: Summary View ➞ 0 - 25 , 25 - 50 , 50 - 75 , 75 - 100 , 100 - 125 , 125 - 150 , 150 - 175 , 175 - 200 , 200 - 225 , 225 - 250 , 250 - 275 , 275 - 300 , 300 - 325 , 325 - 350 , 350 - 375 , 375 - 400 , 400 - 425 | ||
| Click To Change The Sort Order: By Market Cap or Company Size Performance: Year-to-date, Week and Day | |
| Select Chart Type: | ||
|
Best Stocks Today 12Stocks.com |
© 2025 12Stocks.com Terms & Conditions Privacy Contact Us
All Information Provided Only For Education And Not To Be Used For Investing or Trading. See Terms & Conditions


One More Thing ... Get Best Stocks Delivered Daily!
Never Ever Miss A Move With Our Top Ten Stocks Lists
Find Best Stocks In Any Market - Bull or Bear Market
Take A Peek At Our Top Ten Stocks Lists: Daily, Weekly, Year-to-Date & Top Trends
Find Best Stocks In Any Market - Bull or Bear Market
Take A Peek At Our Top Ten Stocks Lists: Daily, Weekly, Year-to-Date & Top Trends
Industrial Stocks With Best Up Trends [0-bearish to 100-bullish]: Builders Firstsource[100], Stanley Black[100], Ardmore Shipping[100], Astronics Corp[100], Hexcel Corp[100], Grupo Aeroportuario[100], Genco Shipping[100], Costamare [100], Masco Corp[100], Tutor Perini[100], Brady Corp[100]
Best Industrial Stocks Year-to-Date:
Lightbridge Corp[200.63%], Willdan [179%], Power [176.97%], Kratos Defense[145.56%], Amprius Technologies[142.5%], Tutor Perini[135.62%], Euroseas [123.54%], Astronics Corp[123.06%], Bloom Energy[101.85%], Evolv Technologies[98.23%], American Superconductor[97.28%] Best Industrial Stocks This Week:
Twin Disc[25.39%], Euroseas [13.1%], Kimball Electronics[11.86%], Ameresco [11.37%], Target Hospitality[10.9%], Brookfield Business[9.78%], Ardmore Shipping[8.39%], Astronics Corp[8.27%], Navios Maritime[7.75%], Tetra Technologies[7.32%], DMC Global[6.43%] Best Industrial Stocks Daily:
Twin Disc[30.05%], Babcock & Wilcox Enterprises[8.11%], Novonix [7.08%], Corporacion America[6.87%], Satellogic [5.65%], Pool [4.77%], Xometry [4.58%], Equifax [4.41%], Navios Maritime[4.36%], FTAI Aviation[4.05%], Lightbridge Corp[3.95%]