
 Login Sign Up


| |||||
 |  | ||||

| 12Stocks.com Market Intelligence |
Best Industrial Stocks
| In a hurry? Industrial Stocks Lists: Performance Trends Table, Stock Charts
Sort Industrial stocks: Daily, Weekly, Year-to-Date, Market Cap & Trends. Filter Industrial stocks list by size:All Industrial Large Mid-Range Small |
| 12Stocks.com Industrial Stocks Performances & Trends Daily | |||||||||
|
|  The overall Smart Investing & Trading Score is 50 (0-bearish to 100-bullish) which puts Industrial sector in short term neutral trend. The Smart Investing & Trading Score from previous trading session is 60 and hence a deterioration of trend.
| ||||||||
Here are the Smart Investing & Trading Scores of the most requested Industrial stocks at 12Stocks.com (click stock name for detailed review):
|


| 12Stocks.com: Investing in Industrial sector with Stocks | |
|
The following table helps investors and traders sort through current performance and trends (as measured by Smart Investing & Trading Score) of various
stocks in the Industrial sector. Quick View: Move mouse or cursor over stock symbol (ticker) to view short-term Technical chart and over stock name to view long term chart. Click on  to add stock symbol to your watchlist and to add stock symbol to your watchlist and  to view watchlist. Click on any ticker or stock name for detailed market intelligence report for that stock. to view watchlist. Click on any ticker or stock name for detailed market intelligence report for that stock. |
12Stocks.com Performance of Stocks in Industrial Sector
| Ticker | Stock Name | Watchlist | Category | Recent Price | Smart Investing & Trading Score | Change % | YTD Change% |
| ACA | Arcosa |   | Engineering & Construction | 98.95 | 70 | -0.39% | -1.48% |
| BCO | Brink's Co | | Security & Protection | 112.04 | 100 | 0.17% | 19.51% |
| GVA | Granite Construction | | Engineering & Construction | 107.75 | 70 | 0.04% | 25.34% |
| NPO | Enpro | | Specialty Industrial Machinery | 218.77 | 70 | -1.20% | 27.91% |
| HRI | Herc | | Rental & Leasing | 130.79 | 100 | -3.53% | -36.83% |
| LSTR | Landstar System | | Integrated Freight & Logistics | 132.33 | 70 | 0.66% | -23.14% |
| OMAB | Grupo Aeroportuario | | Airports & Air | 102.21 | 40 | -0.25% | 60.61% |
| FELE | Franklin Electric | | Specialty Industrial Machinery | 97.86 | 70 | -0.05% | -0.89% |
| WSC | WillScot | | Rental & Leasing | 24.24 | 20 | -1.27% | -29.70% |
| SNDR | Schneider National | | Trucking | 24.72 | 70 | 0.62% | -15.90% |
| GMS | GMS | | Building Products & Equipment | 109.93 | 90 | 0.26% | 29.47% |
| MWA | Mueller Water | | Specialty Industrial Machinery | 26.36 | 80 | -1.14% | 16.33% |
| MRCY | Mercury Systems | | Aerospace & Defense | 67.55 | 90 | 1.70% | 56.29% |
| ENS | Enersys | | Electrical Equipment & Parts | 102.65 | 100 | 0.48% | 6.68% |
| BRC | Brady Corp | | Security & Protection | 78.08 | 100 | 1.73% | 1.27% |
| KAI | Kadant | | Specialty Industrial Machinery | 323.28 | 60 | -1.21% | -5.02% |
| KFY | Korn Ferry | | Staffing & Employment | 74.14 | 40 | -0.27% | 9.55% |
| GFF | Griffon Corp | | Building Products & Equipment | 76.16 | 90 | 0.19% | 1.93% |
| SEB | Seaboard Corp | | Conglomerates | 3969.20 | 80 | 2.03% | 48.93% |
| RHI | Robert Half | | Staffing & Employment | 36.99 | 60 | -0.96% | -41.60% |
| EXPO | Exponent | | Engineering & Construction | 71.38 | 50 | 0.64% | -20.30% |
| HAYW | Hayward | | Electrical Equipment & Parts | 16.08 | 80 | -0.19% | 3.40% |
| OTTR | Otter Tail | | Conglomerates | 83.99 | 70 | -0.10% | 14.04% |
| AZZ | AZZ | | Specialty | 112.89 | 80 | -0.90% | 37.29% |
| CAAP | Corporacion America | | Airports & Air | 21.51 | 80 | 6.87% | 19.19% |
| For chart view version of above stock list: Chart View ➞ 0 - 25 , 25 - 50 , 50 - 75 , 75 - 100 , 100 - 125 , 125 - 150 , 150 - 175 , 175 - 200 , 200 - 225 , 225 - 250 , 250 - 275 , 275 - 300 , 300 - 325 , 325 - 350 , 350 - 375 , 375 - 400 , 400 - 425 | ||
 | Click To Change The Sort Order: By Market Cap or Company Size Performance: Year-to-date, Week and Day |  |
|
Get the most comprehensive stock market coverage daily at 12Stocks.com ➞ Best Stocks Today ➞ Best Stocks Weekly ➞ Best Stocks Year-to-Date ➞ Best Stocks Trends ➞  Best Stocks Today 12Stocks.com Best Nasdaq Stocks ➞ Best S&P 500 Stocks ➞ Best Tech Stocks ➞ Best Biotech Stocks ➞ |
| Detailed Overview of Industrial Stocks |
| Industrial Technical Overview, Leaders & Laggards, Top Industrial ETF Funds & Detailed Industrial Stocks List, Charts, Trends & More |
| Industrial Sector: Technical Analysis, Trends & YTD Performance | |
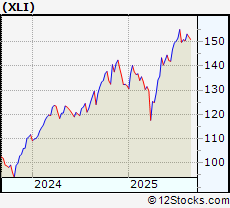
| Industrial sector is composed of stocks
from industrial machinery, aerospace, defense, farm/construction
and industrial services subsectors. Industrial sector, as represented by XLI, an exchange-traded fund [ETF] that holds basket of Industrial stocks (e.g, Caterpillar, Boeing) is up by 11.44% and is currently outperforming the overall market by 3.72% year-to-date. Below is a quick view of Technical charts and trends: |
|
 XLI Weekly Chart |
|
| Long Term Trend: Good | |
| Medium Term Trend: Good | |
 XLI Daily Chart |
|
| Short Term Trend: Good | |
| Overall Trend Score: 50 | |
| YTD Performance: 11.44% | |
| **Trend Scores & Views Are Only For Educational Purposes And Not For Investing | |
| 12Stocks.com: Top Performing Industrial Sector Stocks | ||||||||||||||||||||||||||||||||||||||||||||||||
 The top performing Industrial sector stocks year to date are
Now, more recently, over last week, the top performing Industrial sector stocks on the move are


|
||||||||||||||||||||||||||||||||||||||||||||||||
| 12Stocks.com: Investing in Industrial Sector using Exchange Traded Funds | |
|
The following table shows list of key exchange traded funds (ETF) that
help investors track Industrial Index. For detailed view, check out our ETF Funds section of our website. Quick View: Move mouse or cursor over ETF symbol (ticker) to view short-term Technical chart and over ETF name to view long term chart. Click on ticker or stock name for detailed view. Click on to add stock symbol to your watchlist and to view watchlist. |
12Stocks.com List of ETFs that track Industrial Index
| Ticker | ETF Name | Watchlist | Recent Price | Smart Investing & Trading Score | Change % | Week % | Year-to-date % |
| 12Stocks.com: Charts, Trends, Fundamental Data and Performances of Industrial Stocks | |
|
We now take in-depth look at all Industrial stocks including charts, multi-period performances and overall trends (as measured by Smart Investing & Trading Score). One can sort Industrial stocks (click link to choose) by Daily, Weekly and by Year-to-Date performances. Also, one can sort by size of the company or by market capitalization. |
| Select Your Default Chart Type: | |||||
| |||||
| Click on stock symbol or name for detailed view. Click on to add stock symbol to your watchlist and to view watchlist. Quick View: Move mouse or cursor over "Daily" to quickly view daily Technical stock chart and over "Weekly" to view weekly Technical stock chart. | |||||

 | ACA Arcosa Inc |
| Sector: Industrials | |
| SubSector: Engineering & Construction | |
| MarketCap: 4788.74 Millions | |
| Recent Price: 98.95 Smart Investing & Trading Score: 70 | |
| Day Percent Change: -0.39% Day Change: -0.37 | |
| Week Change: -2.04% Year-to-date Change: -1.5% | |
| ACA Links: Profile News Message Board | |
| Charts:- Daily , Weekly | |
| Add ACA to Watchlist: View: Get Complete ACA Trend Analysis ➞ | |
 | BCO Brink's Co |
| Sector: Industrials | |
| SubSector: Security & Protection Services | |
| MarketCap: 4780.33 Millions | |
| Recent Price: 112.04 Smart Investing & Trading Score: 100 | |
| Day Percent Change: 0.17% Day Change: 0.19 | |
| Week Change: -1.23% Year-to-date Change: 19.5% | |
| BCO Links: Profile News Message Board | |
| Charts:- Daily , Weekly | |
| Add BCO to Watchlist: View: Get Complete BCO Trend Analysis ➞ | |
 | GVA Granite Construction Inc |
| Sector: Industrials | |
| SubSector: Engineering & Construction | |
| MarketCap: 4733.28 Millions | |
| Recent Price: 107.75 Smart Investing & Trading Score: 70 | |
| Day Percent Change: 0.04% Day Change: 0.04 | |
| Week Change: -1.09% Year-to-date Change: 25.3% | |
| GVA Links: Profile News Message Board | |
| Charts:- Daily , Weekly | |
| Add GVA to Watchlist: View: Get Complete GVA Trend Analysis ➞ | |
 | NPO Enpro Inc |
| Sector: Industrials | |
| SubSector: Specialty Industrial Machinery | |
| MarketCap: 4618.93 Millions | |
| Recent Price: 218.77 Smart Investing & Trading Score: 70 | |
| Day Percent Change: -1.2% Day Change: -2.66 | |
| Week Change: -2.1% Year-to-date Change: 27.9% | |
| NPO Links: Profile News Message Board | |
| Charts:- Daily , Weekly | |
| Add NPO to Watchlist: View: Get Complete NPO Trend Analysis ➞ | |
 | HRI Herc Holdings Inc |
| Sector: Industrials | |
| SubSector: Rental & Leasing Services | |
| MarketCap: 4602.27 Millions | |
| Recent Price: 130.79 Smart Investing & Trading Score: 100 | |
| Day Percent Change: -3.53% Day Change: -4.34 | |
| Week Change: -5.81% Year-to-date Change: -36.8% | |
| HRI Links: Profile News Message Board | |
| Charts:- Daily , Weekly | |
| Add HRI to Watchlist: View: Get Complete HRI Trend Analysis ➞ | |
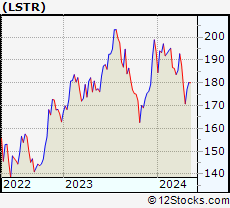 | LSTR Landstar System, Inc |
| Sector: Industrials | |
| SubSector: Integrated Freight & Logistics | |
| MarketCap: 4577.04 Millions | |
| Recent Price: 132.33 Smart Investing & Trading Score: 70 | |
| Day Percent Change: 0.66% Day Change: 0.85 | |
| Week Change: -0.91% Year-to-date Change: -23.1% | |
| LSTR Links: Profile News Message Board | |
| Charts:- Daily , Weekly | |
| Add LSTR to Watchlist: View: Get Complete LSTR Trend Analysis ➞ | |
 | OMAB Grupo Aeroportuario del Centro Norte S.A.B de C.V. ADR |
| Sector: Industrials | |
| SubSector: Airports & Air Services | |
| MarketCap: 4432.91 Millions | |
| Recent Price: 102.21 Smart Investing & Trading Score: 40 | |
| Day Percent Change: -0.25% Day Change: -0.27 | |
| Week Change: 3.6% Year-to-date Change: 60.6% | |
| OMAB Links: Profile News Message Board | |
| Charts:- Daily , Weekly | |
| Add OMAB to Watchlist: View: Get Complete OMAB Trend Analysis ➞ | |
 | FELE Franklin Electric Co., Inc |
| Sector: Industrials | |
| SubSector: Specialty Industrial Machinery | |
| MarketCap: 4341.7 Millions | |
| Recent Price: 97.86 Smart Investing & Trading Score: 70 | |
| Day Percent Change: -0.05% Day Change: -0.05 | |
| Week Change: -0.71% Year-to-date Change: -0.9% | |
| FELE Links: Profile News Message Board | |
| Charts:- Daily , Weekly | |
| Add FELE to Watchlist: View: Get Complete FELE Trend Analysis ➞ | |
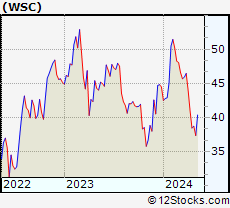 | WSC WillScot Holdings Corp |
| Sector: Industrials | |
| SubSector: Rental & Leasing Services | |
| MarketCap: 4317 Millions | |
| Recent Price: 24.24 Smart Investing & Trading Score: 20 | |
| Day Percent Change: -1.27% Day Change: -0.3 | |
| Week Change: -5.05% Year-to-date Change: -29.7% | |
| WSC Links: Profile News Message Board | |
| Charts:- Daily , Weekly | |
| Add WSC to Watchlist: View: Get Complete WSC Trend Analysis ➞ | |
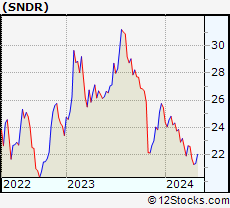 | SNDR Schneider National Inc |
| Sector: Industrials | |
| SubSector: Trucking | |
| MarketCap: 4302.71 Millions | |
| Recent Price: 24.72 Smart Investing & Trading Score: 70 | |
| Day Percent Change: 0.62% Day Change: 0.15 | |
| Week Change: -1.17% Year-to-date Change: -15.9% | |
| SNDR Links: Profile News Message Board | |
| Charts:- Daily , Weekly | |
| Add SNDR to Watchlist: View: Get Complete SNDR Trend Analysis ➞ | |
 | GMS GMS Inc |
| Sector: Industrials | |
| SubSector: Building Products & Equipment | |
| MarketCap: 4197.14 Millions | |
| Recent Price: 109.93 Smart Investing & Trading Score: 90 | |
| Day Percent Change: 0.26% Day Change: 0.29 | |
| Week Change: 0.14% Year-to-date Change: 29.5% | |
| GMS Links: Profile News Message Board | |
| Charts:- Daily , Weekly | |
| Add GMS to Watchlist: View: Get Complete GMS Trend Analysis ➞ | |
 | MWA Mueller Water Products Inc |
| Sector: Industrials | |
| SubSector: Specialty Industrial Machinery | |
| MarketCap: 4185.54 Millions | |
| Recent Price: 26.36 Smart Investing & Trading Score: 80 | |
| Day Percent Change: -1.14% Day Change: -0.3 | |
| Week Change: -2.22% Year-to-date Change: 16.3% | |
| MWA Links: Profile News Message Board | |
| Charts:- Daily , Weekly | |
| Add MWA to Watchlist: View: Get Complete MWA Trend Analysis ➞ | |
 | MRCY Mercury Systems Inc |
| Sector: Industrials | |
| SubSector: Aerospace & Defense | |
| MarketCap: 4129.99 Millions | |
| Recent Price: 67.55 Smart Investing & Trading Score: 90 | |
| Day Percent Change: 1.7% Day Change: 1.1 | |
| Week Change: -1.78% Year-to-date Change: 56.3% | |
| MRCY Links: Profile News Message Board | |
| Charts:- Daily , Weekly | |
| Add MRCY to Watchlist: View: Get Complete MRCY Trend Analysis ➞ | |
 | ENS Enersys |
| Sector: Industrials | |
| SubSector: Electrical Equipment & Parts | |
| MarketCap: 3890.94 Millions | |
| Recent Price: 102.65 Smart Investing & Trading Score: 100 | |
| Day Percent Change: 0.48% Day Change: 0.47 | |
| Week Change: -1.05% Year-to-date Change: 6.7% | |
| ENS Links: Profile News Message Board | |
| Charts:- Daily , Weekly | |
| Add ENS to Watchlist: View: Get Complete ENS Trend Analysis ➞ | |
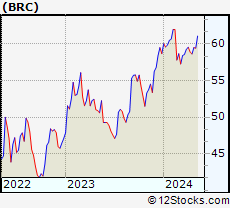 | BRC Brady Corp |
| Sector: Industrials | |
| SubSector: Security & Protection Services | |
| MarketCap: 3859.86 Millions | |
| Recent Price: 78.08 Smart Investing & Trading Score: 100 | |
| Day Percent Change: 1.73% Day Change: 1.26 | |
| Week Change: 1.84% Year-to-date Change: 1.3% | |
| BRC Links: Profile News Message Board | |
| Charts:- Daily , Weekly | |
| Add BRC to Watchlist: View: Get Complete BRC Trend Analysis ➞ | |
 | KAI Kadant, Inc |
| Sector: Industrials | |
| SubSector: Specialty Industrial Machinery | |
| MarketCap: 3850.64 Millions | |
| Recent Price: 323.28 Smart Investing & Trading Score: 60 | |
| Day Percent Change: -1.21% Day Change: -3.99 | |
| Week Change: -4.12% Year-to-date Change: -5.0% | |
| KAI Links: Profile News Message Board | |
| Charts:- Daily , Weekly | |
| Add KAI to Watchlist: View: Get Complete KAI Trend Analysis ➞ | |
 | KFY Korn Ferry |
| Sector: Industrials | |
| SubSector: Staffing & Employment Services | |
| MarketCap: 3831.95 Millions | |
| Recent Price: 74.14 Smart Investing & Trading Score: 40 | |
| Day Percent Change: -0.27% Day Change: -0.2 | |
| Week Change: -0.48% Year-to-date Change: 9.6% | |
| KFY Links: Profile News Message Board | |
| Charts:- Daily , Weekly | |
| Add KFY to Watchlist: View: Get Complete KFY Trend Analysis ➞ | |
 | GFF Griffon Corp |
| Sector: Industrials | |
| SubSector: Building Products & Equipment | |
| MarketCap: 3787.08 Millions | |
| Recent Price: 76.16 Smart Investing & Trading Score: 90 | |
| Day Percent Change: 0.19% Day Change: 0.14 | |
| Week Change: -2.35% Year-to-date Change: 1.9% | |
| GFF Links: Profile News Message Board | |
| Charts:- Daily , Weekly | |
| Add GFF to Watchlist: View: Get Complete GFF Trend Analysis ➞ | |
 | SEB Seaboard Corp |
| Sector: Industrials | |
| SubSector: Conglomerates | |
| MarketCap: 3780.7 Millions | |
| Recent Price: 3969.20 Smart Investing & Trading Score: 80 | |
| Day Percent Change: 2.03% Day Change: 71.71 | |
| Week Change: 2.85% Year-to-date Change: 48.9% | |
| SEB Links: Profile News Message Board | |
| Charts:- Daily , Weekly | |
| Add SEB to Watchlist: View: Get Complete SEB Trend Analysis ➞ | |
 | RHI Robert Half Inc |
| Sector: Industrials | |
| SubSector: Staffing & Employment Services | |
| MarketCap: 3767.38 Millions | |
| Recent Price: 36.99 Smart Investing & Trading Score: 60 | |
| Day Percent Change: -0.96% Day Change: -0.36 | |
| Week Change: -2.5% Year-to-date Change: -41.6% | |
| RHI Links: Profile News Message Board | |
| Charts:- Daily , Weekly | |
| Add RHI to Watchlist: View: Get Complete RHI Trend Analysis ➞ | |
 | EXPO Exponent Inc |
| Sector: Industrials | |
| SubSector: Engineering & Construction | |
| MarketCap: 3606.79 Millions | |
| Recent Price: 71.38 Smart Investing & Trading Score: 50 | |
| Day Percent Change: 0.64% Day Change: 0.45 | |
| Week Change: -0.27% Year-to-date Change: -20.3% | |
| EXPO Links: Profile News Message Board | |
| Charts:- Daily , Weekly | |
| Add EXPO to Watchlist: View: Get Complete EXPO Trend Analysis ➞ | |
 | HAYW Hayward Holdings Inc |
| Sector: Industrials | |
| SubSector: Electrical Equipment & Parts | |
| MarketCap: 3523.65 Millions | |
| Recent Price: 16.08 Smart Investing & Trading Score: 80 | |
| Day Percent Change: -0.19% Day Change: -0.03 | |
| Week Change: -2.41% Year-to-date Change: 3.4% | |
| HAYW Links: Profile News Message Board | |
| Charts:- Daily , Weekly | |
| Add HAYW to Watchlist: View: Get Complete HAYW Trend Analysis ➞ | |
 | OTTR Otter Tail Corporation |
| Sector: Industrials | |
| SubSector: Conglomerates | |
| MarketCap: 3515.04 Millions | |
| Recent Price: 83.99 Smart Investing & Trading Score: 70 | |
| Day Percent Change: -0.1% Day Change: -0.08 | |
| Week Change: 1.21% Year-to-date Change: 14.0% | |
| OTTR Links: Profile News Message Board | |
| Charts:- Daily , Weekly | |
| Add OTTR to Watchlist: View: Get Complete OTTR Trend Analysis ➞ | |
 | AZZ AZZ Inc |
| Sector: Industrials | |
| SubSector: Specialty Business Services | |
| MarketCap: 3509.54 Millions | |
| Recent Price: 112.89 Smart Investing & Trading Score: 80 | |
| Day Percent Change: -0.9% Day Change: -1.02 | |
| Week Change: -0.97% Year-to-date Change: 37.3% | |
| AZZ Links: Profile News Message Board | |
| Charts:- Daily , Weekly | |
| Add AZZ to Watchlist: View: Get Complete AZZ Trend Analysis ➞ | |
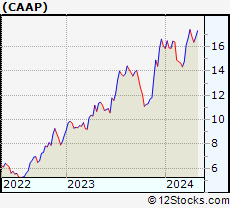 | CAAP Corporacion America Airports S.A |
| Sector: Industrials | |
| SubSector: Airports & Air Services | |
| MarketCap: 3494.95 Millions | |
| Recent Price: 21.51 Smart Investing & Trading Score: 80 | |
| Day Percent Change: 6.87% Day Change: 1.43 | |
| Week Change: 4.81% Year-to-date Change: 19.2% | |
| CAAP Links: Profile News Message Board | |
| Charts:- Daily , Weekly | |
| Add CAAP to Watchlist: View: Get Complete CAAP Trend Analysis ➞ | |
| For tabular summary view of above stock list: Summary View ➞ 0 - 25 , 25 - 50 , 50 - 75 , 75 - 100 , 100 - 125 , 125 - 150 , 150 - 175 , 175 - 200 , 200 - 225 , 225 - 250 , 250 - 275 , 275 - 300 , 300 - 325 , 325 - 350 , 350 - 375 , 375 - 400 , 400 - 425 | ||
| Click To Change The Sort Order: By Market Cap or Company Size Performance: Year-to-date, Week and Day | |
| Select Chart Type: | ||
|
Best Stocks Today 12Stocks.com |
© 2025 12Stocks.com Terms & Conditions Privacy Contact Us
All Information Provided Only For Education And Not To Be Used For Investing or Trading. See Terms & Conditions


One More Thing ... Get Best Stocks Delivered Daily!
Never Ever Miss A Move With Our Top Ten Stocks Lists
Find Best Stocks In Any Market - Bull or Bear Market
Take A Peek At Our Top Ten Stocks Lists: Daily, Weekly, Year-to-Date & Top Trends
Find Best Stocks In Any Market - Bull or Bear Market
Take A Peek At Our Top Ten Stocks Lists: Daily, Weekly, Year-to-Date & Top Trends
Industrial Stocks With Best Up Trends [0-bearish to 100-bullish]: Builders Firstsource[100], Stanley Black[100], Ardmore Shipping[100], Astronics Corp[100], Hexcel Corp[100], Grupo Aeroportuario[100], Genco Shipping[100], Costamare [100], Masco Corp[100], Tutor Perini[100], Brady Corp[100]
Best Industrial Stocks Year-to-Date:
Lightbridge Corp[200.63%], Willdan [179%], Power [176.97%], Kratos Defense[145.56%], Amprius Technologies[142.5%], Tutor Perini[135.62%], Euroseas [123.54%], Astronics Corp[123.06%], Bloom Energy[101.85%], Evolv Technologies[98.23%], American Superconductor[97.28%] Best Industrial Stocks This Week:
Twin Disc[25.39%], Euroseas [13.1%], Kimball Electronics[11.86%], Ameresco [11.37%], Target Hospitality[10.9%], Brookfield Business[9.78%], Ardmore Shipping[8.39%], Astronics Corp[8.27%], Navios Maritime[7.75%], Tetra Technologies[7.32%], DMC Global[6.43%] Best Industrial Stocks Daily:
Twin Disc[30.05%], Babcock & Wilcox Enterprises[8.11%], Novonix [7.08%], Corporacion America[6.87%], Satellogic [5.65%], Pool [4.77%], Xometry [4.58%], Equifax [4.41%], Navios Maritime[4.36%], FTAI Aviation[4.05%], Lightbridge Corp[3.95%]