
 Login Sign Up


| |||||
 |  | ||||

| 12Stocks.com Market Intelligence |
Best Healthcare Stocks
 | "Discover best trending healthcare stocks with 12Stocks.com." |
| - Subu Vdaygiri, Founder, 12Stocks.com |
| In a hurry? Healthcare Stocks Lists: Performance Trends Table, Stock Charts
Sort Healthcare stocks: Daily, Weekly, Year-to-Date, Market Cap & Trends. Filter Healthcare stocks list by size:All Healthcare Large Mid-Range Small |
| 12Stocks.com Healthcare Stocks Performances & Trends Daily | |||||||||
|
|  The overall Smart Investing & Trading Score is 70 (0-bearish to 100-bullish) which puts Healthcare sector in short term neutral to bullish trend. The Smart Investing & Trading Score from previous trading session is 90 and hence a deterioration of trend.
| ||||||||
Here are the Smart Investing & Trading Scores of the most requested Healthcare stocks at 12Stocks.com (click stock name for detailed review):
|


| 12Stocks.com: Investing in Healthcare sector with Stocks | |
|
The following table helps investors and traders sort through current performance and trends (as measured by Smart Investing & Trading Score) of various
stocks in the Healthcare sector. Quick View: Move mouse or cursor over stock symbol (ticker) to view short-term Technical chart and over stock name to view long term chart. Click on  to add stock symbol to your watchlist and to add stock symbol to your watchlist and  to view watchlist. Click on any ticker or stock name for detailed market intelligence report for that stock. to view watchlist. Click on any ticker or stock name for detailed market intelligence report for that stock. |
12Stocks.com Performance of Stocks in Healthcare Sector
| Ticker | Stock Name | Watchlist | Category | Recent Price | Smart Investing & Trading Score | Change % | YTD Change% |
| EQ | Equillium |   | Biotechnology | 1.87 | 70 | -6.03 | 143.24% |
| CRHM | CRH | | Instruments | 18.50 | 80 | -6.04 | 0.00% |
| EDAP | EDAP TMS | | Medical Distribution | 2.45 | 60 | -6.13 | 2.08% |
| IOVA | Iovance Bio | | Biotechnology | 2.27 | 20 | -6.20 | -70.86% |
| ALGS | Aligos | | Biotechnology | 10.20 | 30 | -6.25 | -74.38% |
| TNYA | Tenaya | | Biotechnology | 1.20 | 50 | -6.25 | -15.49% |
| NUVB | Nuvation Bio | | Biotechnology | 3.14 | 50 | -6.27 | 21.24% |
| MDWD | MediWound | | Biotechnology | 17.84 | 40 | -6.40 | -0.89% |
| ADPT | Adaptive Biotechnologies | | Biotechnology | 12.61 | 50 | -6.52 | 103.72% |
| PRLD | Prelude | | Biotechnology | 1.13 | 60 | -6.61 | -9.60% |
| ATRC | Atricure | | Instruments | 35.07 | 40 | -6.63 | 15.36% |
| MOLN | Molecular Partners | | Biotechnology | 3.63 | 20 | -6.68 | -25.46% |
| ETNB | 89bio | | Biotechnology | 8.07 | 0 | -6.71 | 1.13% |
| KOD | Kodiak Sciences | | Biotechnology | 9.25 | 40 | -6.75 | 7.31% |
| PFNX | Pfenex | | Biotechnology | 10.21 | 10 | -6.93 | 0.00% |
| CBMG | Cellular Biomedicine | | Biotechnology | 10.21 | 20 | -6.93 | 0.00% |
| ABSI | Absci Corp | | Biotechnology | 2.55 | 60 | -6.93 | -5.90% |
| FLDM | Fluidigm | | Laboratories | 3.71 | 40 | -7.02 | 0.00% |
| PACB | Pacific Biosciences | | Medical Devices | 1.17 | 10 | -7.14 | -35.00% |
| KURA | Kura Oncology | | Biotechnology | 8.19 | 60 | -7.20 | -5.65% |
| BNTX | BioNTech SE | | Biotechnology | 96.74 | 0 | -7.26 | -16.10% |
| MRNA | Moderna | | Biotechnology | 23.51 | 20 | -7.40 | -44.02% |
| SLN | Silence | | Biotechnology | 4.51 | 10 | -7.58 | -37.27% |
| DTIL | Precision Biosciences | | Biotechnology | 4.61 | 10 | -7.80 | -1.71% |
| OPRX | OptimizeRx Corp | | Health Information | 17.33 | 50 | -7.97 | 232.63% |
| For chart view version of above stock list: Chart View ➞ 0 - 25 , 25 - 50 , 50 - 75 , 75 - 100 , 100 - 125 , 125 - 150 , 150 - 175 , 175 - 200 , 200 - 225 , 225 - 250 , 250 - 275 , 275 - 300 , 300 - 325 , 325 - 350 , 350 - 375 , 375 - 400 , 400 - 425 , 425 - 450 , 450 - 475 , 475 - 500 , 500 - 525 , 525 - 550 , 550 - 575 , 575 - 600 , 600 - 625 , 625 - 650 , 650 - 675 , 675 - 700 , 700 - 725 , 725 - 750 , 750 - 775 , 775 - 800 , 800 - 825 , 825 - 850 , 850 - 875 , 875 - 900 , 900 - 925 , 925 - 950 , 950 - 975 , 975 - 1000 | ||
 | Click To Change The Sort Order: By Market Cap or Company Size Performance: Year-to-date, Week and Day |  |
|
Get the most comprehensive stock market coverage daily at 12Stocks.com ➞ Best Stocks Today ➞ Best Stocks Weekly ➞ Best Stocks Year-to-Date ➞ Best Stocks Trends ➞  Best Stocks Today 12Stocks.com Best Nasdaq Stocks ➞ Best S&P 500 Stocks ➞ Best Tech Stocks ➞ Best Biotech Stocks ➞ |
| Detailed Overview of Healthcare Stocks |
| Healthcare Technical Overview, Leaders & Laggards, Top Healthcare ETF Funds & Detailed Healthcare Stocks List, Charts, Trends & More |
| Healthcare Sector: Technical Analysis, Trends & YTD Performance | |
| Healthcare sector is composed of stocks
from pharmaceutical, biotech, diagnostics labs, insurance providers
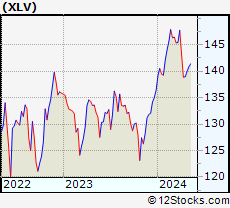
and healthcare services. Healthcare sector, as represented by XLV, an exchange-traded fund [ETF] that holds basket of Healthcare stocks (e.g, Merck, Amgen) is up by 1.23288% and is currently underperforming the overall market by -11.61812% year-to-date. Below is a quick view of Technical charts and trends: |
|
 XLV Weekly Chart |
|
| Long Term Trend: Very Good | |
| Medium Term Trend: Deteriorating | |
 XLV Daily Chart |
|
| Short Term Trend: Not Good | |
| Overall Trend Score: 70 | |
| YTD Performance: 1.23288% | |
| **Trend Scores & Views Are Only For Educational Purposes And Not For Investing | |
| 12Stocks.com: Top Performing Healthcare Sector Stocks | ||||||||||||||||||||||||||||||||||||||||||||||
 The top performing Healthcare sector stocks year to date are
Now, more recently, over last week, the top performing Healthcare sector stocks on the move are


|
||||||||||||||||||||||||||||||||||||||||||||||
| 12Stocks.com: Investing in Healthcare Sector using Exchange Traded Funds | |
|
The following table shows list of key exchange traded funds (ETF) that
help investors track Healthcare Index. For detailed view, check out our ETF Funds section of our website. Quick View: Move mouse or cursor over ETF symbol (ticker) to view short-term Technical chart and over ETF name to view long term chart. Click on ticker or stock name for detailed view. Click on to add stock symbol to your watchlist and to view watchlist. |
12Stocks.com List of ETFs that track Healthcare Index
| Ticker | ETF Name | Watchlist | Recent Price | Smart Investing & Trading Score | Change % | Week % | Year-to-date % |
| BTEC | Principal Healthcare Innovators | | 39.49 | 30 | 0 | 1.02328 | 0% |
| 12Stocks.com: Charts, Trends, Fundamental Data and Performances of Healthcare Stocks | |
|
We now take in-depth look at all Healthcare stocks including charts, multi-period performances and overall trends (as measured by Smart Investing & Trading Score). One can sort Healthcare stocks (click link to choose) by Daily, Weekly and by Year-to-Date performances. Also, one can sort by size of the company or by market capitalization. |
| Select Your Default Chart Type: | |||||
| |||||
| Click on stock symbol or name for detailed view. Click on to add stock symbol to your watchlist and to view watchlist. Quick View: Move mouse or cursor over "Daily" to quickly view daily Technical stock chart and over "Weekly" to view weekly Technical stock chart. | |||||

 | EQ Equillium Inc |
| Sector: Health Care | |
| SubSector: Biotechnology | |
| MarketCap: 113.65 Millions | |
| Recent Price: 1.87 Smart Investing & Trading Score: 70 | |
| Day Percent Change: -6.03015% Day Change: 0.42 | |
| Week Change: 6.85714% Year-to-date Change: 143.2% | |
| EQ Links: Profile News Message Board | |
| Charts:- Daily , Weekly | |
| Add EQ to Watchlist: View: Get Complete EQ Trend Analysis ➞ | |
 | CRHM CRH Medical Corporation |
| Sector: Health Care | |
| SubSector: Medical Instruments & Supplies | |
| MarketCap: 80.286 Millions | |
| Recent Price: 18.50 Smart Investing & Trading Score: 80 | |
| Day Percent Change: -6.04368% Day Change: -9999 | |
| Week Change: 363.659% Year-to-date Change: 0.0% | |
| CRHM Links: Profile News Message Board | |
| Charts:- Daily , Weekly | |
| Add CRHM to Watchlist: View: Get Complete CRHM Trend Analysis ➞ | |
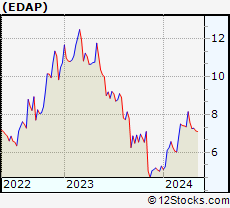 | EDAP EDAP TMS S.A. ADR |
| Sector: Health Care | |
| SubSector: Medical Distribution | |
| MarketCap: 94.22 Millions | |
| Recent Price: 2.45 Smart Investing & Trading Score: 60 | |
| Day Percent Change: -6.13027% Day Change: -0.03 | |
| Week Change: -10.9091% Year-to-date Change: 2.1% | |
| EDAP Links: Profile News Message Board | |
| Charts:- Daily , Weekly | |
| Add EDAP to Watchlist: View: Get Complete EDAP Trend Analysis ➞ | |
 | IOVA Iovance Biotherapeutics Inc |
| Sector: Health Care | |
| SubSector: Biotechnology | |
| MarketCap: 901.02 Millions | |
| Recent Price: 2.27 Smart Investing & Trading Score: 20 | |
| Day Percent Change: -6.19835% Day Change: 0.01 | |
| Week Change: 3.18182% Year-to-date Change: -70.9% | |
| IOVA Links: Profile News Message Board | |
| Charts:- Daily , Weekly | |
| Add IOVA to Watchlist: View: Get Complete IOVA Trend Analysis ➞ | |
 | ALGS Aligos Therapeutics Inc |
| Sector: Health Care | |
| SubSector: Biotechnology | |
| MarketCap: 69.76 Millions | |
| Recent Price: 10.20 Smart Investing & Trading Score: 30 | |
| Day Percent Change: -6.25% Day Change: 0.99 | |
| Week Change: -5.02793% Year-to-date Change: -74.4% | |
| ALGS Links: Profile News Message Board | |
| Charts:- Daily , Weekly | |
| Add ALGS to Watchlist: View: Get Complete ALGS Trend Analysis ➞ | |
 | TNYA Tenaya Therapeutics Inc |
| Sector: Health Care | |
| SubSector: Biotechnology | |
| MarketCap: 220.02 Millions | |
| Recent Price: 1.20 Smart Investing & Trading Score: 50 | |
| Day Percent Change: -6.25% Day Change: -0.08 | |
| Week Change: -3.22581% Year-to-date Change: -15.5% | |
| TNYA Links: Profile News Message Board | |
| Charts:- Daily , Weekly | |
| Add TNYA to Watchlist: View: Get Complete TNYA Trend Analysis ➞ | |
 | NUVB Nuvation Bio Inc |
| Sector: Health Care | |
| SubSector: Biotechnology | |
| MarketCap: 1338.76 Millions | |
| Recent Price: 3.14 Smart Investing & Trading Score: 50 | |
| Day Percent Change: -6.26866% Day Change: 0.03 | |
| Week Change: -8.18713% Year-to-date Change: 21.2% | |
| NUVB Links: Profile News Message Board | |
| Charts:- Daily , Weekly | |
| Add NUVB to Watchlist: View: Get Complete NUVB Trend Analysis ➞ | |
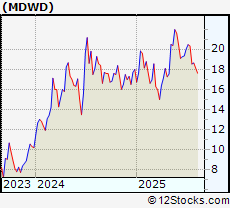 | MDWD MediWound Ltd |
| Sector: Health Care | |
| SubSector: Biotechnology | |
| MarketCap: 176.06 Millions | |
| Recent Price: 17.84 Smart Investing & Trading Score: 40 | |
| Day Percent Change: -6.40084% Day Change: -0.05 | |
| Week Change: 6.44391% Year-to-date Change: -0.9% | |
| MDWD Links: Profile News Message Board | |
| Charts:- Daily , Weekly | |
| Add MDWD to Watchlist: View: Get Complete MDWD Trend Analysis ➞ | |
 | ADPT Adaptive Biotechnologies Corp |
| Sector: Health Care | |
| SubSector: Biotechnology | |
| MarketCap: 1956.72 Millions | |
| Recent Price: 12.61 Smart Investing & Trading Score: 50 | |
| Day Percent Change: -6.52335% Day Change: 0.34 | |
| Week Change: -3.149% Year-to-date Change: 103.7% | |
| ADPT Links: Profile News Message Board | |
| Charts:- Daily , Weekly | |
| Add ADPT to Watchlist: View: Get Complete ADPT Trend Analysis ➞ | |
 | PRLD Prelude Therapeutics Inc |
| Sector: Health Care | |
| SubSector: Biotechnology | |
| MarketCap: 69.61 Millions | |
| Recent Price: 1.13 Smart Investing & Trading Score: 60 | |
| Day Percent Change: -6.61157% Day Change: 0.05 | |
| Week Change: -0.877193% Year-to-date Change: -9.6% | |
| PRLD Links: Profile News Message Board | |
| Charts:- Daily , Weekly | |
| Add PRLD to Watchlist: View: Get Complete PRLD Trend Analysis ➞ | |
 | ATRC Atricure Inc |
| Sector: Health Care | |
| SubSector: Medical Instruments & Supplies | |
| MarketCap: 1758.44 Millions | |
| Recent Price: 35.07 Smart Investing & Trading Score: 40 | |
| Day Percent Change: -6.62939% Day Change: -0.34 | |
| Week Change: -1.65451% Year-to-date Change: 15.4% | |
| ATRC Links: Profile News Message Board | |
| Charts:- Daily , Weekly | |
| Add ATRC to Watchlist: View: Get Complete ATRC Trend Analysis ➞ | |
 | MOLN Molecular Partners AG ADR |
| Sector: Health Care | |
| SubSector: Biotechnology | |
| MarketCap: 133.86 Millions | |
| Recent Price: 3.63 Smart Investing & Trading Score: 20 | |
| Day Percent Change: -6.6838% Day Change: 0.01 | |
| Week Change: 4.61095% Year-to-date Change: -25.5% | |
| MOLN Links: Profile News Message Board | |
| Charts:- Daily , Weekly | |
| Add MOLN to Watchlist: View: Get Complete MOLN Trend Analysis ➞ | |
 | ETNB 89bio Inc |
| Sector: Health Care | |
| SubSector: Biotechnology | |
| MarketCap: 1315.49 Millions | |
| Recent Price: 8.07 Smart Investing & Trading Score: 0 | |
| Day Percent Change: -6.7052% Day Change: 0.09 | |
| Week Change: -6.27178% Year-to-date Change: 1.1% | |
| ETNB Links: Profile News Message Board | |
| Charts:- Daily , Weekly | |
| Add ETNB to Watchlist: View: Get Complete ETNB Trend Analysis ➞ | |
 | KOD Kodiak Sciences Inc |
| Sector: Health Care | |
| SubSector: Biotechnology | |
| MarketCap: 555.68 Millions | |
| Recent Price: 9.25 Smart Investing & Trading Score: 40 | |
| Day Percent Change: -6.75403% Day Change: 0.21 | |
| Week Change: 8.18713% Year-to-date Change: 7.3% | |
| KOD Links: Profile News Message Board | |
| Charts:- Daily , Weekly | |
| Add KOD to Watchlist: View: Get Complete KOD Trend Analysis ➞ | |
 | PFNX Pfenex Inc. |
| Sector: Health Care | |
| SubSector: Biotechnology | |
| MarketCap: 260.685 Millions | |
| Recent Price: 10.21 Smart Investing & Trading Score: 10 | |
| Day Percent Change: -6.92799% Day Change: -9999 | |
| Week Change: -85.8017% Year-to-date Change: 0.0% | |
| PFNX Links: Profile News Message Board | |
| Charts:- Daily , Weekly | |
| Add PFNX to Watchlist: View: Get Complete PFNX Trend Analysis ➞ | |
 | CBMG Cellular Biomedicine Group, Inc. |
| Sector: Health Care | |
| SubSector: Biotechnology | |
| MarketCap: 329.885 Millions | |
| Recent Price: 10.21 Smart Investing & Trading Score: 20 | |
| Day Percent Change: -6.92799% Day Change: -9999 | |
| Week Change: -25.5831% Year-to-date Change: 0.0% | |
| CBMG Links: Profile News Message Board | |
| Charts:- Daily , Weekly | |
| Add CBMG to Watchlist: View: Get Complete CBMG Trend Analysis ➞ | |
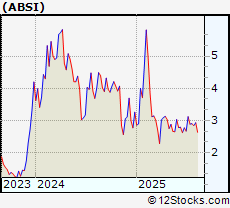 | ABSI Absci Corp |
| Sector: Health Care | |
| SubSector: Biotechnology | |
| MarketCap: 367.83 Millions | |
| Recent Price: 2.55 Smart Investing & Trading Score: 60 | |
| Day Percent Change: -6.93431% Day Change: -0.01 | |
| Week Change: 6.25% Year-to-date Change: -5.9% | |
| ABSI Links: Profile News Message Board | |
| Charts:- Daily , Weekly | |
| Add ABSI to Watchlist: View: Get Complete ABSI Trend Analysis ➞ | |
 | FLDM Fluidigm Corporation |
| Sector: Health Care | |
| SubSector: Medical Laboratories & Research | |
| MarketCap: 93.73 Millions | |
| Recent Price: 3.71 Smart Investing & Trading Score: 40 | |
| Day Percent Change: -7.01754% Day Change: -9999 | |
| Week Change: 3.63128% Year-to-date Change: 0.0% | |
| FLDM Links: Profile News Message Board | |
| Charts:- Daily , Weekly | |
| Add FLDM to Watchlist: View: Get Complete FLDM Trend Analysis ➞ | |
 | PACB Pacific Biosciences of California Inc |
| Sector: Health Care | |
| SubSector: Medical Devices | |
| MarketCap: 381.47 Millions | |
| Recent Price: 1.17 Smart Investing & Trading Score: 10 | |
| Day Percent Change: -7.14286% Day Change: -0.01 | |
| Week Change: -5.64516% Year-to-date Change: -35.0% | |
| PACB Links: Profile News Message Board | |
| Charts:- Daily , Weekly | |
| Add PACB to Watchlist: View: Get Complete PACB Trend Analysis ➞ | |
 | KURA Kura Oncology Inc |
| Sector: Health Care | |
| SubSector: Biotechnology | |
| MarketCap: 713.47 Millions | |
| Recent Price: 8.19 Smart Investing & Trading Score: 60 | |
| Day Percent Change: -7.19547% Day Change: 0.39 | |
| Week Change: 0.738007% Year-to-date Change: -5.6% | |
| KURA Links: Profile News Message Board | |
| Charts:- Daily , Weekly | |
| Add KURA to Watchlist: View: Get Complete KURA Trend Analysis ➞ | |
 | BNTX BioNTech SE ADR |
| Sector: Health Care | |
| SubSector: Biotechnology | |
| MarketCap: 27035.4 Millions | |
| Recent Price: 96.74 Smart Investing & Trading Score: 0 | |
| Day Percent Change: -7.25721% Day Change: -0.53 | |
| Week Change: -6.5314% Year-to-date Change: -16.1% | |
| BNTX Links: Profile News Message Board | |
| Charts:- Daily , Weekly | |
| Add BNTX to Watchlist: View: Get Complete BNTX Trend Analysis ➞ | |
 | MRNA Moderna Inc |
| Sector: Health Care | |
| SubSector: Biotechnology | |
| MarketCap: 9781.46 Millions | |
| Recent Price: 23.51 Smart Investing & Trading Score: 20 | |
| Day Percent Change: -7.40449% Day Change: -1.72 | |
| Week Change: -3.17133% Year-to-date Change: -44.0% | |
| MRNA Links: Profile News Message Board | |
| Charts:- Daily , Weekly | |
| Add MRNA to Watchlist: View: Get Complete MRNA Trend Analysis ➞ | |
 | SLN Silence Therapeutics Plc ADR |
| Sector: Health Care | |
| SubSector: Biotechnology | |
| MarketCap: 268.74 Millions | |
| Recent Price: 4.51 Smart Investing & Trading Score: 10 | |
| Day Percent Change: -7.58197% Day Change: 0.13 | |
| Week Change: -13.7667% Year-to-date Change: -37.3% | |
| SLN Links: Profile News Message Board | |
| Charts:- Daily , Weekly | |
| Add SLN to Watchlist: View: Get Complete SLN Trend Analysis ➞ | |
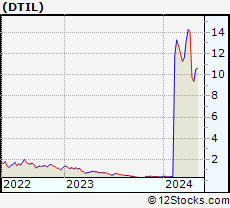 | DTIL Precision Biosciences Inc |
| Sector: Health Care | |
| SubSector: Biotechnology | |
| MarketCap: 59.76 Millions | |
| Recent Price: 4.61 Smart Investing & Trading Score: 10 | |
| Day Percent Change: -7.8% Day Change: 0.08 | |
| Week Change: -8.71287% Year-to-date Change: -1.7% | |
| DTIL Links: Profile News Message Board | |
| Charts:- Daily , Weekly | |
| Add DTIL to Watchlist: View: Get Complete DTIL Trend Analysis ➞ | |
 | OPRX OptimizeRx Corp |
| Sector: Health Care | |
| SubSector: Health Information Services | |
| MarketCap: 349.39 Millions | |
| Recent Price: 17.33 Smart Investing & Trading Score: 50 | |
| Day Percent Change: -7.96601% Day Change: 0.65 | |
| Week Change: -6.87802% Year-to-date Change: 232.6% | |
| OPRX Links: Profile News Message Board | |
| Charts:- Daily , Weekly | |
| Add OPRX to Watchlist: View: Get Complete OPRX Trend Analysis ➞ | |
| For tabular summary view of above stock list: Summary View ➞ 0 - 25 , 25 - 50 , 50 - 75 , 75 - 100 , 100 - 125 , 125 - 150 , 150 - 175 , 175 - 200 , 200 - 225 , 225 - 250 , 250 - 275 , 275 - 300 , 300 - 325 , 325 - 350 , 350 - 375 , 375 - 400 , 400 - 425 , 425 - 450 , 450 - 475 , 475 - 500 , 500 - 525 , 525 - 550 , 550 - 575 , 575 - 600 , 600 - 625 , 625 - 650 , 650 - 675 , 675 - 700 , 700 - 725 , 725 - 750 , 750 - 775 , 775 - 800 , 800 - 825 , 825 - 850 , 850 - 875 , 875 - 900 , 900 - 925 , 925 - 950 , 950 - 975 , 975 - 1000 | ||
| Click To Change The Sort Order: By Market Cap or Company Size Performance: Year-to-date, Week and Day | |
| Select Chart Type: | ||
|
Best Stocks Today 12Stocks.com |
© 2025 12Stocks.com Terms & Conditions Privacy Contact Us
All Information Provided Only For Education And Not To Be Used For Investing or Trading. See Terms & Conditions


One More Thing ... Get Best Stocks Delivered Daily!
Never Ever Miss A Move With Our Top Ten Stocks Lists
Find Best Stocks In Any Market - Bull or Bear Market
Take A Peek At Our Top Ten Stocks Lists: Daily, Weekly, Year-to-Date & Top Trends
Find Best Stocks In Any Market - Bull or Bear Market
Take A Peek At Our Top Ten Stocks Lists: Daily, Weekly, Year-to-Date & Top Trends
Healthcare Stocks With Best Up Trends [0-bearish to 100-bullish]: AlloVir [100], Cara [100], Spruce Biosciences[100], Kala Bio[100], Protalix Bio[100], Microbot [100], Kindred [100], Lineage Cell[100], Scilex Holding[100], Immuneering Corp[100], RAPT [100]
Best Healthcare Stocks Year-to-Date:
Regencell Bioscience[11493.1%], Kaleido BioSciences[9900%], Eagle [664.286%], So-Young [375.53%], Galectin [358.974%], I-Mab ADR[351.435%], Celcuity [318.203%], Immuneering Corp[284.163%], Biosig Technologies[270%], Gossamer Bio[256.701%], Microbot [255.263%] Best Healthcare Stocks This Week:
Athersys [193287%], Nobilis Health[101349%], VBI Vaccines[86898.5%], ContraFect [47677.8%], Clovis Oncology[39610.5%], Endo [28369.6%], NanoString Technologies[17224.7%], Neptune Wellness[14100%], ViewRay [11470.2%], Mallkrodt [11382.1%], Achillion [10033.3%] Best Healthcare Stocks Daily:
Kaleido BioSciences[9900%], Neoleukin [332.665%], Syros [226.23%], Athenex [103.333%], Accelerate Diagnostics[17.6471%], Aptose Biosciences[17.5439%], AlloVir [16.9215%], China SXT[15.1163%], Cara [14.3396%], Tyra Biosciences[14.26%], Prenetics Global[13.7133%]