
 Login Sign Up


| |||||
 |  | ||||

| 12Stocks.com Market Intelligence |
Best Healthcare Stocks
 | "Discover best trending healthcare stocks with 12Stocks.com." |
| - Subu Vdaygiri, Founder, 12Stocks.com |
| In a hurry? Healthcare Stocks Lists: Performance Trends Table, Stock Charts
Sort Healthcare stocks: Daily, Weekly, Year-to-Date, Market Cap & Trends. Filter Healthcare stocks list by size:All Healthcare Large Mid-Range Small |
| 12Stocks.com Healthcare Stocks Performances & Trends Daily | |||||||||
|
|  The overall Smart Investing & Trading Score is 100 (0-bearish to 100-bullish) which puts Healthcare sector in short term bullish trend. The Smart Investing & Trading Score from previous trading session is 70 and an improvement of trend continues.
| ||||||||
Here are the Smart Investing & Trading Scores of the most requested Healthcare stocks at 12Stocks.com (click stock name for detailed review):
|


| 12Stocks.com: Investing in Healthcare sector with Stocks | |
|
The following table helps investors and traders sort through current performance and trends (as measured by Smart Investing & Trading Score) of various
stocks in the Healthcare sector. Quick View: Move mouse or cursor over stock symbol (ticker) to view short-term Technical chart and over stock name to view long term chart. Click on  to add stock symbol to your watchlist and to add stock symbol to your watchlist and  to view watchlist. Click on any ticker or stock name for detailed market intelligence report for that stock. to view watchlist. Click on any ticker or stock name for detailed market intelligence report for that stock. |
12Stocks.com Performance of Stocks in Healthcare Sector
| Ticker | Stock Name | Watchlist | Category | Recent Price | Smart Investing & Trading Score | Change % | YTD Change% |
| PKI | PerkinElmer |   | Laboratories | 115.24 | 10 | 0.00% | 0.00% |
| PPHM | Peregrine | | Biotechnology | 4.22 | 10 | 0.00% | 0.00% |
| EAR | Eargo | | Medical Devices | 2.57 | 10 | 0.00% | 0.00% |
| PBMD | Prima Biomed | | Biotechnology | 1.71 | 10 | 0.00% | 0.00% |
| VSAR | Versartis | | Pharmaceutical | 1.19 | 10 | 0.00% | 0.00% |
| ANTM | Anthem | | Insurance | 482.58 | 10 | 0.00% | 0.00% |
| HYH | Halyard Health | | Instruments | 57.25 | 10 | 0.00% | 0.00% |
| BLPH | Bellerophon | | Biotechnology | 0.10 | 10 | 0.00% | 0.00% |
| AKAO | Achaogen | | Biotechnology | 2.21 | 10 | 0.00% | 0.00% |
| APTX | Aptinyx | | Biotechnology | 0.15 | 10 | 0.00% | 0.00% |
| RUBY | Rubius | | Biotechnology | 0.17 | 10 | 0.00% | 0.00% |
| ODT | Odonate | | Biotechnology | 12900.00 | 10 | 0.00% | 0.00% |
| CWBR | CohBar | | Biotechnology | 0.41 | 10 | 0.00% | 0.00% |
| MGTA | Magenta | | Biotechnology | 0.70 | 10 | 0.00% | 0.00% |
| GRTS | Gritstone Oncology | | Biotechnology | 0.02 | 10 | 0.00% | 0.00% |
| VAPO | Vapotherm | | Equipment | 1.27 | 10 | 0.00% | 0.00% |
| MLND | Millendo | | Biotechnology | 1.06 | 10 | 0.00% | 0.00% |
| APEN | Apollo Endosurgery | | Equipment | 10.00 | 10 | 0.00% | 0.00% |
| SESN | Sesen Bio | | Biotechnology | 3.67 | 10 | 0.00% | 0.00% |
| TFFP | TFF | | Biotechnology | 0.07 | 10 | 0.00% | 0.00% |
| ZEAL | Zealand Pharma | | Biotechnology | 17.59 | 10 | 0.00% | 0.00% |
| KITE | Kite Pharma | | Biotechnology | 22.46 | 10 | -0.09% | 0.00% |
| CBPO | China Biologic | | Biotechnology | 8.47 | 10 | -0.24% | 0.00% |
| ESRX | Express Scripts | | Insurance | 16.50 | 10 | -0.24% | 0.00% |
| OABI | OmniAb | | Biotechnology | 1.60 | 10 | -0.31% | -54.14% |
| For chart view version of above stock list: Chart View ➞ 0 - 25 , 25 - 50 , 50 - 75 , 75 - 100 , 100 - 125 , 125 - 150 , 150 - 175 , 175 - 200 , 200 - 225 , 225 - 250 , 250 - 275 , 275 - 300 , 300 - 325 , 325 - 350 , 350 - 375 , 375 - 400 , 400 - 425 , 425 - 450 , 450 - 475 , 475 - 500 , 500 - 525 , 525 - 550 , 550 - 575 , 575 - 600 , 600 - 625 , 625 - 650 , 650 - 675 , 675 - 700 , 700 - 725 , 725 - 750 , 750 - 775 , 775 - 800 , 800 - 825 , 825 - 850 , 850 - 875 , 875 - 900 , 900 - 925 , 925 - 950 , 950 - 975 , 975 - 1000 | ||
 | Click To Change The Sort Order: By Market Cap or Company Size Performance: Year-to-date, Week and Day |  |
|
Get the most comprehensive stock market coverage daily at 12Stocks.com ➞ Best Stocks Today ➞ Best Stocks Weekly ➞ Best Stocks Year-to-Date ➞ Best Stocks Trends ➞  Best Stocks Today 12Stocks.com Best Nasdaq Stocks ➞ Best S&P 500 Stocks ➞ Best Tech Stocks ➞ Best Biotech Stocks ➞ |
| Detailed Overview of Healthcare Stocks |
| Healthcare Technical Overview, Leaders & Laggards, Top Healthcare ETF Funds & Detailed Healthcare Stocks List, Charts, Trends & More |
| Healthcare Sector: Technical Analysis, Trends & YTD Performance | |
| Healthcare sector is composed of stocks
from pharmaceutical, biotech, diagnostics labs, insurance providers
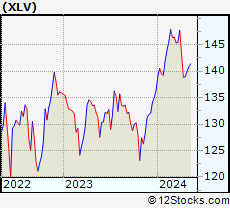
and healthcare services. Healthcare sector, as represented by XLV, an exchange-traded fund [ETF] that holds basket of Healthcare stocks (e.g, Merck, Amgen) is up by 4.95646% and is currently underperforming the overall market by -9.80144% year-to-date. Below is a quick view of Technical charts and trends: |
|
 XLV Weekly Chart |
|
| Long Term Trend: Very Good | |
| Medium Term Trend: Very Good | |
 XLV Daily Chart |
|
| Short Term Trend: Very Good | |
| Overall Trend Score: 100 | |
| YTD Performance: 4.95646% | |
| **Trend Scores & Views Are Only For Educational Purposes And Not For Investing | |
| 12Stocks.com: Top Performing Healthcare Sector Stocks | ||||||||||||||||||||||||||||||||||||||||||||||
 The top performing Healthcare sector stocks year to date are
Now, more recently, over last week, the top performing Healthcare sector stocks on the move are


|
||||||||||||||||||||||||||||||||||||||||||||||
| 12Stocks.com: Investing in Healthcare Sector using Exchange Traded Funds | |
|
The following table shows list of key exchange traded funds (ETF) that
help investors track Healthcare Index. For detailed view, check out our ETF Funds section of our website. Quick View: Move mouse or cursor over ETF symbol (ticker) to view short-term Technical chart and over ETF name to view long term chart. Click on ticker or stock name for detailed view. Click on to add stock symbol to your watchlist and to view watchlist. |
12Stocks.com List of ETFs that track Healthcare Index
| Ticker | ETF Name | Watchlist | Recent Price | Smart Investing & Trading Score | Change % | Week % | Year-to-date % |
| BTEC | Principal Healthcare Innovators | | 39.49 | 30 | 0 | 1.02328 | 0% |
| 12Stocks.com: Charts, Trends, Fundamental Data and Performances of Healthcare Stocks | |
|
We now take in-depth look at all Healthcare stocks including charts, multi-period performances and overall trends (as measured by Smart Investing & Trading Score). One can sort Healthcare stocks (click link to choose) by Daily, Weekly and by Year-to-Date performances. Also, one can sort by size of the company or by market capitalization. |
| Select Your Default Chart Type: | |||||
| |||||
| Click on stock symbol or name for detailed view. Click on to add stock symbol to your watchlist and to view watchlist. Quick View: Move mouse or cursor over "Daily" to quickly view daily Technical stock chart and over "Weekly" to view weekly Technical stock chart. | |||||

 | PKI PerkinElmer, Inc. |
| Sector: Health Care | |
| SubSector: Medical Laboratories & Research | |
| MarketCap: 8157 Millions | |
| Recent Price: 115.24 Smart Investing & Trading Score: 10 | |
| Day Percent Change: 0% Day Change: -9999 | |
| Week Change: 0% Year-to-date Change: 0.0% | |
| PKI Links: Profile News Message Board | |
| Charts:- Daily , Weekly | |
| Add PKI to Watchlist: View: Get Complete PKI Trend Analysis ➞ | |
 | PPHM Peregrine Pharmaceuticals, Inc. |
| Sector: Health Care | |
| SubSector: Biotechnology | |
| MarketCap: 168.51 Millions | |
| Recent Price: 4.22 Smart Investing & Trading Score: 10 | |
| Day Percent Change: 0% Day Change: -9999 | |
| Week Change: 0% Year-to-date Change: 0.0% | |
| PPHM Links: Profile News Message Board | |
| Charts:- Daily , Weekly | |
| Add PPHM to Watchlist: View: Get Complete PPHM Trend Analysis ➞ | |
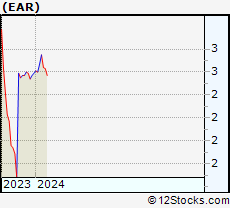 | EAR Eargo, Inc. |
| Sector: Health Care | |
| SubSector: Medical Devices | |
| MarketCap: 18387 Millions | |
| Recent Price: 2.57 Smart Investing & Trading Score: 10 | |
| Day Percent Change: 0% Day Change: -9999 | |
| Week Change: -2.28137% Year-to-date Change: 0.0% | |
| EAR Links: Profile News Message Board | |
| Charts:- Daily , Weekly | |
| Add EAR to Watchlist: View: Get Complete EAR Trend Analysis ➞ | |
 | PBMD Prima Biomed Ltd. |
| Sector: Health Care | |
| SubSector: Biotechnology | |
| MarketCap: 160.51 Millions | |
| Recent Price: 1.71 Smart Investing & Trading Score: 10 | |
| Day Percent Change: 0% Day Change: -9999 | |
| Week Change: 0% Year-to-date Change: 0.0% | |
| PBMD Links: Profile News Message Board | |
| Charts:- Daily , Weekly | |
| Add PBMD to Watchlist: View: Get Complete PBMD Trend Analysis ➞ | |
 | VSAR Versartis, Inc. |
| Sector: Health Care | |
| SubSector: Drugs - Generic | |
| MarketCap: 667.85 Millions | |
| Recent Price: 1.19 Smart Investing & Trading Score: 10 | |
| Day Percent Change: 0% Day Change: -9999 | |
| Week Change: 0% Year-to-date Change: 0.0% | |
| VSAR Links: Profile News Message Board | |
| Charts:- Daily , Weekly | |
| Add VSAR to Watchlist: View: Get Complete VSAR Trend Analysis ➞ | |
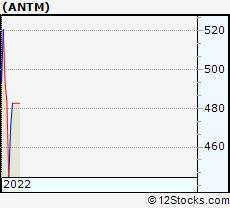 | ANTM Anthem, Inc. |
| Sector: Health Care | |
| SubSector: Health Care Plans | |
| MarketCap: 53150.8 Millions | |
| Recent Price: 482.58 Smart Investing & Trading Score: 10 | |
| Day Percent Change: 0% Day Change: -9999 | |
| Week Change: 0% Year-to-date Change: 0.0% | |
| ANTM Links: Profile News Message Board | |
| Charts:- Daily , Weekly | |
| Add ANTM to Watchlist: View: Get Complete ANTM Trend Analysis ➞ | |
 | HYH Halyard Health, Inc. |
| Sector: Health Care | |
| SubSector: Medical Instruments & Supplies | |
| MarketCap: 1851.14 Millions | |
| Recent Price: 57.25 Smart Investing & Trading Score: 10 | |
| Day Percent Change: 0% Day Change: -9999 | |
| Week Change: 0% Year-to-date Change: 0.0% | |
| HYH Links: Profile News Message Board | |
| Charts:- Daily , Weekly | |
| Add HYH to Watchlist: View: Get Complete HYH Trend Analysis ➞ | |
 | BLPH Bellerophon Therapeutics, Inc. |
| Sector: Health Care | |
| SubSector: Biotechnology | |
| MarketCap: 95.7785 Millions | |
| Recent Price: 0.10 Smart Investing & Trading Score: 10 | |
| Day Percent Change: 0% Day Change: -9999 | |
| Week Change: 0% Year-to-date Change: 0.0% | |
| BLPH Links: Profile News Message Board | |
| Charts:- Daily , Weekly | |
| Add BLPH to Watchlist: View: Get Complete BLPH Trend Analysis ➞ | |
 | AKAO Achaogen, Inc. |
| Sector: Health Care | |
| SubSector: Biotechnology | |
| MarketCap: 751.74 Millions | |
| Recent Price: 2.21 Smart Investing & Trading Score: 10 | |
| Day Percent Change: 0% Day Change: -9999 | |
| Week Change: -78.8921% Year-to-date Change: 0.0% | |
| AKAO Links: Profile News Message Board | |
| Charts:- Daily , Weekly | |
| Add AKAO to Watchlist: View: Get Complete AKAO Trend Analysis ➞ | |
 | APTX Aptinyx Inc. |
| Sector: Health Care | |
| SubSector: Biotechnology | |
| MarketCap: 109.285 Millions | |
| Recent Price: 0.15 Smart Investing & Trading Score: 10 | |
| Day Percent Change: 0% Day Change: -9999 | |
| Week Change: 0% Year-to-date Change: 0.0% | |
| APTX Links: Profile News Message Board | |
| Charts:- Daily , Weekly | |
| Add APTX to Watchlist: View: Get Complete APTX Trend Analysis ➞ | |
 | RUBY Rubius Therapeutics, Inc. |
| Sector: Health Care | |
| SubSector: Biotechnology | |
| MarketCap: 530.585 Millions | |
| Recent Price: 0.17 Smart Investing & Trading Score: 10 | |
| Day Percent Change: 0% Day Change: -9999 | |
| Week Change: 0% Year-to-date Change: 0.0% | |
| RUBY Links: Profile News Message Board | |
| Charts:- Daily , Weekly | |
| Add RUBY to Watchlist: View: Get Complete RUBY Trend Analysis ➞ | |
 | ODT Odonate Therapeutics, Inc. |
| Sector: Health Care | |
| SubSector: Biotechnology | |
| MarketCap: 684.485 Millions | |
| Recent Price: 12900.00 Smart Investing & Trading Score: 10 | |
| Day Percent Change: 0% Day Change: -9999 | |
| Week Change: -5.14706% Year-to-date Change: 0.0% | |
| ODT Links: Profile News Message Board | |
| Charts:- Daily , Weekly | |
| Add ODT to Watchlist: View: Get Complete ODT Trend Analysis ➞ | |
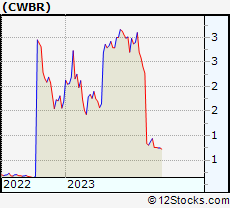 | CWBR CohBar, Inc. |
| Sector: Health Care | |
| SubSector: Biotechnology | |
| MarketCap: 59.2785 Millions | |
| Recent Price: 0.41 Smart Investing & Trading Score: 10 | |
| Day Percent Change: 0% Day Change: -9999 | |
| Week Change: 0% Year-to-date Change: 0.0% | |
| CWBR Links: Profile News Message Board | |
| Charts:- Daily , Weekly | |
| Add CWBR to Watchlist: View: Get Complete CWBR Trend Analysis ➞ | |
 | MGTA Magenta Therapeutics, Inc. |
| Sector: Health Care | |
| SubSector: Biotechnology | |
| MarketCap: 267.485 Millions | |
| Recent Price: 0.70 Smart Investing & Trading Score: 10 | |
| Day Percent Change: 0% Day Change: -9999 | |
| Week Change: -93.75% Year-to-date Change: 0.0% | |
| MGTA Links: Profile News Message Board | |
| Charts:- Daily , Weekly | |
| Add MGTA to Watchlist: View: Get Complete MGTA Trend Analysis ➞ | |
 | GRTS Gritstone Oncology, Inc. |
| Sector: Health Care | |
| SubSector: Biotechnology | |
| MarketCap: 240.085 Millions | |
| Recent Price: 0.02 Smart Investing & Trading Score: 10 | |
| Day Percent Change: 0% Day Change: -9999 | |
| Week Change: -7.6555% Year-to-date Change: 0.0% | |
| GRTS Links: Profile News Message Board | |
| Charts:- Daily , Weekly | |
| Add GRTS to Watchlist: View: Get Complete GRTS Trend Analysis ➞ | |
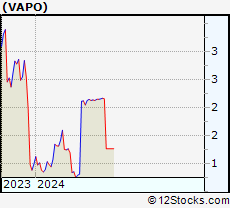 | VAPO Vapotherm, Inc. |
| Sector: Health Care | |
| SubSector: Medical Appliances & Equipment | |
| MarketCap: 190.68 Millions | |
| Recent Price: 1.27 Smart Investing & Trading Score: 10 | |
| Day Percent Change: 0% Day Change: -9999 | |
| Week Change: 0% Year-to-date Change: 0.0% | |
| VAPO Links: Profile News Message Board | |
| Charts:- Daily , Weekly | |
| Add VAPO to Watchlist: View: Get Complete VAPO Trend Analysis ➞ | |
 | MLND Millendo Therapeutics, Inc. |
| Sector: Health Care | |
| SubSector: Biotechnology | |
| MarketCap: 103.685 Millions | |
| Recent Price: 1.06 Smart Investing & Trading Score: 10 | |
| Day Percent Change: 0% Day Change: -9999 | |
| Week Change: 0% Year-to-date Change: 0.0% | |
| MLND Links: Profile News Message Board | |
| Charts:- Daily , Weekly | |
| Add MLND to Watchlist: View: Get Complete MLND Trend Analysis ➞ | |
 | APEN Apollo Endosurgery, Inc. |
| Sector: Health Care | |
| SubSector: Medical Appliances & Equipment | |
| MarketCap: 58.308 Millions | |
| Recent Price: 10.00 Smart Investing & Trading Score: 10 | |
| Day Percent Change: 0% Day Change: -9999 | |
| Week Change: 0% Year-to-date Change: 0.0% | |
| APEN Links: Profile News Message Board | |
| Charts:- Daily , Weekly | |
| Add APEN to Watchlist: View: Get Complete APEN Trend Analysis ➞ | |
 | SESN Sesen Bio, Inc. |
| Sector: Health Care | |
| SubSector: Biotechnology | |
| MarketCap: 58.7785 Millions | |
| Recent Price: 3.67 Smart Investing & Trading Score: 10 | |
| Day Percent Change: 0% Day Change: -9999 | |
| Week Change: 0% Year-to-date Change: 0.0% | |
| SESN Links: Profile News Message Board | |
| Charts:- Daily , Weekly | |
| Add SESN to Watchlist: View: Get Complete SESN Trend Analysis ➞ | |
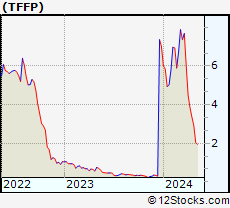 | TFFP TFF Pharmaceuticals, Inc. |
| Sector: Health Care | |
| SubSector: Biotechnology | |
| MarketCap: 80.0785 Millions | |
| Recent Price: 0.07 Smart Investing & Trading Score: 10 | |
| Day Percent Change: 0% Day Change: -9999 | |
| Week Change: 0% Year-to-date Change: 0.0% | |
| TFFP Links: Profile News Message Board | |
| Charts:- Daily , Weekly | |
| Add TFFP to Watchlist: View: Get Complete TFFP Trend Analysis ➞ | |
 | ZEAL Zealand Pharma A/S |
| Sector: Health Care | |
| SubSector: Biotechnology | |
| MarketCap: 1025.75 Millions | |
| Recent Price: 17.59 Smart Investing & Trading Score: 10 | |
| Day Percent Change: 0% Day Change: -9999 | |
| Week Change: 0% Year-to-date Change: 0.0% | |
| ZEAL Links: Profile News Message Board | |
| Charts:- Daily , Weekly | |
| Add ZEAL to Watchlist: View: Get Complete ZEAL Trend Analysis ➞ | |
 | KITE Kite Pharma, Inc. |
| Sector: Health Care | |
| SubSector: Biotechnology | |
| MarketCap: 4462.1 Millions | |
| Recent Price: 22.46 Smart Investing & Trading Score: 10 | |
| Day Percent Change: -0.088968% Day Change: -9999 | |
| Week Change: -32.5323% Year-to-date Change: 0.0% | |
| KITE Links: Profile News Message Board | |
| Charts:- Daily , Weekly | |
| Add KITE to Watchlist: View: Get Complete KITE Trend Analysis ➞ | |
 | CBPO China Biologic Products Holdings, Inc. |
| Sector: Health Care | |
| SubSector: Biotechnology | |
| MarketCap: 4360.65 Millions | |
| Recent Price: 8.47 Smart Investing & Trading Score: 10 | |
| Day Percent Change: -0.235571% Day Change: -9999 | |
| Week Change: -71.9536% Year-to-date Change: 0.0% | |
| CBPO Links: Profile News Message Board | |
| Charts:- Daily , Weekly | |
| Add CBPO to Watchlist: View: Get Complete CBPO Trend Analysis ➞ | |
 | ESRX Express Scripts Holding Company |
| Sector: Health Care | |
| SubSector: Health Care Plans | |
| MarketCap: 40223.9 Millions | |
| Recent Price: 16.50 Smart Investing & Trading Score: 10 | |
| Day Percent Change: -0.241838% Day Change: -9999 | |
| Week Change: -47.3012% Year-to-date Change: 0.0% | |
| ESRX Links: Profile News Message Board | |
| Charts:- Daily , Weekly | |
| Add ESRX to Watchlist: View: Get Complete ESRX Trend Analysis ➞ | |
 | OABI OmniAb Inc |
| Sector: Health Care | |
| SubSector: Biotechnology | |
| MarketCap: 209.82 Millions | |
| Recent Price: 1.60 Smart Investing & Trading Score: 10 | |
| Day Percent Change: -0.310559% Day Change: -0.03 | |
| Week Change: 1.58228% Year-to-date Change: -54.1% | |
| OABI Links: Profile News Message Board | |
| Charts:- Daily , Weekly | |
| Add OABI to Watchlist: View: Get Complete OABI Trend Analysis ➞ | |
| For tabular summary view of above stock list: Summary View ➞ 0 - 25 , 25 - 50 , 50 - 75 , 75 - 100 , 100 - 125 , 125 - 150 , 150 - 175 , 175 - 200 , 200 - 225 , 225 - 250 , 250 - 275 , 275 - 300 , 300 - 325 , 325 - 350 , 350 - 375 , 375 - 400 , 400 - 425 , 425 - 450 , 450 - 475 , 475 - 500 , 500 - 525 , 525 - 550 , 550 - 575 , 575 - 600 , 600 - 625 , 625 - 650 , 650 - 675 , 675 - 700 , 700 - 725 , 725 - 750 , 750 - 775 , 775 - 800 , 800 - 825 , 825 - 850 , 850 - 875 , 875 - 900 , 900 - 925 , 925 - 950 , 950 - 975 , 975 - 1000 | ||
| Click To Change The Sort Order: By Market Cap or Company Size Performance: Year-to-date, Week and Day | |
| Select Chart Type: | ||
|
Best Stocks Today 12Stocks.com |
© 2025 12Stocks.com Terms & Conditions Privacy Contact Us
All Information Provided Only For Education And Not To Be Used For Investing or Trading. See Terms & Conditions


One More Thing ... Get Best Stocks Delivered Daily!
Never Ever Miss A Move With Our Top Ten Stocks Lists
Find Best Stocks In Any Market - Bull or Bear Market
Take A Peek At Our Top Ten Stocks Lists: Daily, Weekly, Year-to-Date & Top Trends
Find Best Stocks In Any Market - Bull or Bear Market
Take A Peek At Our Top Ten Stocks Lists: Daily, Weekly, Year-to-Date & Top Trends
Healthcare Stocks With Best Up Trends [0-bearish to 100-bullish]: Taysha Gene[100], DBV Technologies[100], Valneva SE[100], ClearPoint Neuro[100], Prime Medicine[100], AlloVir [100], Sarepta [100], Monopar [100], Cara [100], Absci Corp[100], Spruce Biosciences[100]
Best Healthcare Stocks Year-to-Date:
Regencell Bioscience[12636.6%], Kaleido BioSciences[9900%], Vor Biopharma[3175%], Nanobiotix ADR[581.379%], Eagle [542.857%], So-Young [395.711%], I-Mab ADR[357.506%], Monopar [337.489%], Nektar [319.84%], 908 Devices[299.543%], DBV Technologies[276.923%] Best Healthcare Stocks This Week:
Athersys [193287%], Nobilis Health[101349%], VBI Vaccines[86898.5%], ContraFect [47677.8%], Clovis Oncology[39610.5%], Endo [28369.6%], NanoString Technologies[17224.7%], Neptune Wellness[14100%], ViewRay [11470.2%], Mallkrodt [11382.1%], Achillion [10033.3%] Best Healthcare Stocks Daily:
Kaleido BioSciences[9900%], Neoleukin [332.665%], Syros [226.23%], Athenex [103.333%], Taysha Gene[53.4591%], DBV Technologies[21.6485%], Valneva SE[20.197%], ClearPoint Neuro[19.7991%], Prime Medicine[19.4097%], Accelerate Diagnostics[17.6471%], Aptose Biosciences[17.5439%]