
 Login Sign Up


| |||||
 |  | ||||

| 12Stocks.com Market Intelligence |
Best Healthcare Stocks
 | "Discover best trending healthcare stocks with 12Stocks.com." |
| - Subu Vdaygiri, Founder, 12Stocks.com |
| In a hurry? Healthcare Stocks Lists: Performance Trends Table, Stock Charts
Sort Healthcare stocks: Daily, Weekly, Year-to-Date, Market Cap & Trends. Filter Healthcare stocks list by size:All Healthcare Large Mid-Range Small |
| 12Stocks.com Healthcare Stocks Performances & Trends Daily | |||||||||
|
|  The overall Smart Investing & Trading Score is 70 (0-bearish to 100-bullish) which puts Healthcare sector in short term neutral to bullish trend. The Smart Investing & Trading Score from previous trading session is 90 and hence a deterioration of trend.
| ||||||||
Here are the Smart Investing & Trading Scores of the most requested Healthcare stocks at 12Stocks.com (click stock name for detailed review):
|


| 12Stocks.com: Investing in Healthcare sector with Stocks | |
|
The following table helps investors and traders sort through current performance and trends (as measured by Smart Investing & Trading Score) of various
stocks in the Healthcare sector. Quick View: Move mouse or cursor over stock symbol (ticker) to view short-term Technical chart and over stock name to view long term chart. Click on  to add stock symbol to your watchlist and to add stock symbol to your watchlist and  to view watchlist. Click on any ticker or stock name for detailed market intelligence report for that stock. to view watchlist. Click on any ticker or stock name for detailed market intelligence report for that stock. |
12Stocks.com Performance of Stocks in Healthcare Sector
| Ticker | Stock Name | Watchlist | Category | Recent Price | Smart Investing & Trading Score | Change % | YTD Change% |
| IGMS | IGM Biosciences |   | Biotechnology | 1.27 | 10 | -2.31 | -79.55% |
| SAVA | Cassava Sciences | | Biotechnology | 2.11 | 20 | -2.31 | -23.27% |
| DRTS | Alpha Tau | | Biotechnology | 3.81 | 90 | -2.31 | 22.90% |
| AXGN | Axogen | | Medical Devices | 16.41 | 80 | -2.32 | 0.06% |
| WAT | Waters Corp | | Diagnostics & Research | 295.39 | 50 | -2.33 | -19.79% |
| DBVT | DBV Technologies | | Biotechnology | 8.97 | 0 | -2.33 | 175.88% |
| SEM | Select | | Medical Care Facilities | 12.51 | 10 | -2.34 | -32.91% |
| ATEC | Alphatec | | Medical Devices | 15.26 | 30 | -2.37 | 68.43% |
| OMI | Owens & Minor | | Medical Distribution | 5.34 | 60 | -2.38 | -58.44% |
| HAE | Haemonetics Corp | | Medical Devices | 52.20 | 0 | -2.39 | -33.42% |
| URGN | UroGen Pharma | | Biotechnology | 18.79 | 40 | -2.39 | 75.61% |
| CNC | Centene Corp | | Healthcare Plans | 33.26 | 70 | -2.41 | -45.03% |
| TMO | Thermo Fisher | | Diagnostics & Research | 479.46 | 40 | -2.43 | -8.08% |
| ACAD | Acadia | | Biotechnology | 23.61 | 20 | -2.44 | 26.53% |
| XERS | Xeris Biopharma | | Biotechnology | 7.49 | 30 | -2.47 | 116.47% |
| TELA | TELA Bio | | Medical Devices | 1.58 | 20 | -2.47 | -45.14% |
| XBIT | XBiotech | | Biotechnology | 2.75 | 20 | -2.48 | -34.05% |
| KRMD | KORU | | Instruments | 3.92 | 30 | -2.49 | 0.90% |
| AMAG | AMAG | | Biotechnology | 1.17 | 10 | -2.50 | 0.00% |
| LCI | Lannett | | Pharmaceutical | 1.17 | 70 | -2.50 | 0.00% |
| SOPH | SOPHiA Genetics | | Health Information | 3.12 | 10 | -2.50 | -2.19% |
| CHE | Chemed Corp | | Medical Care Facilities | 446.40 | 20 | -2.51 | -15.18% |
| AHCO | AdaptHealth Corp | | Medical Devices | 9.29 | 30 | -2.52 | -4.23% |
| ACHV | Achieve Life | | Biotechnology | 3.08 | 60 | -2.53 | -16.53% |
| NBTX | Nanobiotix ADR | | Biotechnology | 9.70 | 60 | -2.53 | 234.44% |
| For chart view version of above stock list: Chart View ➞ 0 - 25 , 25 - 50 , 50 - 75 , 75 - 100 , 100 - 125 , 125 - 150 , 150 - 175 , 175 - 200 , 200 - 225 , 225 - 250 , 250 - 275 , 275 - 300 , 300 - 325 , 325 - 350 , 350 - 375 , 375 - 400 , 400 - 425 , 425 - 450 , 450 - 475 , 475 - 500 , 500 - 525 , 525 - 550 , 550 - 575 , 575 - 600 , 600 - 625 , 625 - 650 , 650 - 675 , 675 - 700 , 700 - 725 , 725 - 750 , 750 - 775 , 775 - 800 , 800 - 825 , 825 - 850 , 850 - 875 , 875 - 900 , 900 - 925 , 925 - 950 , 950 - 975 , 975 - 1000 | ||
 | Click To Change The Sort Order: By Market Cap or Company Size Performance: Year-to-date, Week and Day |  |
|
Get the most comprehensive stock market coverage daily at 12Stocks.com ➞ Best Stocks Today ➞ Best Stocks Weekly ➞ Best Stocks Year-to-Date ➞ Best Stocks Trends ➞  Best Stocks Today 12Stocks.com Best Nasdaq Stocks ➞ Best S&P 500 Stocks ➞ Best Tech Stocks ➞ Best Biotech Stocks ➞ |
| Detailed Overview of Healthcare Stocks |
| Healthcare Technical Overview, Leaders & Laggards, Top Healthcare ETF Funds & Detailed Healthcare Stocks List, Charts, Trends & More |
| Healthcare Sector: Technical Analysis, Trends & YTD Performance | |
| Healthcare sector is composed of stocks
from pharmaceutical, biotech, diagnostics labs, insurance providers
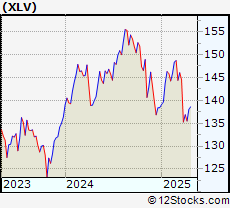
and healthcare services. Healthcare sector, as represented by XLV, an exchange-traded fund [ETF] that holds basket of Healthcare stocks (e.g, Merck, Amgen) is up by 1.23288% and is currently underperforming the overall market by -11.61812% year-to-date. Below is a quick view of Technical charts and trends: |
|
 XLV Weekly Chart |
|
| Long Term Trend: Very Good | |
| Medium Term Trend: Deteriorating | |
 XLV Daily Chart |
|
| Short Term Trend: Not Good | |
| Overall Trend Score: 70 | |
| YTD Performance: 1.23288% | |
| **Trend Scores & Views Are Only For Educational Purposes And Not For Investing | |
| 12Stocks.com: Top Performing Healthcare Sector Stocks | ||||||||||||||||||||||||||||||||||||||||||||||
 The top performing Healthcare sector stocks year to date are
Now, more recently, over last week, the top performing Healthcare sector stocks on the move are


|
||||||||||||||||||||||||||||||||||||||||||||||
| 12Stocks.com: Investing in Healthcare Sector using Exchange Traded Funds | |
|
The following table shows list of key exchange traded funds (ETF) that
help investors track Healthcare Index. For detailed view, check out our ETF Funds section of our website. Quick View: Move mouse or cursor over ETF symbol (ticker) to view short-term Technical chart and over ETF name to view long term chart. Click on ticker or stock name for detailed view. Click on to add stock symbol to your watchlist and to view watchlist. |
12Stocks.com List of ETFs that track Healthcare Index
| Ticker | ETF Name | Watchlist | Recent Price | Smart Investing & Trading Score | Change % | Week % | Year-to-date % |
| BTEC | Principal Healthcare Innovators | | 39.49 | 30 | 0 | 1.02328 | 0% |
| 12Stocks.com: Charts, Trends, Fundamental Data and Performances of Healthcare Stocks | |
|
We now take in-depth look at all Healthcare stocks including charts, multi-period performances and overall trends (as measured by Smart Investing & Trading Score). One can sort Healthcare stocks (click link to choose) by Daily, Weekly and by Year-to-Date performances. Also, one can sort by size of the company or by market capitalization. |
| Select Your Default Chart Type: | |||||
| |||||
| Click on stock symbol or name for detailed view. Click on to add stock symbol to your watchlist and to view watchlist. Quick View: Move mouse or cursor over "Daily" to quickly view daily Technical stock chart and over "Weekly" to view weekly Technical stock chart. | |||||

 | IGMS IGM Biosciences, Inc. |
| Sector: Health Care | |
| SubSector: Biotechnology | |
| MarketCap: 2000.05 Millions | |
| Recent Price: 1.27 Smart Investing & Trading Score: 10 | |
| Day Percent Change: -2.30769% Day Change: -9999 | |
| Week Change: -0.78125% Year-to-date Change: -79.5% | |
| IGMS Links: Profile News Message Board | |
| Charts:- Daily , Weekly | |
| Add IGMS to Watchlist: View: Get Complete IGMS Trend Analysis ➞ | |
 | SAVA Cassava Sciences Inc |
| Sector: Health Care | |
| SubSector: Biotechnology | |
| MarketCap: 104.35 Millions | |
| Recent Price: 2.11 Smart Investing & Trading Score: 20 | |
| Day Percent Change: -2.31481% Day Change: 0.01 | |
| Week Change: -1.86047% Year-to-date Change: -23.3% | |
| SAVA Links: Profile News Message Board | |
| Charts:- Daily , Weekly | |
| Add SAVA to Watchlist: View: Get Complete SAVA Trend Analysis ➞ | |
 | DRTS Alpha Tau Medical Ltd |
| Sector: Health Care | |
| SubSector: Biotechnology | |
| MarketCap: 304.92 Millions | |
| Recent Price: 3.81 Smart Investing & Trading Score: 90 | |
| Day Percent Change: -2.30769% Day Change: 0.08 | |
| Week Change: 9.48276% Year-to-date Change: 22.9% | |
| DRTS Links: Profile News Message Board | |
| Charts:- Daily , Weekly | |
| Add DRTS to Watchlist: View: Get Complete DRTS Trend Analysis ➞ | |
 | AXGN Axogen Inc |
| Sector: Health Care | |
| SubSector: Medical Devices | |
| MarketCap: 735.28 Millions | |
| Recent Price: 16.41 Smart Investing & Trading Score: 80 | |
| Day Percent Change: -2.32143% Day Change: 0.28 | |
| Week Change: 6.55844% Year-to-date Change: 0.1% | |
| AXGN Links: Profile News Message Board | |
| Charts:- Daily , Weekly | |
| Add AXGN to Watchlist: View: Get Complete AXGN Trend Analysis ➞ | |
 | WAT Waters Corp |
| Sector: Health Care | |
| SubSector: Diagnostics & Research | |
| MarketCap: 18233.4 Millions | |
| Recent Price: 295.39 Smart Investing & Trading Score: 50 | |
| Day Percent Change: -2.33427% Day Change: -5.68 | |
| Week Change: -1.43482% Year-to-date Change: -19.8% | |
| WAT Links: Profile News Message Board | |
| Charts:- Daily , Weekly | |
| Add WAT to Watchlist: View: Get Complete WAT Trend Analysis ➞ | |
 | DBVT DBV Technologies ADR |
| Sector: Health Care | |
| SubSector: Biotechnology | |
| MarketCap: 245.22 Millions | |
| Recent Price: 8.97 Smart Investing & Trading Score: 0 | |
| Day Percent Change: -2.33115% Day Change: -0.26 | |
| Week Change: -10.34% Year-to-date Change: 175.9% | |
| DBVT Links: Profile News Message Board | |
| Charts:- Daily , Weekly | |
| Add DBVT to Watchlist: View: Get Complete DBVT Trend Analysis ➞ | |
 | SEM Select Medical Holdings Corporation |
| Sector: Health Care | |
| SubSector: Medical Care Facilities | |
| MarketCap: 1624.26 Millions | |
| Recent Price: 12.51 Smart Investing & Trading Score: 10 | |
| Day Percent Change: -2.34192% Day Change: 0.06 | |
| Week Change: -3.8432% Year-to-date Change: -32.9% | |
| SEM Links: Profile News Message Board | |
| Charts:- Daily , Weekly | |
| Add SEM to Watchlist: View: Get Complete SEM Trend Analysis ➞ | |
 | ATEC Alphatec Holdings Inc |
| Sector: Health Care | |
| SubSector: Medical Devices | |
| MarketCap: 2426.93 Millions | |
| Recent Price: 15.26 Smart Investing & Trading Score: 30 | |
| Day Percent Change: -2.36724% Day Change: 0.04 | |
| Week Change: -7.79456% Year-to-date Change: 68.4% | |
| ATEC Links: Profile News Message Board | |
| Charts:- Daily , Weekly | |
| Add ATEC to Watchlist: View: Get Complete ATEC Trend Analysis ➞ | |
 | OMI Owens & Minor, Inc |
| Sector: Health Care | |
| SubSector: Medical Distribution | |
| MarketCap: 434.11 Millions | |
| Recent Price: 5.34 Smart Investing & Trading Score: 60 | |
| Day Percent Change: -2.3766% Day Change: -0.26 | |
| Week Change: -1.11111% Year-to-date Change: -58.4% | |
| OMI Links: Profile News Message Board | |
| Charts:- Daily , Weekly | |
| Add OMI to Watchlist: View: Get Complete OMI Trend Analysis ➞ | |
 | HAE Haemonetics Corp |
| Sector: Health Care | |
| SubSector: Medical Devices | |
| MarketCap: 2619.88 Millions | |
| Recent Price: 52.20 Smart Investing & Trading Score: 0 | |
| Day Percent Change: -2.39342% Day Change: -0.47 | |
| Week Change: -3.47633% Year-to-date Change: -33.4% | |
| HAE Links: Profile News Message Board | |
| Charts:- Daily , Weekly | |
| Add HAE to Watchlist: View: Get Complete HAE Trend Analysis ➞ | |
 | URGN UroGen Pharma Ltd |
| Sector: Health Care | |
| SubSector: Biotechnology | |
| MarketCap: 873.47 Millions | |
| Recent Price: 18.79 Smart Investing & Trading Score: 40 | |
| Day Percent Change: -2.38961% Day Change: 0.47 | |
| Week Change: -0.0531915% Year-to-date Change: 75.6% | |
| URGN Links: Profile News Message Board | |
| Charts:- Daily , Weekly | |
| Add URGN to Watchlist: View: Get Complete URGN Trend Analysis ➞ | |
 | CNC Centene Corp |
| Sector: Health Care | |
| SubSector: Healthcare Plans | |
| MarketCap: 14233 Millions | |
| Recent Price: 33.26 Smart Investing & Trading Score: 70 | |
| Day Percent Change: -2.4061% Day Change: -0.75 | |
| Week Change: 16.0907% Year-to-date Change: -45.0% | |
| CNC Links: Profile News Message Board | |
| Charts:- Daily , Weekly | |
| Add CNC to Watchlist: View: Get Complete CNC Trend Analysis ➞ | |
 | TMO Thermo Fisher Scientific Inc |
| Sector: Health Care | |
| SubSector: Diagnostics & Research | |
| MarketCap: 186012 Millions | |
| Recent Price: 479.46 Smart Investing & Trading Score: 40 | |
| Day Percent Change: -2.43178% Day Change: -7.11 | |
| Week Change: -2.04907% Year-to-date Change: -8.1% | |
| TMO Links: Profile News Message Board | |
| Charts:- Daily , Weekly | |
| Add TMO to Watchlist: View: Get Complete TMO Trend Analysis ➞ | |
 | ACAD Acadia Pharmaceuticals Inc |
| Sector: Health Care | |
| SubSector: Biotechnology | |
| MarketCap: 4261.67 Millions | |
| Recent Price: 23.61 Smart Investing & Trading Score: 20 | |
| Day Percent Change: -2.43802% Day Change: -0.16 | |
| Week Change: -7.41176% Year-to-date Change: 26.5% | |
| ACAD Links: Profile News Message Board | |
| Charts:- Daily , Weekly | |
| Add ACAD to Watchlist: View: Get Complete ACAD Trend Analysis ➞ | |
 | XERS Xeris Biopharma Holdings Inc |
| Sector: Health Care | |
| SubSector: Biotechnology | |
| MarketCap: 1267.62 Millions | |
| Recent Price: 7.49 Smart Investing & Trading Score: 30 | |
| Day Percent Change: -2.47396% Day Change: 0.02 | |
| Week Change: -5.06971% Year-to-date Change: 116.5% | |
| XERS Links: Profile News Message Board | |
| Charts:- Daily , Weekly | |
| Add XERS to Watchlist: View: Get Complete XERS Trend Analysis ➞ | |
 | TELA TELA Bio Inc |
| Sector: Health Care | |
| SubSector: Medical Devices | |
| MarketCap: 62.99 Millions | |
| Recent Price: 1.58 Smart Investing & Trading Score: 20 | |
| Day Percent Change: -2.46914% Day Change: 0.03 | |
| Week Change: -0.628931% Year-to-date Change: -45.1% | |
| TELA Links: Profile News Message Board | |
| Charts:- Daily , Weekly | |
| Add TELA to Watchlist: View: Get Complete TELA Trend Analysis ➞ | |
 | XBIT XBiotech Inc |
| Sector: Health Care | |
| SubSector: Biotechnology | |
| MarketCap: 89.02 Millions | |
| Recent Price: 2.75 Smart Investing & Trading Score: 20 | |
| Day Percent Change: -2.48227% Day Change: -0.02 | |
| Week Change: -7.71812% Year-to-date Change: -34.1% | |
| XBIT Links: Profile News Message Board | |
| Charts:- Daily , Weekly | |
| Add XBIT to Watchlist: View: Get Complete XBIT Trend Analysis ➞ | |
 | KRMD KORU Medical Systems Inc |
| Sector: Health Care | |
| SubSector: Medical Instruments & Supplies | |
| MarketCap: 187.71 Millions | |
| Recent Price: 3.92 Smart Investing & Trading Score: 30 | |
| Day Percent Change: -2.48756% Day Change: -0.04 | |
| Week Change: -4.39024% Year-to-date Change: 0.9% | |
| KRMD Links: Profile News Message Board | |
| Charts:- Daily , Weekly | |
| Add KRMD to Watchlist: View: Get Complete KRMD Trend Analysis ➞ | |
 | AMAG AMAG Pharmaceuticals, Inc. |
| Sector: Health Care | |
| SubSector: Biotechnology | |
| MarketCap: 217.385 Millions | |
| Recent Price: 1.17 Smart Investing & Trading Score: 10 | |
| Day Percent Change: -2.5% Day Change: -9999 | |
| Week Change: -71.9424% Year-to-date Change: 0.0% | |
| AMAG Links: Profile News Message Board | |
| Charts:- Daily , Weekly | |
| Add AMAG to Watchlist: View: Get Complete AMAG Trend Analysis ➞ | |
 | LCI Lannett Company, Inc. |
| Sector: Health Care | |
| SubSector: Drugs - Generic | |
| MarketCap: 359.185 Millions | |
| Recent Price: 1.17 Smart Investing & Trading Score: 70 | |
| Day Percent Change: -2.5% Day Change: -9999 | |
| Week Change: 5471.43% Year-to-date Change: 0.0% | |
| LCI Links: Profile News Message Board | |
| Charts:- Daily , Weekly | |
| Add LCI to Watchlist: View: Get Complete LCI Trend Analysis ➞ | |
 | SOPH SOPHiA Genetics SA |
| Sector: Health Care | |
| SubSector: Health Information Services | |
| MarketCap: 218.96 Millions | |
| Recent Price: 3.12 Smart Investing & Trading Score: 10 | |
| Day Percent Change: -2.5% Day Change: -0.14 | |
| Week Change: -8.5044% Year-to-date Change: -2.2% | |
| SOPH Links: Profile News Message Board | |
| Charts:- Daily , Weekly | |
| Add SOPH to Watchlist: View: Get Complete SOPH Trend Analysis ➞ | |
 | CHE Chemed Corp |
| Sector: Health Care | |
| SubSector: Medical Care Facilities | |
| MarketCap: 6785.02 Millions | |
| Recent Price: 446.40 Smart Investing & Trading Score: 20 | |
| Day Percent Change: -2.50934% Day Change: -7.84 | |
| Week Change: -2.89319% Year-to-date Change: -15.2% | |
| CHE Links: Profile News Message Board | |
| Charts:- Daily , Weekly | |
| Add CHE to Watchlist: View: Get Complete CHE Trend Analysis ➞ | |
 | AHCO AdaptHealth Corp |
| Sector: Health Care | |
| SubSector: Medical Devices | |
| MarketCap: 1286.68 Millions | |
| Recent Price: 9.29 Smart Investing & Trading Score: 30 | |
| Day Percent Change: -2.51836% Day Change: -0.01 | |
| Week Change: 0.868621% Year-to-date Change: -4.2% | |
| AHCO Links: Profile News Message Board | |
| Charts:- Daily , Weekly | |
| Add AHCO to Watchlist: View: Get Complete AHCO Trend Analysis ➞ | |
 | ACHV Achieve Life Sciences Inc |
| Sector: Health Care | |
| SubSector: Biotechnology | |
| MarketCap: 144.63 Millions | |
| Recent Price: 3.08 Smart Investing & Trading Score: 60 | |
| Day Percent Change: -2.53165% Day Change: 0.31 | |
| Week Change: 10.3943% Year-to-date Change: -16.5% | |
| ACHV Links: Profile News Message Board | |
| Charts:- Daily , Weekly | |
| Add ACHV to Watchlist: View: Get Complete ACHV Trend Analysis ➞ | |
 | NBTX Nanobiotix ADR |
| Sector: Health Care | |
| SubSector: Biotechnology | |
| MarketCap: 416.9 Millions | |
| Recent Price: 9.70 Smart Investing & Trading Score: 60 | |
| Day Percent Change: -2.52563% Day Change: 1.21 | |
| Week Change: 13.7811% Year-to-date Change: 234.4% | |
| NBTX Links: Profile News Message Board | |
| Charts:- Daily , Weekly | |
| Add NBTX to Watchlist: View: Get Complete NBTX Trend Analysis ➞ | |
| For tabular summary view of above stock list: Summary View ➞ 0 - 25 , 25 - 50 , 50 - 75 , 75 - 100 , 100 - 125 , 125 - 150 , 150 - 175 , 175 - 200 , 200 - 225 , 225 - 250 , 250 - 275 , 275 - 300 , 300 - 325 , 325 - 350 , 350 - 375 , 375 - 400 , 400 - 425 , 425 - 450 , 450 - 475 , 475 - 500 , 500 - 525 , 525 - 550 , 550 - 575 , 575 - 600 , 600 - 625 , 625 - 650 , 650 - 675 , 675 - 700 , 700 - 725 , 725 - 750 , 750 - 775 , 775 - 800 , 800 - 825 , 825 - 850 , 850 - 875 , 875 - 900 , 900 - 925 , 925 - 950 , 950 - 975 , 975 - 1000 | ||
| Click To Change The Sort Order: By Market Cap or Company Size Performance: Year-to-date, Week and Day | |
| Select Chart Type: | ||
|
Best Stocks Today 12Stocks.com |
© 2025 12Stocks.com Terms & Conditions Privacy Contact Us
All Information Provided Only For Education And Not To Be Used For Investing or Trading. See Terms & Conditions


One More Thing ... Get Best Stocks Delivered Daily!
Never Ever Miss A Move With Our Top Ten Stocks Lists
Find Best Stocks In Any Market - Bull or Bear Market
Take A Peek At Our Top Ten Stocks Lists: Daily, Weekly, Year-to-Date & Top Trends
Find Best Stocks In Any Market - Bull or Bear Market
Take A Peek At Our Top Ten Stocks Lists: Daily, Weekly, Year-to-Date & Top Trends
Healthcare Stocks With Best Up Trends [0-bearish to 100-bullish]: AlloVir [100], Cara [100], Spruce Biosciences[100], Kala Bio[100], Protalix Bio[100], Microbot [100], Kindred [100], Lineage Cell[100], Scilex Holding[100], Immuneering Corp[100], RAPT [100]
Best Healthcare Stocks Year-to-Date:
Regencell Bioscience[11493.1%], Kaleido BioSciences[9900%], Eagle [664.286%], So-Young [375.53%], Galectin [358.974%], I-Mab ADR[351.435%], Celcuity [318.203%], Immuneering Corp[284.163%], Biosig Technologies[270%], Gossamer Bio[256.701%], Microbot [255.263%] Best Healthcare Stocks This Week:
Athersys [193287%], Nobilis Health[101349%], VBI Vaccines[86898.5%], ContraFect [47677.8%], Clovis Oncology[39610.5%], Endo [28369.6%], NanoString Technologies[17224.7%], Neptune Wellness[14100%], ViewRay [11470.2%], Mallkrodt [11382.1%], Achillion [10033.3%] Best Healthcare Stocks Daily:
Kaleido BioSciences[9900%], Neoleukin [332.665%], Syros [226.23%], Athenex [103.333%], Accelerate Diagnostics[17.6471%], Aptose Biosciences[17.5439%], AlloVir [16.9215%], China SXT[15.1163%], Cara [14.3396%], Tyra Biosciences[14.26%], Prenetics Global[13.7133%]