
 Login Sign Up


| |||||
 |  | ||||

| 12Stocks.com Market Intelligence |
Best Healthcare Stocks
 | "Discover best trending healthcare stocks with 12Stocks.com." |
| - Subu Vdaygiri, Founder, 12Stocks.com |
| In a hurry? Healthcare Stocks Lists: Performance Trends Table, Stock Charts
Sort Healthcare stocks: Daily, Weekly, Year-to-Date, Market Cap & Trends. Filter Healthcare stocks list by size:All Healthcare Large Mid-Range Small |
| 12Stocks.com Healthcare Stocks Performances & Trends Daily | |||||||||
|
|  The overall Smart Investing & Trading Score is 70 (0-bearish to 100-bullish) which puts Healthcare sector in short term neutral to bullish trend. The Smart Investing & Trading Score from previous trading session is 90 and hence a deterioration of trend.
| ||||||||
Here are the Smart Investing & Trading Scores of the most requested Healthcare stocks at 12Stocks.com (click stock name for detailed review):
|


| 12Stocks.com: Investing in Healthcare sector with Stocks | |
|
The following table helps investors and traders sort through current performance and trends (as measured by Smart Investing & Trading Score) of various
stocks in the Healthcare sector. Quick View: Move mouse or cursor over stock symbol (ticker) to view short-term Technical chart and over stock name to view long term chart. Click on  to add stock symbol to your watchlist and to add stock symbol to your watchlist and  to view watchlist. Click on any ticker or stock name for detailed market intelligence report for that stock. to view watchlist. Click on any ticker or stock name for detailed market intelligence report for that stock. |
12Stocks.com Performance of Stocks in Healthcare Sector
| Ticker | Stock Name | Watchlist | Category | Recent Price | Smart Investing & Trading Score | Change % | YTD Change% |
| BAX | Baxter |   | Instruments | 23.99 | 10 | -2.04 | -17.15% |
| LMAT | Lemaitre Vascular | | Instruments | 92.29 | 40 | -2.06 | 1.39% |
| LFST | LifeStance Health | | Medical Care Facilities | 5.23 | 30 | -2.06 | -30.73% |
| TMDX | Transmedics | | Medical Devices | 114.56 | 60 | -2.07 | 72.28% |
| OPK | Opko Health | | Diagnostics & Research | 1.40 | 60 | -2.10 | -3.45% |
| MASS | 908 Devices | | Medical Devices | 5.60 | 10 | -2.10 | 155.71% |
| USPH | U.S. Physical | | Medical Care Facilities | 80.27 | 30 | -2.12 | -7.57% |
| SLS | SELLAS Life | | Biotechnology | 1.85 | 30 | -2.12 | 72.90% |
| CNMD | Conmed Corp | | Medical Devices | 52.90 | 50 | -2.13 | -20.90% |
| LEGN | Legend Biotech | | Biotechnology | 33.11 | 10 | -2.13 | -4.66% |
| NUVL | Nuvalent | | Biotechnology | 80.47 | 90 | -2.13 | 0.60% |
| VALN | Valneva SE | | Biotechnology | 8.65 | 30 | -2.15 | 83.26% |
| AMPH | Amphastar | | Drug Manufacturers - Specialty & Generic | 28.06 | 30 | -2.16 | -22.83% |
| APLS | Apellis | | Biotechnology | 24.85 | 30 | -2.17 | -25.06% |
| MD | Pediatrix | | Medical Care Facilities | 16.64 | 30 | -2.18 | 27.71% |
| MSLI | Merus Labs | | Pharmaceutical | 31.79 | 20 | -2.18 | 0.00% |
| ORGO | Organogenesis | | Drug Manufacturers - Specialty & Generic | 4.93 | 60 | -2.18 | 62.71% |
| AVXL | Anavex Life | | Biotechnology | 9.37 | 10 | -2.19 | -22.88% |
| MIRM | Mirum | | Biotechnology | 74.31 | 50 | -2.21 | 76.76% |
| AMGN | AMGEN | | Drug Manufacturers - General | 276.39 | 0 | -2.24 | 8.41% |
| BIOA | BioAge Labs | | Drug Manufacturers - Specialty & Generic | 4.80 | 50 | -2.24 | -13.67% |
| CEMI | Chembio Diagnostics | | Diagnostic | 53.90 | 80 | -2.25 | 0.00% |
| ARQT | Arcutis Bio | | Biotechnology | 17.29 | 60 | -2.26 | 18.75% |
| ONCY | Oncolytics Biotech | | Biotechnology | 1.28 | 80 | -2.29 | 37.66% |
| ROIV | Roivant Sciences | | Biotechnology | 14.08 | 90 | -2.29 | 16.56% |
| For chart view version of above stock list: Chart View ➞ 0 - 25 , 25 - 50 , 50 - 75 , 75 - 100 , 100 - 125 , 125 - 150 , 150 - 175 , 175 - 200 , 200 - 225 , 225 - 250 , 250 - 275 , 275 - 300 , 300 - 325 , 325 - 350 , 350 - 375 , 375 - 400 , 400 - 425 , 425 - 450 , 450 - 475 , 475 - 500 , 500 - 525 , 525 - 550 , 550 - 575 , 575 - 600 , 600 - 625 , 625 - 650 , 650 - 675 , 675 - 700 , 700 - 725 , 725 - 750 , 750 - 775 , 775 - 800 , 800 - 825 , 825 - 850 , 850 - 875 , 875 - 900 , 900 - 925 , 925 - 950 , 950 - 975 , 975 - 1000 | ||
 | Click To Change The Sort Order: By Market Cap or Company Size Performance: Year-to-date, Week and Day |  |
|
Get the most comprehensive stock market coverage daily at 12Stocks.com ➞ Best Stocks Today ➞ Best Stocks Weekly ➞ Best Stocks Year-to-Date ➞ Best Stocks Trends ➞  Best Stocks Today 12Stocks.com Best Nasdaq Stocks ➞ Best S&P 500 Stocks ➞ Best Tech Stocks ➞ Best Biotech Stocks ➞ |
| Detailed Overview of Healthcare Stocks |
| Healthcare Technical Overview, Leaders & Laggards, Top Healthcare ETF Funds & Detailed Healthcare Stocks List, Charts, Trends & More |
| Healthcare Sector: Technical Analysis, Trends & YTD Performance | |
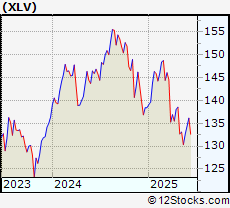
| Healthcare sector is composed of stocks
from pharmaceutical, biotech, diagnostics labs, insurance providers
and healthcare services. Healthcare sector, as represented by XLV, an exchange-traded fund [ETF] that holds basket of Healthcare stocks (e.g, Merck, Amgen) is up by 1.23288% and is currently underperforming the overall market by -11.61812% year-to-date. Below is a quick view of Technical charts and trends: |
|
 XLV Weekly Chart |
|
| Long Term Trend: Very Good | |
| Medium Term Trend: Deteriorating | |
 XLV Daily Chart |
|
| Short Term Trend: Not Good | |
| Overall Trend Score: 70 | |
| YTD Performance: 1.23288% | |
| **Trend Scores & Views Are Only For Educational Purposes And Not For Investing | |
| 12Stocks.com: Top Performing Healthcare Sector Stocks | ||||||||||||||||||||||||||||||||||||||||||||||
 The top performing Healthcare sector stocks year to date are
Now, more recently, over last week, the top performing Healthcare sector stocks on the move are


|
||||||||||||||||||||||||||||||||||||||||||||||
| 12Stocks.com: Investing in Healthcare Sector using Exchange Traded Funds | |
|
The following table shows list of key exchange traded funds (ETF) that
help investors track Healthcare Index. For detailed view, check out our ETF Funds section of our website. Quick View: Move mouse or cursor over ETF symbol (ticker) to view short-term Technical chart and over ETF name to view long term chart. Click on ticker or stock name for detailed view. Click on to add stock symbol to your watchlist and to view watchlist. |
12Stocks.com List of ETFs that track Healthcare Index
| Ticker | ETF Name | Watchlist | Recent Price | Smart Investing & Trading Score | Change % | Week % | Year-to-date % |
| BTEC | Principal Healthcare Innovators | | 39.49 | 30 | 0 | 1.02328 | 0% |
| 12Stocks.com: Charts, Trends, Fundamental Data and Performances of Healthcare Stocks | |
|
We now take in-depth look at all Healthcare stocks including charts, multi-period performances and overall trends (as measured by Smart Investing & Trading Score). One can sort Healthcare stocks (click link to choose) by Daily, Weekly and by Year-to-Date performances. Also, one can sort by size of the company or by market capitalization. |
| Select Your Default Chart Type: | |||||
| |||||
| Click on stock symbol or name for detailed view. Click on to add stock symbol to your watchlist and to view watchlist. Quick View: Move mouse or cursor over "Daily" to quickly view daily Technical stock chart and over "Weekly" to view weekly Technical stock chart. | |||||

 | BAX Baxter International Inc |
| Sector: Health Care | |
| SubSector: Medical Instruments & Supplies | |
| MarketCap: 12542.6 Millions | |
| Recent Price: 23.99 Smart Investing & Trading Score: 10 | |
| Day Percent Change: -2.04165% Day Change: -0.48 | |
| Week Change: 1.73876% Year-to-date Change: -17.2% | |
| BAX Links: Profile News Message Board | |
| Charts:- Daily , Weekly | |
| Add BAX to Watchlist: View: Get Complete BAX Trend Analysis ➞ | |
 | LMAT Lemaitre Vascular Inc |
| Sector: Health Care | |
| SubSector: Medical Instruments & Supplies | |
| MarketCap: 2206.93 Millions | |
| Recent Price: 92.29 Smart Investing & Trading Score: 40 | |
| Day Percent Change: -2.05879% Day Change: -0.26 | |
| Week Change: -4.92428% Year-to-date Change: 1.4% | |
| LMAT Links: Profile News Message Board | |
| Charts:- Daily , Weekly | |
| Add LMAT to Watchlist: View: Get Complete LMAT Trend Analysis ➞ | |
 | LFST LifeStance Health Group Inc |
| Sector: Health Care | |
| SubSector: Medical Care Facilities | |
| MarketCap: 2088.59 Millions | |
| Recent Price: 5.23 Smart Investing & Trading Score: 30 | |
| Day Percent Change: -2.05993% Day Change: 0.15 | |
| Week Change: -4.38757% Year-to-date Change: -30.7% | |
| LFST Links: Profile News Message Board | |
| Charts:- Daily , Weekly | |
| Add LFST to Watchlist: View: Get Complete LFST Trend Analysis ➞ | |
 | TMDX Transmedics Group Inc |
| Sector: Health Care | |
| SubSector: Medical Devices | |
| MarketCap: 3545.74 Millions | |
| Recent Price: 114.56 Smart Investing & Trading Score: 60 | |
| Day Percent Change: -2.07283% Day Change: -3.07 | |
| Week Change: 10.1057% Year-to-date Change: 72.3% | |
| TMDX Links: Profile News Message Board | |
| Charts:- Daily , Weekly | |
| Add TMDX to Watchlist: View: Get Complete TMDX Trend Analysis ➞ | |
 | OPK Opko Health Inc |
| Sector: Health Care | |
| SubSector: Diagnostics & Research | |
| MarketCap: 1071.61 Millions | |
| Recent Price: 1.40 Smart Investing & Trading Score: 60 | |
| Day Percent Change: -2.0979% Day Change: -0.01 | |
| Week Change: 1.44928% Year-to-date Change: -3.4% | |
| OPK Links: Profile News Message Board | |
| Charts:- Daily , Weekly | |
| Add OPK to Watchlist: View: Get Complete OPK Trend Analysis ➞ | |
 | MASS 908 Devices Inc |
| Sector: Health Care | |
| SubSector: Medical Devices | |
| MarketCap: 196.31 Millions | |
| Recent Price: 5.60 Smart Investing & Trading Score: 10 | |
| Day Percent Change: -2.0979% Day Change: 0.04 | |
| Week Change: 1.81818% Year-to-date Change: 155.7% | |
| MASS Links: Profile News Message Board | |
| Charts:- Daily , Weekly | |
| Add MASS to Watchlist: View: Get Complete MASS Trend Analysis ➞ | |
 | USPH U.S. Physical Therapy, Inc |
| Sector: Health Care | |
| SubSector: Medical Care Facilities | |
| MarketCap: 1302.08 Millions | |
| Recent Price: 80.27 Smart Investing & Trading Score: 30 | |
| Day Percent Change: -2.12169% Day Change: 0.36 | |
| Week Change: -6.45612% Year-to-date Change: -7.6% | |
| USPH Links: Profile News Message Board | |
| Charts:- Daily , Weekly | |
| Add USPH to Watchlist: View: Get Complete USPH Trend Analysis ➞ | |
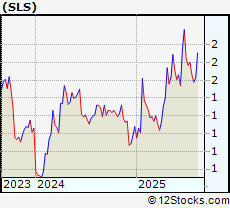 | SLS SELLAS Life Sciences Group Inc |
| Sector: Health Care | |
| SubSector: Biotechnology | |
| MarketCap: 201.12 Millions | |
| Recent Price: 1.85 Smart Investing & Trading Score: 30 | |
| Day Percent Change: -2.1164% Day Change: -0.09 | |
| Week Change: 3.93258% Year-to-date Change: 72.9% | |
| SLS Links: Profile News Message Board | |
| Charts:- Daily , Weekly | |
| Add SLS to Watchlist: View: Get Complete SLS Trend Analysis ➞ | |
 | CNMD Conmed Corp |
| Sector: Health Care | |
| SubSector: Medical Devices | |
| MarketCap: 1701.59 Millions | |
| Recent Price: 52.90 Smart Investing & Trading Score: 50 | |
| Day Percent Change: -2.12766% Day Change: -0.39 | |
| Week Change: -3.27299% Year-to-date Change: -20.9% | |
| CNMD Links: Profile News Message Board | |
| Charts:- Daily , Weekly | |
| Add CNMD to Watchlist: View: Get Complete CNMD Trend Analysis ➞ | |
 | LEGN Legend Biotech Corp ADR |
| Sector: Health Care | |
| SubSector: Biotechnology | |
| MarketCap: 6659.29 Millions | |
| Recent Price: 33.11 Smart Investing & Trading Score: 10 | |
| Day Percent Change: -2.12829% Day Change: -0.1 | |
| Week Change: -5.37296% Year-to-date Change: -4.7% | |
| LEGN Links: Profile News Message Board | |
| Charts:- Daily , Weekly | |
| Add LEGN to Watchlist: View: Get Complete LEGN Trend Analysis ➞ | |
 | NUVL Nuvalent Inc |
| Sector: Health Care | |
| SubSector: Biotechnology | |
| MarketCap: 5832.56 Millions | |
| Recent Price: 80.47 Smart Investing & Trading Score: 90 | |
| Day Percent Change: -2.12844% Day Change: 0.41 | |
| Week Change: 1.00414% Year-to-date Change: 0.6% | |
| NUVL Links: Profile News Message Board | |
| Charts:- Daily , Weekly | |
| Add NUVL to Watchlist: View: Get Complete NUVL Trend Analysis ➞ | |
 | VALN Valneva SE ADR |
| Sector: Health Care | |
| SubSector: Biotechnology | |
| MarketCap: 735.51 Millions | |
| Recent Price: 8.65 Smart Investing & Trading Score: 30 | |
| Day Percent Change: -2.14932% Day Change: -0.31 | |
| Week Change: -22.6988% Year-to-date Change: 83.3% | |
| VALN Links: Profile News Message Board | |
| Charts:- Daily , Weekly | |
| Add VALN to Watchlist: View: Get Complete VALN Trend Analysis ➞ | |
 | AMPH Amphastar Pharmaceuticals Inc |
| Sector: Health Care | |
| SubSector: Drug Manufacturers - Specialty & Generic | |
| MarketCap: 1367.89 Millions | |
| Recent Price: 28.06 Smart Investing & Trading Score: 30 | |
| Day Percent Change: -2.16179% Day Change: 0.04 | |
| Week Change: -3.87119% Year-to-date Change: -22.8% | |
| AMPH Links: Profile News Message Board | |
| Charts:- Daily , Weekly | |
| Add AMPH to Watchlist: View: Get Complete AMPH Trend Analysis ➞ | |
 | APLS Apellis Pharmaceuticals Inc |
| Sector: Health Care | |
| SubSector: Biotechnology | |
| MarketCap: 3552.54 Millions | |
| Recent Price: 24.85 Smart Investing & Trading Score: 30 | |
| Day Percent Change: -2.16535% Day Change: -0.4 | |
| Week Change: -13.2635% Year-to-date Change: -25.1% | |
| APLS Links: Profile News Message Board | |
| Charts:- Daily , Weekly | |
| Add APLS to Watchlist: View: Get Complete APLS Trend Analysis ➞ | |
 | MD Pediatrix Medical Group Inc |
| Sector: Health Care | |
| SubSector: Medical Care Facilities | |
| MarketCap: 1486.53 Millions | |
| Recent Price: 16.64 Smart Investing & Trading Score: 30 | |
| Day Percent Change: -2.17519% Day Change: -0.12 | |
| Week Change: -2.17519% Year-to-date Change: 27.7% | |
| MD Links: Profile News Message Board | |
| Charts:- Daily , Weekly | |
| Add MD to Watchlist: View: Get Complete MD Trend Analysis ➞ | |
 | MSLI Merus Labs International Inc. |
| Sector: Health Care | |
| SubSector: Drug Manufacturers - Other | |
| MarketCap: 109.34 Millions | |
| Recent Price: 31.79 Smart Investing & Trading Score: 20 | |
| Day Percent Change: -2.18462% Day Change: -9999 | |
| Week Change: -29.3556% Year-to-date Change: 0.0% | |
| MSLI Links: Profile News Message Board | |
| Charts:- Daily , Weekly | |
| Add MSLI to Watchlist: View: Get Complete MSLI Trend Analysis ➞ | |
 | ORGO Organogenesis Holdings Inc |
| Sector: Health Care | |
| SubSector: Drug Manufacturers - Specialty & Generic | |
| MarketCap: 634.29 Millions | |
| Recent Price: 4.93 Smart Investing & Trading Score: 60 | |
| Day Percent Change: -2.18254% Day Change: -0.11 | |
| Week Change: -1.98807% Year-to-date Change: 62.7% | |
| ORGO Links: Profile News Message Board | |
| Charts:- Daily , Weekly | |
| Add ORGO to Watchlist: View: Get Complete ORGO Trend Analysis ➞ | |
 | AVXL Anavex Life Sciences Corporation |
| Sector: Health Care | |
| SubSector: Biotechnology | |
| MarketCap: 807.4 Millions | |
| Recent Price: 9.37 Smart Investing & Trading Score: 10 | |
| Day Percent Change: -2.19207% Day Change: -0.13 | |
| Week Change: 0.106838% Year-to-date Change: -22.9% | |
| AVXL Links: Profile News Message Board | |
| Charts:- Daily , Weekly | |
| Add AVXL to Watchlist: View: Get Complete AVXL Trend Analysis ➞ | |
 | MIRM Mirum Pharmaceuticals Inc |
| Sector: Health Care | |
| SubSector: Biotechnology | |
| MarketCap: 3821.08 Millions | |
| Recent Price: 74.31 Smart Investing & Trading Score: 50 | |
| Day Percent Change: -2.21082% Day Change: 2.35 | |
| Week Change: 0.175249% Year-to-date Change: 76.8% | |
| MIRM Links: Profile News Message Board | |
| Charts:- Daily , Weekly | |
| Add MIRM to Watchlist: View: Get Complete MIRM Trend Analysis ➞ | |
 | AMGN AMGEN Inc |
| Sector: Health Care | |
| SubSector: Drug Manufacturers - General | |
| MarketCap: 152701 Millions | |
| Recent Price: 276.39 Smart Investing & Trading Score: 0 | |
| Day Percent Change: -2.24242% Day Change: -4.35 | |
| Week Change: -1.32453% Year-to-date Change: 8.4% | |
| AMGN Links: Profile News Message Board | |
| Charts:- Daily , Weekly | |
| Add AMGN to Watchlist: View: Get Complete AMGN Trend Analysis ➞ | |
 | BIOA BioAge Labs Inc |
| Sector: Health Care | |
| SubSector: Drug Manufacturers - Specialty & Generic | |
| MarketCap: 170.65 Millions | |
| Recent Price: 4.80 Smart Investing & Trading Score: 50 | |
| Day Percent Change: -2.24033% Day Change: 0.06 | |
| Week Change: 1.91083% Year-to-date Change: -13.7% | |
| BIOA Links: Profile News Message Board | |
| Charts:- Daily , Weekly | |
| Add BIOA to Watchlist: View: Get Complete BIOA Trend Analysis ➞ | |
 | CEMI Chembio Diagnostics, Inc. |
| Sector: Health Care | |
| SubSector: Diagnostic Substances | |
| MarketCap: 70.6671 Millions | |
| Recent Price: 53.90 Smart Investing & Trading Score: 80 | |
| Day Percent Change: -2.24882% Day Change: -9999 | |
| Week Change: 11746.2% Year-to-date Change: 0.0% | |
| CEMI Links: Profile News Message Board | |
| Charts:- Daily , Weekly | |
| Add CEMI to Watchlist: View: Get Complete CEMI Trend Analysis ➞ | |
 | ARQT Arcutis Biotherapeutics Inc |
| Sector: Health Care | |
| SubSector: Biotechnology | |
| MarketCap: 2056.37 Millions | |
| Recent Price: 17.29 Smart Investing & Trading Score: 60 | |
| Day Percent Change: -2.26116% Day Change: 0 | |
| Week Change: 6.66255% Year-to-date Change: 18.8% | |
| ARQT Links: Profile News Message Board | |
| Charts:- Daily , Weekly | |
| Add ARQT to Watchlist: View: Get Complete ARQT Trend Analysis ➞ | |
 | ONCY Oncolytics Biotech, Inc |
| Sector: Health Care | |
| SubSector: Biotechnology | |
| MarketCap: 107.32 Millions | |
| Recent Price: 1.28 Smart Investing & Trading Score: 80 | |
| Day Percent Change: -2.29008% Day Change: 0 | |
| Week Change: 18.5185% Year-to-date Change: 37.7% | |
| ONCY Links: Profile News Message Board | |
| Charts:- Daily , Weekly | |
| Add ONCY to Watchlist: View: Get Complete ONCY Trend Analysis ➞ | |
 | ROIV Roivant Sciences Ltd |
| Sector: Health Care | |
| SubSector: Biotechnology | |
| MarketCap: 8822.83 Millions | |
| Recent Price: 14.08 Smart Investing & Trading Score: 90 | |
| Day Percent Change: -2.29008% Day Change: 0.09 | |
| Week Change: 12.0127% Year-to-date Change: 16.6% | |
| ROIV Links: Profile News Message Board | |
| Charts:- Daily , Weekly | |
| Add ROIV to Watchlist: View: Get Complete ROIV Trend Analysis ➞ | |
| For tabular summary view of above stock list: Summary View ➞ 0 - 25 , 25 - 50 , 50 - 75 , 75 - 100 , 100 - 125 , 125 - 150 , 150 - 175 , 175 - 200 , 200 - 225 , 225 - 250 , 250 - 275 , 275 - 300 , 300 - 325 , 325 - 350 , 350 - 375 , 375 - 400 , 400 - 425 , 425 - 450 , 450 - 475 , 475 - 500 , 500 - 525 , 525 - 550 , 550 - 575 , 575 - 600 , 600 - 625 , 625 - 650 , 650 - 675 , 675 - 700 , 700 - 725 , 725 - 750 , 750 - 775 , 775 - 800 , 800 - 825 , 825 - 850 , 850 - 875 , 875 - 900 , 900 - 925 , 925 - 950 , 950 - 975 , 975 - 1000 | ||
| Click To Change The Sort Order: By Market Cap or Company Size Performance: Year-to-date, Week and Day | |
| Select Chart Type: | ||
|
Best Stocks Today 12Stocks.com |
© 2025 12Stocks.com Terms & Conditions Privacy Contact Us
All Information Provided Only For Education And Not To Be Used For Investing or Trading. See Terms & Conditions


One More Thing ... Get Best Stocks Delivered Daily!
Never Ever Miss A Move With Our Top Ten Stocks Lists
Find Best Stocks In Any Market - Bull or Bear Market
Take A Peek At Our Top Ten Stocks Lists: Daily, Weekly, Year-to-Date & Top Trends
Find Best Stocks In Any Market - Bull or Bear Market
Take A Peek At Our Top Ten Stocks Lists: Daily, Weekly, Year-to-Date & Top Trends
Healthcare Stocks With Best Up Trends [0-bearish to 100-bullish]: AlloVir [100], Cara [100], Spruce Biosciences[100], Kala Bio[100], Protalix Bio[100], Microbot [100], Kindred [100], Lineage Cell[100], Scilex Holding[100], Immuneering Corp[100], RAPT [100]
Best Healthcare Stocks Year-to-Date:
Regencell Bioscience[11493.1%], Kaleido BioSciences[9900%], Eagle [664.286%], So-Young [375.53%], Galectin [358.974%], I-Mab ADR[351.435%], Celcuity [318.203%], Immuneering Corp[284.163%], Biosig Technologies[270%], Gossamer Bio[256.701%], Microbot [255.263%] Best Healthcare Stocks This Week:
Athersys [193287%], Nobilis Health[101349%], VBI Vaccines[86898.5%], ContraFect [47677.8%], Clovis Oncology[39610.5%], Endo [28369.6%], NanoString Technologies[17224.7%], Neptune Wellness[14100%], ViewRay [11470.2%], Mallkrodt [11382.1%], Achillion [10033.3%] Best Healthcare Stocks Daily:
Kaleido BioSciences[9900%], Neoleukin [332.665%], Syros [226.23%], Athenex [103.333%], Accelerate Diagnostics[17.6471%], Aptose Biosciences[17.5439%], AlloVir [16.9215%], China SXT[15.1163%], Cara [14.3396%], Tyra Biosciences[14.26%], Prenetics Global[13.7133%]