
 Login Sign Up


| |||||
 |  | ||||

| 12Stocks.com Market Intelligence |
Best Healthcare Stocks
 | "Discover best trending healthcare stocks with 12Stocks.com." |
| - Subu Vdaygiri, Founder, 12Stocks.com |
| In a hurry? Healthcare Stocks Lists: Performance Trends Table, Stock Charts
Sort Healthcare stocks: Daily, Weekly, Year-to-Date, Market Cap & Trends. Filter Healthcare stocks list by size:All Healthcare Large Mid-Range Small |
| 12Stocks.com Healthcare Stocks Performances & Trends Daily | |||||||||
|
|  The overall Smart Investing & Trading Score is 70 (0-bearish to 100-bullish) which puts Healthcare sector in short term neutral to bullish trend. The Smart Investing & Trading Score from previous trading session is 90 and hence a deterioration of trend.
| ||||||||
Here are the Smart Investing & Trading Scores of the most requested Healthcare stocks at 12Stocks.com (click stock name for detailed review):
|


| 12Stocks.com: Investing in Healthcare sector with Stocks | |
|
The following table helps investors and traders sort through current performance and trends (as measured by Smart Investing & Trading Score) of various
stocks in the Healthcare sector. Quick View: Move mouse or cursor over stock symbol (ticker) to view short-term Technical chart and over stock name to view long term chart. Click on  to add stock symbol to your watchlist and to add stock symbol to your watchlist and  to view watchlist. Click on any ticker or stock name for detailed market intelligence report for that stock. to view watchlist. Click on any ticker or stock name for detailed market intelligence report for that stock. |
12Stocks.com Performance of Stocks in Healthcare Sector
| Ticker | Stock Name | Watchlist | Category | Recent Price | Smart Investing & Trading Score | Change % | YTD Change% |
| JAZZ | Jazz |   | Biotechnology | 126.16 | 40 | -1.79 | 1.94% |
| IQV | IQVIA | | Diagnostics & Research | 187.22 | 40 | -1.82 | -4.05% |
| PHAT | Phathom | | Biotechnology | 11.84 | 40 | -1.82 | 61.53% |
| WRBY | Warby Parker | | Instruments | 26.75 | 68 | -1.84 | 7.68% |
| SRTS | Sensus | | Medical Devices | 3.18 | 0 | -1.85 | -55.21% |
| AGEN | Agenus | | Biotechnology | 4.74 | 70 | -1.86 | 53.40% |
| ADUS | Addus HomeCare | | Medical Care Facilities | 110.27 | 10 | -1.88 | -11.26% |
| TARA | Protara | | Biotechnology | 3.14 | 60 | -1.88 | -43.73% |
| BFLY | Butterfly Network | | Medical Devices | 1.55 | 40 | -1.90 | -60.96% |
| IPCI | IntelliPharmaCeutics | | Delivery | 121.30 | 30 | -1.90 | 0.00% |
| ALHC | Alignment | | Healthcare Plans | 16.04 | 70 | -1.90 | 38.75% |
| AZN | Astrazeneca | | Drug Manufacturers - General | 79.55 | 40 | -1.91 | 23.28% |
| OBIO | Orchestra BioMed | | Biotechnology | 2.57 | 20 | -1.91 | -52.23% |
| BIO | Bio-Rad | | Medical Devices | 280.34 | 30 | -1.94 | -14.05% |
| CRON | Cronos | | Drug Manufacturers - Specialty & Generic | 2.53 | 50 | -1.94 | 22.82% |
| BDX | Becton Dickinson | | Instruments | 186.84 | 30 | -1.95 | -16.63% |
| SNN | Smith & Nephew ADR | | Medical Devices | 37.78 | 50 | -1.95 | 57.40% |
| LIVN | LivaNova | | Medical Devices | 56.22 | 50 | -1.95 | 20.51% |
| VNDA | Vanda | | Biotechnology | 4.51 | 0 | -1.96 | -6.43% |
| CORT | Corcept | | Biotechnology | 72.87 | 70 | -1.96 | 45.83% |
| IPHA | Innate Pharma | | Biotechnology | 2.00 | 30 | -1.96 | 6.95% |
| BCRX | Biocryst | | Drug Manufacturers - Specialty & Generic | 7.91 | 0 | -1.98 | 1.02% |
| CYH | Community Health | | Medical Care Facilities | 2.94 | 70 | -2.00 | -4.23% |
| HUMA | Humacyte | | Biotechnology | 1.47 | 40 | -2.00 | -71.62% |
| VMD | Viemed | | Medical Devices | 6.78 | 60 | -2.02 | -16.61% |
| For chart view version of above stock list: Chart View ➞ 0 - 25 , 25 - 50 , 50 - 75 , 75 - 100 , 100 - 125 , 125 - 150 , 150 - 175 , 175 - 200 , 200 - 225 , 225 - 250 , 250 - 275 , 275 - 300 , 300 - 325 , 325 - 350 , 350 - 375 , 375 - 400 , 400 - 425 , 425 - 450 , 450 - 475 , 475 - 500 , 500 - 525 , 525 - 550 , 550 - 575 , 575 - 600 , 600 - 625 , 625 - 650 , 650 - 675 , 675 - 700 , 700 - 725 , 725 - 750 , 750 - 775 , 775 - 800 , 800 - 825 , 825 - 850 , 850 - 875 , 875 - 900 , 900 - 925 , 925 - 950 , 950 - 975 , 975 - 1000 | ||
 | Click To Change The Sort Order: By Market Cap or Company Size Performance: Year-to-date, Week and Day |  |
|
Get the most comprehensive stock market coverage daily at 12Stocks.com ➞ Best Stocks Today ➞ Best Stocks Weekly ➞ Best Stocks Year-to-Date ➞ Best Stocks Trends ➞  Best Stocks Today 12Stocks.com Best Nasdaq Stocks ➞ Best S&P 500 Stocks ➞ Best Tech Stocks ➞ Best Biotech Stocks ➞ |
| Detailed Overview of Healthcare Stocks |
| Healthcare Technical Overview, Leaders & Laggards, Top Healthcare ETF Funds & Detailed Healthcare Stocks List, Charts, Trends & More |
| Healthcare Sector: Technical Analysis, Trends & YTD Performance | |
| Healthcare sector is composed of stocks
from pharmaceutical, biotech, diagnostics labs, insurance providers
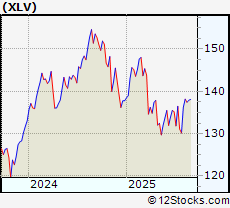
and healthcare services. Healthcare sector, as represented by XLV, an exchange-traded fund [ETF] that holds basket of Healthcare stocks (e.g, Merck, Amgen) is up by 1.23288% and is currently underperforming the overall market by -11.61812% year-to-date. Below is a quick view of Technical charts and trends: |
|
 XLV Weekly Chart |
|
| Long Term Trend: Very Good | |
| Medium Term Trend: Deteriorating | |
 XLV Daily Chart |
|
| Short Term Trend: Not Good | |
| Overall Trend Score: 70 | |
| YTD Performance: 1.23288% | |
| **Trend Scores & Views Are Only For Educational Purposes And Not For Investing | |
| 12Stocks.com: Top Performing Healthcare Sector Stocks | ||||||||||||||||||||||||||||||||||||||||||||||
 The top performing Healthcare sector stocks year to date are
Now, more recently, over last week, the top performing Healthcare sector stocks on the move are


|
||||||||||||||||||||||||||||||||||||||||||||||
| 12Stocks.com: Investing in Healthcare Sector using Exchange Traded Funds | |
|
The following table shows list of key exchange traded funds (ETF) that
help investors track Healthcare Index. For detailed view, check out our ETF Funds section of our website. Quick View: Move mouse or cursor over ETF symbol (ticker) to view short-term Technical chart and over ETF name to view long term chart. Click on ticker or stock name for detailed view. Click on to add stock symbol to your watchlist and to view watchlist. |
12Stocks.com List of ETFs that track Healthcare Index
| Ticker | ETF Name | Watchlist | Recent Price | Smart Investing & Trading Score | Change % | Week % | Year-to-date % |
| BTEC | Principal Healthcare Innovators | | 39.49 | 30 | 0 | 1.02328 | 0% |
| 12Stocks.com: Charts, Trends, Fundamental Data and Performances of Healthcare Stocks | |
|
We now take in-depth look at all Healthcare stocks including charts, multi-period performances and overall trends (as measured by Smart Investing & Trading Score). One can sort Healthcare stocks (click link to choose) by Daily, Weekly and by Year-to-Date performances. Also, one can sort by size of the company or by market capitalization. |
| Select Your Default Chart Type: | |||||
| |||||
| Click on stock symbol or name for detailed view. Click on to add stock symbol to your watchlist and to view watchlist. Quick View: Move mouse or cursor over "Daily" to quickly view daily Technical stock chart and over "Weekly" to view weekly Technical stock chart. | |||||

 | JAZZ Jazz Pharmaceuticals plc |
| Sector: Health Care | |
| SubSector: Biotechnology | |
| MarketCap: 7855.32 Millions | |
| Recent Price: 126.16 Smart Investing & Trading Score: 40 | |
| Day Percent Change: -1.79044% Day Change: -1.55 | |
| Week Change: -1.4529% Year-to-date Change: 1.9% | |
| JAZZ Links: Profile News Message Board | |
| Charts:- Daily , Weekly | |
| Add JAZZ to Watchlist: View: Get Complete JAZZ Trend Analysis ➞ | |
 | IQV IQVIA Holdings Inc |
| Sector: Health Care | |
| SubSector: Diagnostics & Research | |
| MarketCap: 31905.6 Millions | |
| Recent Price: 187.22 Smart Investing & Trading Score: 40 | |
| Day Percent Change: -1.81971% Day Change: -2.6 | |
| Week Change: 1.70578% Year-to-date Change: -4.0% | |
| IQV Links: Profile News Message Board | |
| Charts:- Daily , Weekly | |
| Add IQV to Watchlist: View: Get Complete IQV Trend Analysis ➞ | |
 | PHAT Phathom Pharmaceuticals Inc |
| Sector: Health Care | |
| SubSector: Biotechnology | |
| MarketCap: 875.45 Millions | |
| Recent Price: 11.84 Smart Investing & Trading Score: 40 | |
| Day Percent Change: -1.82421% Day Change: 0.32 | |
| Week Change: -1.33333% Year-to-date Change: 61.5% | |
| PHAT Links: Profile News Message Board | |
| Charts:- Daily , Weekly | |
| Add PHAT to Watchlist: View: Get Complete PHAT Trend Analysis ➞ | |
 | WRBY Warby Parker Inc |
| Sector: Health Care | |
| SubSector: Medical Instruments & Supplies | |
| MarketCap: 3173.36 Millions | |
| Recent Price: 26.75 Smart Investing & Trading Score: 68 | |
| Day Percent Change: -1.84% Day Change: -0.49 | |
| Week Change: -2.91% Year-to-date Change: 7.7% | |
| WRBY Links: Profile News Message Board | |
| Charts:- Daily , Weekly | |
| Add WRBY to Watchlist: View: Get Complete WRBY Trend Analysis ➞ | |
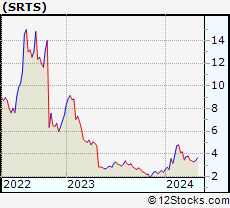 | SRTS Sensus Healthcare Inc |
| Sector: Health Care | |
| SubSector: Medical Devices | |
| MarketCap: 53.1 Millions | |
| Recent Price: 3.18 Smart Investing & Trading Score: 0 | |
| Day Percent Change: -1.85185% Day Change: 0.03 | |
| Week Change: 0% Year-to-date Change: -55.2% | |
| SRTS Links: Profile News Message Board | |
| Charts:- Daily , Weekly | |
| Add SRTS to Watchlist: View: Get Complete SRTS Trend Analysis ➞ | |
 | AGEN Agenus Inc |
| Sector: Health Care | |
| SubSector: Biotechnology | |
| MarketCap: 137.97 Millions | |
| Recent Price: 4.74 Smart Investing & Trading Score: 70 | |
| Day Percent Change: -1.86335% Day Change: 0.06 | |
| Week Change: 11.2676% Year-to-date Change: 53.4% | |
| AGEN Links: Profile News Message Board | |
| Charts:- Daily , Weekly | |
| Add AGEN to Watchlist: View: Get Complete AGEN Trend Analysis ➞ | |
 | ADUS Addus HomeCare Corporation |
| Sector: Health Care | |
| SubSector: Medical Care Facilities | |
| MarketCap: 2084.07 Millions | |
| Recent Price: 110.27 Smart Investing & Trading Score: 10 | |
| Day Percent Change: -1.87756% Day Change: -0.67 | |
| Week Change: -1.41261% Year-to-date Change: -11.3% | |
| ADUS Links: Profile News Message Board | |
| Charts:- Daily , Weekly | |
| Add ADUS to Watchlist: View: Get Complete ADUS Trend Analysis ➞ | |
 | TARA Protara Therapeutics Inc |
| Sector: Health Care | |
| SubSector: Biotechnology | |
| MarketCap: 121.53 Millions | |
| Recent Price: 3.14 Smart Investing & Trading Score: 60 | |
| Day Percent Change: -1.875% Day Change: 0.07 | |
| Week Change: -0.946372% Year-to-date Change: -43.7% | |
| TARA Links: Profile News Message Board | |
| Charts:- Daily , Weekly | |
| Add TARA to Watchlist: View: Get Complete TARA Trend Analysis ➞ | |
 | BFLY Butterfly Network Inc |
| Sector: Health Care | |
| SubSector: Medical Devices | |
| MarketCap: 392.72 Millions | |
| Recent Price: 1.55 Smart Investing & Trading Score: 40 | |
| Day Percent Change: -1.89873% Day Change: -0.02 | |
| Week Change: 0.649351% Year-to-date Change: -61.0% | |
| BFLY Links: Profile News Message Board | |
| Charts:- Daily , Weekly | |
| Add BFLY to Watchlist: View: Get Complete BFLY Trend Analysis ➞ | |
 | IPCI IntelliPharmaCeutics International Inc. |
| Sector: Health Care | |
| SubSector: Drug Delivery | |
| MarketCap: 72.59 Millions | |
| Recent Price: 121.30 Smart Investing & Trading Score: 30 | |
| Day Percent Change: -1.90053% Day Change: -9999 | |
| Week Change: -13.0092% Year-to-date Change: 0.0% | |
| IPCI Links: Profile News Message Board | |
| Charts:- Daily , Weekly | |
| Add IPCI to Watchlist: View: Get Complete IPCI Trend Analysis ➞ | |
 | ALHC Alignment Healthcare Inc |
| Sector: Health Care | |
| SubSector: Healthcare Plans | |
| MarketCap: 3140.78 Millions | |
| Recent Price: 16.04 Smart Investing & Trading Score: 70 | |
| Day Percent Change: -1.89602% Day Change: 0.78 | |
| Week Change: -1.59509% Year-to-date Change: 38.8% | |
| ALHC Links: Profile News Message Board | |
| Charts:- Daily , Weekly | |
| Add ALHC to Watchlist: View: Get Complete ALHC Trend Analysis ➞ | |
 | AZN Astrazeneca plc ADR |
| Sector: Health Care | |
| SubSector: Drug Manufacturers - General | |
| MarketCap: 253309 Millions | |
| Recent Price: 79.55 Smart Investing & Trading Score: 40 | |
| Day Percent Change: -1.90999% Day Change: -1.45 | |
| Week Change: -2.72561% Year-to-date Change: 23.3% | |
| AZN Links: Profile News Message Board | |
| Charts:- Daily , Weekly | |
| Add AZN to Watchlist: View: Get Complete AZN Trend Analysis ➞ | |
 | OBIO Orchestra BioMed Holdings Inc |
| Sector: Health Care | |
| SubSector: Biotechnology | |
| MarketCap: 148.38 Millions | |
| Recent Price: 2.57 Smart Investing & Trading Score: 20 | |
| Day Percent Change: -1.9084% Day Change: 0.06 | |
| Week Change: -6.20438% Year-to-date Change: -52.2% | |
| OBIO Links: Profile News Message Board | |
| Charts:- Daily , Weekly | |
| Add OBIO to Watchlist: View: Get Complete OBIO Trend Analysis ➞ | |
 | BIO Bio-Rad Laboratories Inc |
| Sector: Health Care | |
| SubSector: Medical Devices | |
| MarketCap: 7998.24 Millions | |
| Recent Price: 280.34 Smart Investing & Trading Score: 30 | |
| Day Percent Change: -1.94474% Day Change: -4.91 | |
| Week Change: -3.14066% Year-to-date Change: -14.0% | |
| BIO Links: Profile News Message Board | |
| Charts:- Daily , Weekly | |
| Add BIO to Watchlist: View: Get Complete BIO Trend Analysis ➞ | |
 | CRON Cronos Group Inc |
| Sector: Health Care | |
| SubSector: Drug Manufacturers - Specialty & Generic | |
| MarketCap: 957.35 Millions | |
| Recent Price: 2.53 Smart Investing & Trading Score: 50 | |
| Day Percent Change: -1.93798% Day Change: 0.14 | |
| Week Change: 1.2% Year-to-date Change: 22.8% | |
| CRON Links: Profile News Message Board | |
| Charts:- Daily , Weekly | |
| Add CRON to Watchlist: View: Get Complete CRON Trend Analysis ➞ | |
 | BDX Becton Dickinson & Co |
| Sector: Health Care | |
| SubSector: Medical Instruments & Supplies | |
| MarketCap: 55144.3 Millions | |
| Recent Price: 186.84 Smart Investing & Trading Score: 30 | |
| Day Percent Change: -1.95214% Day Change: -2.96 | |
| Week Change: -2.31099% Year-to-date Change: -16.6% | |
| BDX Links: Profile News Message Board | |
| Charts:- Daily , Weekly | |
| Add BDX to Watchlist: View: Get Complete BDX Trend Analysis ➞ | |
 | SNN Smith & Nephew plc ADR |
| Sector: Health Care | |
| SubSector: Medical Devices | |
| MarketCap: 16598.5 Millions | |
| Recent Price: 37.78 Smart Investing & Trading Score: 50 | |
| Day Percent Change: -1.94654% Day Change: -0.44 | |
| Week Change: 0.371945% Year-to-date Change: 57.4% | |
| SNN Links: Profile News Message Board | |
| Charts:- Daily , Weekly | |
| Add SNN to Watchlist: View: Get Complete SNN Trend Analysis ➞ | |
 | LIVN LivaNova PLC |
| Sector: Health Care | |
| SubSector: Medical Devices | |
| MarketCap: 3165.22 Millions | |
| Recent Price: 56.22 Smart Investing & Trading Score: 50 | |
| Day Percent Change: -1.95326% Day Change: -0.53 | |
| Week Change: -3.319% Year-to-date Change: 20.5% | |
| LIVN Links: Profile News Message Board | |
| Charts:- Daily , Weekly | |
| Add LIVN to Watchlist: View: Get Complete LIVN Trend Analysis ➞ | |
 | VNDA Vanda Pharmaceuticals Inc |
| Sector: Health Care | |
| SubSector: Biotechnology | |
| MarketCap: 272.4 Millions | |
| Recent Price: 4.51 Smart Investing & Trading Score: 0 | |
| Day Percent Change: -1.95652% Day Change: -0.09 | |
| Week Change: -2.80172% Year-to-date Change: -6.4% | |
| VNDA Links: Profile News Message Board | |
| Charts:- Daily , Weekly | |
| Add VNDA to Watchlist: View: Get Complete VNDA Trend Analysis ➞ | |
 | CORT Corcept Therapeutics Inc |
| Sector: Health Care | |
| SubSector: Biotechnology | |
| MarketCap: 7308.58 Millions | |
| Recent Price: 72.87 Smart Investing & Trading Score: 70 | |
| Day Percent Change: -1.96421% Day Change: 0.58 | |
| Week Change: 5.04541% Year-to-date Change: 45.8% | |
| CORT Links: Profile News Message Board | |
| Charts:- Daily , Weekly | |
| Add CORT to Watchlist: View: Get Complete CORT Trend Analysis ➞ | |
 | IPHA Innate Pharma ADR |
| Sector: Health Care | |
| SubSector: Biotechnology | |
| MarketCap: 188.92 Millions | |
| Recent Price: 2.00 Smart Investing & Trading Score: 30 | |
| Day Percent Change: -1.96078% Day Change: 0 | |
| Week Change: -4.58015% Year-to-date Change: 7.0% | |
| IPHA Links: Profile News Message Board | |
| Charts:- Daily , Weekly | |
| Add IPHA to Watchlist: View: Get Complete IPHA Trend Analysis ➞ | |
 | BCRX Biocryst Pharmaceuticals Inc |
| Sector: Health Care | |
| SubSector: Drug Manufacturers - Specialty & Generic | |
| MarketCap: 1736.04 Millions | |
| Recent Price: 7.91 Smart Investing & Trading Score: 0 | |
| Day Percent Change: -1.98265% Day Change: 0 | |
| Week Change: -4.35308% Year-to-date Change: 1.0% | |
| BCRX Links: Profile News Message Board | |
| Charts:- Daily , Weekly | |
| Add BCRX to Watchlist: View: Get Complete BCRX Trend Analysis ➞ | |
 | CYH Community Health Systems, Inc |
| Sector: Health Care | |
| SubSector: Medical Care Facilities | |
| MarketCap: 409.15 Millions | |
| Recent Price: 2.94 Smart Investing & Trading Score: 70 | |
| Day Percent Change: -2% Day Change: -0.04 | |
| Week Change: 3.52113% Year-to-date Change: -4.2% | |
| CYH Links: Profile News Message Board | |
| Charts:- Daily , Weekly | |
| Add CYH to Watchlist: View: Get Complete CYH Trend Analysis ➞ | |
 | HUMA Humacyte Inc |
| Sector: Health Care | |
| SubSector: Biotechnology | |
| MarketCap: 226.47 Millions | |
| Recent Price: 1.47 Smart Investing & Trading Score: 40 | |
| Day Percent Change: -2% Day Change: -0.09 | |
| Week Change: 0.684932% Year-to-date Change: -71.6% | |
| HUMA Links: Profile News Message Board | |
| Charts:- Daily , Weekly | |
| Add HUMA to Watchlist: View: Get Complete HUMA Trend Analysis ➞ | |
 | VMD Viemed Healthcare Inc |
| Sector: Health Care | |
| SubSector: Medical Devices | |
| MarketCap: 266.85 Millions | |
| Recent Price: 6.78 Smart Investing & Trading Score: 60 | |
| Day Percent Change: -2.02312% Day Change: 0.19 | |
| Week Change: -0.58651% Year-to-date Change: -16.6% | |
| VMD Links: Profile News Message Board | |
| Charts:- Daily , Weekly | |
| Add VMD to Watchlist: View: Get Complete VMD Trend Analysis ➞ | |
| For tabular summary view of above stock list: Summary View ➞ 0 - 25 , 25 - 50 , 50 - 75 , 75 - 100 , 100 - 125 , 125 - 150 , 150 - 175 , 175 - 200 , 200 - 225 , 225 - 250 , 250 - 275 , 275 - 300 , 300 - 325 , 325 - 350 , 350 - 375 , 375 - 400 , 400 - 425 , 425 - 450 , 450 - 475 , 475 - 500 , 500 - 525 , 525 - 550 , 550 - 575 , 575 - 600 , 600 - 625 , 625 - 650 , 650 - 675 , 675 - 700 , 700 - 725 , 725 - 750 , 750 - 775 , 775 - 800 , 800 - 825 , 825 - 850 , 850 - 875 , 875 - 900 , 900 - 925 , 925 - 950 , 950 - 975 , 975 - 1000 | ||
| Click To Change The Sort Order: By Market Cap or Company Size Performance: Year-to-date, Week and Day | |
| Select Chart Type: | ||
|
Best Stocks Today 12Stocks.com |
© 2025 12Stocks.com Terms & Conditions Privacy Contact Us
All Information Provided Only For Education And Not To Be Used For Investing or Trading. See Terms & Conditions


One More Thing ... Get Best Stocks Delivered Daily!
Never Ever Miss A Move With Our Top Ten Stocks Lists
Find Best Stocks In Any Market - Bull or Bear Market
Take A Peek At Our Top Ten Stocks Lists: Daily, Weekly, Year-to-Date & Top Trends
Find Best Stocks In Any Market - Bull or Bear Market
Take A Peek At Our Top Ten Stocks Lists: Daily, Weekly, Year-to-Date & Top Trends
Healthcare Stocks With Best Up Trends [0-bearish to 100-bullish]: AlloVir [100], Cara [100], Spruce Biosciences[100], Kala Bio[100], Protalix Bio[100], Microbot [100], Kindred [100], Lineage Cell[100], Scilex Holding[100], Immuneering Corp[100], RAPT [100]
Best Healthcare Stocks Year-to-Date:
Regencell Bioscience[11493.1%], Kaleido BioSciences[9900%], Eagle [664.286%], So-Young [375.53%], Galectin [358.974%], I-Mab ADR[351.435%], Celcuity [318.203%], Immuneering Corp[284.163%], Biosig Technologies[270%], Gossamer Bio[256.701%], Microbot [255.263%] Best Healthcare Stocks This Week:
Athersys [193287%], Nobilis Health[101349%], VBI Vaccines[86898.5%], ContraFect [47677.8%], Clovis Oncology[39610.5%], Endo [28369.6%], NanoString Technologies[17224.7%], Neptune Wellness[14100%], ViewRay [11470.2%], Mallkrodt [11382.1%], Achillion [10033.3%] Best Healthcare Stocks Daily:
Kaleido BioSciences[9900%], Neoleukin [332.665%], Syros [226.23%], Athenex [103.333%], Accelerate Diagnostics[17.6471%], Aptose Biosciences[17.5439%], AlloVir [16.9215%], China SXT[15.1163%], Cara [14.3396%], Tyra Biosciences[14.26%], Prenetics Global[13.7133%]