
 Login Sign Up


| |||||
 |  | ||||

| 12Stocks.com Market Intelligence |
Best Healthcare Stocks
 | "Discover best trending healthcare stocks with 12Stocks.com." |
| - Subu Vdaygiri, Founder, 12Stocks.com |
| In a hurry? Healthcare Stocks Lists: Performance Trends Table, Stock Charts
Sort Healthcare stocks: Daily, Weekly, Year-to-Date, Market Cap & Trends. Filter Healthcare stocks list by size:All Healthcare Large Mid-Range Small |
| 12Stocks.com Healthcare Stocks Performances & Trends Daily | |||||||||
|
|  The overall Smart Investing & Trading Score is 40 (0-bearish to 100-bullish) which puts Healthcare sector in short term bearish to neutral trend. The Smart Investing & Trading Score from previous trading session is 60 and a deterioration of trend continues.
| ||||||||
Here are the Smart Investing & Trading Scores of the most requested Healthcare stocks at 12Stocks.com (click stock name for detailed review):
|


| 12Stocks.com: Investing in Healthcare sector with Stocks | |
|
The following table helps investors and traders sort through current performance and trends (as measured by Smart Investing & Trading Score) of various
stocks in the Healthcare sector. Quick View: Move mouse or cursor over stock symbol (ticker) to view short-term Technical chart and over stock name to view long term chart. Click on  to add stock symbol to your watchlist and to add stock symbol to your watchlist and  to view watchlist. Click on any ticker or stock name for detailed market intelligence report for that stock. to view watchlist. Click on any ticker or stock name for detailed market intelligence report for that stock. |
12Stocks.com Performance of Stocks in Healthcare Sector
| Ticker | Stock Name | Watchlist | Category | Recent Price | Smart Investing & Trading Score | Change % | YTD Change% |
| OXFD | Oxford Immunotec |   | Diagnostic | 11.13 | 20 | 0.54% | 0.00% |
| MREO | Mereo Biopharma | | Biotechnology | 1.76 | 50 | -4.86% | -48.54% |
| LCTX | Lineage Cell | | Biotechnology | 1.35 | 90 | 0.75% | 162.14% |
| SLP | Simulations Plus | | Health Information | 14.68 | 90 | -2.46% | -47.40% |
| GRTX | Galera | | Biotechnology | 0.02 | 30 | 0.44% | -43.64% |
| ACB | Aurora Cannabis | | Drug Manufacturers - Specialty & Generic | 4.97 | 30 | 2.05% | 10.44% |
| IKNA | Ikena Oncology | | Biotechnology | 17.16 | 80 | 4.38% | -13.33% |
| SYRS | Syros | | Biotechnology | 0.02 | 70 | 226.23% | -91.35% |
| ARA | American Renal | | Laboratories | 34.64 | 40 | -1.11% | 0.00% |
| MNPR | Monopar | | Biotechnology | 54.49 | 100 | 10.71% | 145.23% |
| VNDA | Vanda | | Biotechnology | 4.38 | 0 | -2.88% | -9.13% |
| SLN | Silence | | Biotechnology | 4.73 | 10 | 4.88% | -34.21% |
| MGTA | Magenta | | Biotechnology | 0.70 | 10 | 0.00% | 0.00% |
| AVIR | Atea | | Biotechnology | 3.04 | 0 | -3.18% | -11.11% |
| VMD | Viemed | | Medical Devices | 6.76 | 40 | -0.29% | -16.85% |
| HIIQ | Health Insurance | | Insurance | 14.46 | 20 | 0.35% | 0.00% |
| STXS | Stereotaxis | | Instruments | 2.82 | 40 | -1.05% | 23.14% |
| PFNX | Pfenex | | Biotechnology | 10.21 | 10 | -6.93% | 0.00% |
| PGNX | Progenics | | Biotechnology | 31.11 | 70 | -2.63% | 0.00% |
| CNCE | Concert | | Biotechnology | 13.68 | 100 | 0.96% | 0.00% |
| PRQR | ProQR | | Biotechnology | 1.99 | 10 | -9.36% | -27.55% |
| ALLO | Allogene | | Biotechnology | 1.15 | 70 | 1.77% | -47.73% |
| UBX | Unity Biotechnology | | Biotechnology | 0.16 | 0 | -20.04% | -85.96% |
| CERS | Cerus Corp | | Medical Devices | 1.20 | 10 | -2.44% | -23.57% |
| PBYI | Puma Biotechnology | | Biotechnology | 4.64 | 70 | 3.80% | 48.72% |
| For chart view version of above stock list: Chart View ➞ 0 - 25 , 25 - 50 , 50 - 75 , 75 - 100 , 100 - 125 , 125 - 150 , 150 - 175 , 175 - 200 , 200 - 225 , 225 - 250 , 250 - 275 , 275 - 300 , 300 - 325 , 325 - 350 , 350 - 375 , 375 - 400 , 400 - 425 , 425 - 450 , 450 - 475 , 475 - 500 , 500 - 525 , 525 - 550 , 550 - 575 , 575 - 600 , 600 - 625 , 625 - 650 , 650 - 675 , 675 - 700 , 700 - 725 , 725 - 750 , 750 - 775 , 775 - 800 , 800 - 825 , 825 - 850 , 850 - 875 , 875 - 900 , 900 - 925 , 925 - 950 , 950 - 975 , 975 - 1000 | ||
 | Click To Change The Sort Order: By Market Cap or Company Size Performance: Year-to-date, Week and Day |  |
|
Get the most comprehensive stock market coverage daily at 12Stocks.com ➞ Best Stocks Today ➞ Best Stocks Weekly ➞ Best Stocks Year-to-Date ➞ Best Stocks Trends ➞  Best Stocks Today 12Stocks.com Best Nasdaq Stocks ➞ Best S&P 500 Stocks ➞ Best Tech Stocks ➞ Best Biotech Stocks ➞ |
| Detailed Overview of Healthcare Stocks |
| Healthcare Technical Overview, Leaders & Laggards, Top Healthcare ETF Funds & Detailed Healthcare Stocks List, Charts, Trends & More |
| Healthcare Sector: Technical Analysis, Trends & YTD Performance | |
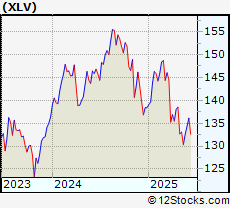
| Healthcare sector is composed of stocks
from pharmaceutical, biotech, diagnostics labs, insurance providers
and healthcare services. Healthcare sector, as represented by XLV, an exchange-traded fund [ETF] that holds basket of Healthcare stocks (e.g, Merck, Amgen) is up by 0.492568% and is currently underperforming the overall market by -12.862932% year-to-date. Below is a quick view of Technical charts and trends: |
|
 XLV Weekly Chart |
|
| Long Term Trend: Very Good | |
| Medium Term Trend: Deteriorating | |
 XLV Daily Chart |
|
| Short Term Trend: Not Good | |
| Overall Trend Score: 40 | |
| YTD Performance: 0.492568% | |
| **Trend Scores & Views Are Only For Educational Purposes And Not For Investing | |
| 12Stocks.com: Top Performing Healthcare Sector Stocks | ||||||||||||||||||||||||||||||||||||||||||||||
 The top performing Healthcare sector stocks year to date are
Now, more recently, over last week, the top performing Healthcare sector stocks on the move are


|
||||||||||||||||||||||||||||||||||||||||||||||
| 12Stocks.com: Investing in Healthcare Sector using Exchange Traded Funds | |
|
The following table shows list of key exchange traded funds (ETF) that
help investors track Healthcare Index. For detailed view, check out our ETF Funds section of our website. Quick View: Move mouse or cursor over ETF symbol (ticker) to view short-term Technical chart and over ETF name to view long term chart. Click on ticker or stock name for detailed view. Click on to add stock symbol to your watchlist and to view watchlist. |
12Stocks.com List of ETFs that track Healthcare Index
| Ticker | ETF Name | Watchlist | Recent Price | Smart Investing & Trading Score | Change % | Week % | Year-to-date % |
| BTEC | Principal Healthcare Innovators | | 39.49 | 30 | 0 | 1.02328 | 0% |
| 12Stocks.com: Charts, Trends, Fundamental Data and Performances of Healthcare Stocks | |
|
We now take in-depth look at all Healthcare stocks including charts, multi-period performances and overall trends (as measured by Smart Investing & Trading Score). One can sort Healthcare stocks (click link to choose) by Daily, Weekly and by Year-to-Date performances. Also, one can sort by size of the company or by market capitalization. |
| Select Your Default Chart Type: | |||||
| |||||
| Click on stock symbol or name for detailed view. Click on to add stock symbol to your watchlist and to view watchlist. Quick View: Move mouse or cursor over "Daily" to quickly view daily Technical stock chart and over "Weekly" to view weekly Technical stock chart. | |||||

 | OXFD Oxford Immunotec Global PLC |
| Sector: Health Care | |
| SubSector: Diagnostic Substances | |
| MarketCap: 283.671 Millions | |
| Recent Price: 11.13 Smart Investing & Trading Score: 20 | |
| Day Percent Change: 0.542005% Day Change: -9999 | |
| Week Change: -27.4919% Year-to-date Change: 0.0% | |
| OXFD Links: Profile News Message Board | |
| Charts:- Daily , Weekly | |
| Add OXFD to Watchlist: View: Get Complete OXFD Trend Analysis ➞ | |
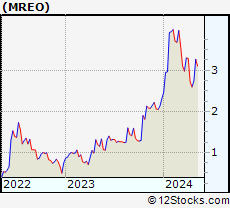 | MREO Mereo Biopharma Group Plc ADR |
| Sector: Health Care | |
| SubSector: Biotechnology | |
| MarketCap: 281.43 Millions | |
| Recent Price: 1.76 Smart Investing & Trading Score: 50 | |
| Day Percent Change: -4.86486% Day Change: 0.02 | |
| Week Change: -0.564972% Year-to-date Change: -48.5% | |
| MREO Links: Profile News Message Board | |
| Charts:- Daily , Weekly | |
| Add MREO to Watchlist: View: Get Complete MREO Trend Analysis ➞ | |
 | LCTX Lineage Cell Therapeutics Inc |
| Sector: Health Care | |
| SubSector: Biotechnology | |
| MarketCap: 278.59 Millions | |
| Recent Price: 1.35 Smart Investing & Trading Score: 90 | |
| Day Percent Change: 0.746269% Day Change: -0.02 | |
| Week Change: 10.6557% Year-to-date Change: 162.1% | |
| LCTX Links: Profile News Message Board | |
| Charts:- Daily , Weekly | |
| Add LCTX to Watchlist: View: Get Complete LCTX Trend Analysis ➞ | |
 | SLP Simulations Plus Inc |
| Sector: Health Care | |
| SubSector: Health Information Services | |
| MarketCap: 278.56 Millions | |
| Recent Price: 14.68 Smart Investing & Trading Score: 90 | |
| Day Percent Change: -2.45847% Day Change: -0.27 | |
| Week Change: 6.06936% Year-to-date Change: -47.4% | |
| SLP Links: Profile News Message Board | |
| Charts:- Daily , Weekly | |
| Add SLP to Watchlist: View: Get Complete SLP Trend Analysis ➞ | |
 | GRTX Galera Therapeutics, Inc. |
| Sector: Health Care | |
| SubSector: Biotechnology | |
| MarketCap: 277.585 Millions | |
| Recent Price: 0.02 Smart Investing & Trading Score: 30 | |
| Day Percent Change: 0.444444% Day Change: -9999 | |
| Week Change: -1.73913% Year-to-date Change: -43.6% | |
| GRTX Links: Profile News Message Board | |
| Charts:- Daily , Weekly | |
| Add GRTX to Watchlist: View: Get Complete GRTX Trend Analysis ➞ | |
 | ACB Aurora Cannabis Inc |
| Sector: Health Care | |
| SubSector: Drug Manufacturers - Specialty & Generic | |
| MarketCap: 277.17 Millions | |
| Recent Price: 4.97 Smart Investing & Trading Score: 30 | |
| Day Percent Change: 2.05339% Day Change: 0.06 | |
| Week Change: 1.222% Year-to-date Change: 10.4% | |
| ACB Links: Profile News Message Board | |
| Charts:- Daily , Weekly | |
| Add ACB to Watchlist: View: Get Complete ACB Trend Analysis ➞ | |
 | IKNA Ikena Oncology, Inc. |
| Sector: Health Care | |
| SubSector: Biotechnology | |
| MarketCap: 277 Millions | |
| Recent Price: 17.16 Smart Investing & Trading Score: 80 | |
| Day Percent Change: 4.37956% Day Change: -9999 | |
| Week Change: 10.8527% Year-to-date Change: -13.3% | |
| IKNA Links: Profile News Message Board | |
| Charts:- Daily , Weekly | |
| Add IKNA to Watchlist: View: Get Complete IKNA Trend Analysis ➞ | |
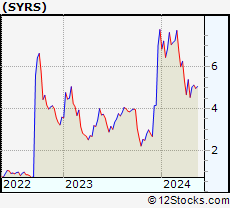 | SYRS Syros Pharmaceuticals, Inc. |
| Sector: Health Care | |
| SubSector: Biotechnology | |
| MarketCap: 275.485 Millions | |
| Recent Price: 0.02 Smart Investing & Trading Score: 70 | |
| Day Percent Change: 226.23% Day Change: -9999 | |
| Week Change: 1709.09% Year-to-date Change: -91.4% | |
| SYRS Links: Profile News Message Board | |
| Charts:- Daily , Weekly | |
| Add SYRS to Watchlist: View: Get Complete SYRS Trend Analysis ➞ | |
 | ARA American Renal Associates Holdings, Inc. |
| Sector: Health Care | |
| SubSector: Medical Laboratories & Research | |
| MarketCap: 274.7 Millions | |
| Recent Price: 34.64 Smart Investing & Trading Score: 40 | |
| Day Percent Change: -1.11333% Day Change: -9999 | |
| Week Change: -17.0697% Year-to-date Change: 0.0% | |
| ARA Links: Profile News Message Board | |
| Charts:- Daily , Weekly | |
| Add ARA to Watchlist: View: Get Complete ARA Trend Analysis ➞ | |
 | MNPR Monopar Therapeutics Inc |
| Sector: Health Care | |
| SubSector: Biotechnology | |
| MarketCap: 272.77 Millions | |
| Recent Price: 54.49 Smart Investing & Trading Score: 100 | |
| Day Percent Change: 10.707% Day Change: -1.16 | |
| Week Change: 23.2527% Year-to-date Change: 145.2% | |
| MNPR Links: Profile News Message Board | |
| Charts:- Daily , Weekly | |
| Add MNPR to Watchlist: View: Get Complete MNPR Trend Analysis ➞ | |
 | VNDA Vanda Pharmaceuticals Inc |
| Sector: Health Care | |
| SubSector: Biotechnology | |
| MarketCap: 272.4 Millions | |
| Recent Price: 4.38 Smart Investing & Trading Score: 0 | |
| Day Percent Change: -2.88248% Day Change: -0.09 | |
| Week Change: -4.98915% Year-to-date Change: -9.1% | |
| VNDA Links: Profile News Message Board | |
| Charts:- Daily , Weekly | |
| Add VNDA to Watchlist: View: Get Complete VNDA Trend Analysis ➞ | |
 | SLN Silence Therapeutics Plc ADR |
| Sector: Health Care | |
| SubSector: Biotechnology | |
| MarketCap: 268.74 Millions | |
| Recent Price: 4.73 Smart Investing & Trading Score: 10 | |
| Day Percent Change: 4.87805% Day Change: 0.13 | |
| Week Change: -16.8717% Year-to-date Change: -34.2% | |
| SLN Links: Profile News Message Board | |
| Charts:- Daily , Weekly | |
| Add SLN to Watchlist: View: Get Complete SLN Trend Analysis ➞ | |
 | MGTA Magenta Therapeutics, Inc. |
| Sector: Health Care | |
| SubSector: Biotechnology | |
| MarketCap: 267.485 Millions | |
| Recent Price: 0.70 Smart Investing & Trading Score: 10 | |
| Day Percent Change: 0% Day Change: -9999 | |
| Week Change: -93.75% Year-to-date Change: 0.0% | |
| MGTA Links: Profile News Message Board | |
| Charts:- Daily , Weekly | |
| Add MGTA to Watchlist: View: Get Complete MGTA Trend Analysis ➞ | |
 | AVIR Atea Pharmaceuticals Inc |
| Sector: Health Care | |
| SubSector: Biotechnology | |
| MarketCap: 267.43 Millions | |
| Recent Price: 3.04 Smart Investing & Trading Score: 0 | |
| Day Percent Change: -3.18471% Day Change: 0.03 | |
| Week Change: -9.79228% Year-to-date Change: -11.1% | |
| AVIR Links: Profile News Message Board | |
| Charts:- Daily , Weekly | |
| Add AVIR to Watchlist: View: Get Complete AVIR Trend Analysis ➞ | |
 | VMD Viemed Healthcare Inc |
| Sector: Health Care | |
| SubSector: Medical Devices | |
| MarketCap: 266.85 Millions | |
| Recent Price: 6.76 Smart Investing & Trading Score: 40 | |
| Day Percent Change: -0.294985% Day Change: 0.19 | |
| Week Change: -1.74419% Year-to-date Change: -16.9% | |
| VMD Links: Profile News Message Board | |
| Charts:- Daily , Weekly | |
| Add VMD to Watchlist: View: Get Complete VMD Trend Analysis ➞ | |
 | HIIQ Health Insurance Innovations, Inc. |
| Sector: Health Care | |
| SubSector: Health Care Plans | |
| MarketCap: 264.71 Millions | |
| Recent Price: 14.46 Smart Investing & Trading Score: 20 | |
| Day Percent Change: 0.346981% Day Change: -9999 | |
| Week Change: -79.2361% Year-to-date Change: 0.0% | |
| HIIQ Links: Profile News Message Board | |
| Charts:- Daily , Weekly | |
| Add HIIQ to Watchlist: View: Get Complete HIIQ Trend Analysis ➞ | |
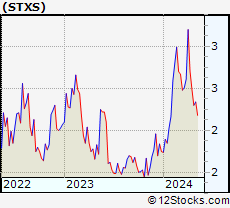 | STXS Stereotaxis Inc |
| Sector: Health Care | |
| SubSector: Medical Instruments & Supplies | |
| MarketCap: 264.11 Millions | |
| Recent Price: 2.82 Smart Investing & Trading Score: 40 | |
| Day Percent Change: -1.05263% Day Change: -0.01 | |
| Week Change: -2.75862% Year-to-date Change: 23.1% | |
| STXS Links: Profile News Message Board | |
| Charts:- Daily , Weekly | |
| Add STXS to Watchlist: View: Get Complete STXS Trend Analysis ➞ | |
 | PFNX Pfenex Inc. |
| Sector: Health Care | |
| SubSector: Biotechnology | |
| MarketCap: 260.685 Millions | |
| Recent Price: 10.21 Smart Investing & Trading Score: 10 | |
| Day Percent Change: -6.92799% Day Change: -9999 | |
| Week Change: -85.8017% Year-to-date Change: 0.0% | |
| PFNX Links: Profile News Message Board | |
| Charts:- Daily , Weekly | |
| Add PFNX to Watchlist: View: Get Complete PFNX Trend Analysis ➞ | |
 | PGNX Progenics Pharmaceuticals, Inc. |
| Sector: Health Care | |
| SubSector: Biotechnology | |
| MarketCap: 259.885 Millions | |
| Recent Price: 31.11 Smart Investing & Trading Score: 70 | |
| Day Percent Change: -2.62911% Day Change: -9999 | |
| Week Change: 133.208% Year-to-date Change: 0.0% | |
| PGNX Links: Profile News Message Board | |
| Charts:- Daily , Weekly | |
| Add PGNX to Watchlist: View: Get Complete PGNX Trend Analysis ➞ | |
 | CNCE Concert Pharmaceuticals, Inc. |
| Sector: Health Care | |
| SubSector: Biotechnology | |
| MarketCap: 257.985 Millions | |
| Recent Price: 13.68 Smart Investing & Trading Score: 100 | |
| Day Percent Change: 0.95941% Day Change: -9999 | |
| Week Change: 63.4409% Year-to-date Change: 0.0% | |
| CNCE Links: Profile News Message Board | |
| Charts:- Daily , Weekly | |
| Add CNCE to Watchlist: View: Get Complete CNCE Trend Analysis ➞ | |
 | PRQR ProQR Therapeutics N.V |
| Sector: Health Care | |
| SubSector: Biotechnology | |
| MarketCap: 257.77 Millions | |
| Recent Price: 1.99 Smart Investing & Trading Score: 10 | |
| Day Percent Change: -9.36073% Day Change: 0.07 | |
| Week Change: -16.9456% Year-to-date Change: -27.6% | |
| PRQR Links: Profile News Message Board | |
| Charts:- Daily , Weekly | |
| Add PRQR to Watchlist: View: Get Complete PRQR Trend Analysis ➞ | |
 | ALLO Allogene Therapeutics Inc |
| Sector: Health Care | |
| SubSector: Biotechnology | |
| MarketCap: 255.16 Millions | |
| Recent Price: 1.15 Smart Investing & Trading Score: 70 | |
| Day Percent Change: 1.76991% Day Change: 0.06 | |
| Week Change: 0% Year-to-date Change: -47.7% | |
| ALLO Links: Profile News Message Board | |
| Charts:- Daily , Weekly | |
| Add ALLO to Watchlist: View: Get Complete ALLO Trend Analysis ➞ | |
 | UBX Unity Biotechnology, Inc. |
| Sector: Health Care | |
| SubSector: Biotechnology | |
| MarketCap: 254.985 Millions | |
| Recent Price: 0.16 Smart Investing & Trading Score: 0 | |
| Day Percent Change: -20.04% Day Change: -9999 | |
| Week Change: -58.3333% Year-to-date Change: -86.0% | |
| UBX Links: Profile News Message Board | |
| Charts:- Daily , Weekly | |
| Add UBX to Watchlist: View: Get Complete UBX Trend Analysis ➞ | |
 | CERS Cerus Corp |
| Sector: Health Care | |
| SubSector: Medical Devices | |
| MarketCap: 254.96 Millions | |
| Recent Price: 1.20 Smart Investing & Trading Score: 10 | |
| Day Percent Change: -2.43902% Day Change: 0.04 | |
| Week Change: -9.77444% Year-to-date Change: -23.6% | |
| CERS Links: Profile News Message Board | |
| Charts:- Daily , Weekly | |
| Add CERS to Watchlist: View: Get Complete CERS Trend Analysis ➞ | |
 | PBYI Puma Biotechnology Inc |
| Sector: Health Care | |
| SubSector: Biotechnology | |
| MarketCap: 253.36 Millions | |
| Recent Price: 4.64 Smart Investing & Trading Score: 70 | |
| Day Percent Change: 3.80313% Day Change: 0.11 | |
| Week Change: -7.75348% Year-to-date Change: 48.7% | |
| PBYI Links: Profile News Message Board | |
| Charts:- Daily , Weekly | |
| Add PBYI to Watchlist: View: Get Complete PBYI Trend Analysis ➞ | |
| For tabular summary view of above stock list: Summary View ➞ 0 - 25 , 25 - 50 , 50 - 75 , 75 - 100 , 100 - 125 , 125 - 150 , 150 - 175 , 175 - 200 , 200 - 225 , 225 - 250 , 250 - 275 , 275 - 300 , 300 - 325 , 325 - 350 , 350 - 375 , 375 - 400 , 400 - 425 , 425 - 450 , 450 - 475 , 475 - 500 , 500 - 525 , 525 - 550 , 550 - 575 , 575 - 600 , 600 - 625 , 625 - 650 , 650 - 675 , 675 - 700 , 700 - 725 , 725 - 750 , 750 - 775 , 775 - 800 , 800 - 825 , 825 - 850 , 850 - 875 , 875 - 900 , 900 - 925 , 925 - 950 , 950 - 975 , 975 - 1000 | ||
| Click To Change The Sort Order: By Market Cap or Company Size Performance: Year-to-date, Week and Day | |
| Select Chart Type: | ||
|
Best Stocks Today 12Stocks.com |
© 2025 12Stocks.com Terms & Conditions Privacy Contact Us
All Information Provided Only For Education And Not To Be Used For Investing or Trading. See Terms & Conditions


One More Thing ... Get Best Stocks Delivered Daily!
Never Ever Miss A Move With Our Top Ten Stocks Lists
Find Best Stocks In Any Market - Bull or Bear Market
Take A Peek At Our Top Ten Stocks Lists: Daily, Weekly, Year-to-Date & Top Trends
Find Best Stocks In Any Market - Bull or Bear Market
Take A Peek At Our Top Ten Stocks Lists: Daily, Weekly, Year-to-Date & Top Trends
Healthcare Stocks With Best Up Trends [0-bearish to 100-bullish]: AVITA [100], Monte Rosa[100], C4 [100], AlloVir [100], Cara [100], Spruce Biosciences[100], Ocugen [100], Monopar [100], InnovAge Holding[100], Harrow [100], Kala Bio[100]
Best Healthcare Stocks Year-to-Date:
Regencell Bioscience[11217%], Kaleido BioSciences[9900%], Eagle [664.286%], So-Young [375.53%], Celcuity [319.421%], I-Mab ADR[299.559%], Galectin [284.615%], Biosig Technologies[270%], Immuneering Corp[255.656%], Nektar [239.993%], OptimizeRx Corp[232.63%] Best Healthcare Stocks This Week:
Athersys [193287%], Nobilis Health[101349%], VBI Vaccines[86898.5%], ContraFect [47677.8%], Clovis Oncology[39610.5%], Endo [28369.6%], NanoString Technologies[17224.7%], Neptune Wellness[14100%], ViewRay [11470.2%], Mallkrodt [11382.1%], Achillion [10033.3%] Best Healthcare Stocks Daily:
Kaleido BioSciences[9900%], Neoleukin [332.665%], Syros [226.23%], Athenex [103.333%], AVITA [48.2456%], Monte Rosa[44.0748%], C4 [34.2105%], Accelerate Diagnostics[17.6471%], Aptose Biosciences[17.5439%], AlloVir [16.9215%], Cara [14.3396%]