
 Login Sign Up


| |||||
 |  | ||||

| 12Stocks.com Market Intelligence |
Best Healthcare Stocks
 | "Discover best trending healthcare stocks with 12Stocks.com." |
| - Subu Vdaygiri, Founder, 12Stocks.com |
| In a hurry? Healthcare Stocks Lists: Performance Trends Table, Stock Charts
Sort Healthcare stocks: Daily, Weekly, Year-to-Date, Market Cap & Trends. Filter Healthcare stocks list by size:All Healthcare Large Mid-Range Small |
| 12Stocks.com Healthcare Stocks Performances & Trends Daily | |||||||||
|
|  The overall Smart Investing & Trading Score is 100 (0-bearish to 100-bullish) which puts Healthcare sector in short term bullish trend. The Smart Investing & Trading Score from previous trading session is 70 and an improvement of trend continues.
| ||||||||
Here are the Smart Investing & Trading Scores of the most requested Healthcare stocks at 12Stocks.com (click stock name for detailed review):
|


| 12Stocks.com: Investing in Healthcare sector with Stocks | |
|
The following table helps investors and traders sort through current performance and trends (as measured by Smart Investing & Trading Score) of various
stocks in the Healthcare sector. Quick View: Move mouse or cursor over stock symbol (ticker) to view short-term Technical chart and over stock name to view long term chart. Click on  to add stock symbol to your watchlist and to add stock symbol to your watchlist and  to view watchlist. Click on any ticker or stock name for detailed market intelligence report for that stock. to view watchlist. Click on any ticker or stock name for detailed market intelligence report for that stock. |
12Stocks.com Performance of Stocks in Healthcare Sector
| Ticker | Stock Name | Watchlist | Category | Recent Price | Smart Investing & Trading Score | Change % | YTD Change% |
| SIBN | SI-BONE |   | Medical Devices | 14.31 | 40 | 0.32% | 2.76% |
| LH | Labcorp | | Diagnostics & Research | 279.44 | 40 | 0.14% | 23.17% |
| LMAT | Lemaitre Vascular | | Instruments | 86.78 | 40 | 0.13% | -4.66% |
| MYOK | MyoKardia | | Biotechnology | 258.01 | 40 | 0.12% | 0.00% |
| ALVO | Alvotech | | Drug Manufacturers - Specialty & Generic | 8.20 | 40 | 0.12% | -37.69% |
| CDMO | Avid Bioservices | | Biotechnology | 12.49 | 40 | 0.08% | 1.38% |
| BIO.B | BIO-RAD LABS | | MED-BIOMED/GENE | 497.86 | 40 | 0.00% | 0.00% |
| BLUE | bluebird bio | | Biotechnology | 4.97 | 40 | 0.00% | -42.81% |
| MNOV | Medicinova | | Biotechnology | 1.25 | 40 | 0.00% | -41.31% |
| RVNC | Revance | | Biotechnology | 3.65 | 40 | 0.00% | 19.28% |
| NVRO | Nevro | | Equipment | 5.84 | 40 | 0.00% | 57.41% |
| SILK | Silk Road | | Equipment | 27.49 | 40 | 0.00% | 0.00% |
| AKYA | Akoya Biosciences | | Instruments | 1.29 | 40 | 0.00% | -46.91% |
| TYRA | Tyra Biosciences | | Biotechnology | 13.38 | 40 | -0.34% | -7.31% |
| ALOG | Analogic | | Laboratories | 137.94 | 40 | -0.70% | 0.00% |
| XOMAO | XOMA | | Biotechnology | 25.39 | 40 | -0.70% | 5.44% |
| ARMP | Armata | | Biotechnology | 2.96 | 40 | -0.70% | 51.82% |
| ARA | American Renal | | Laboratories | 34.64 | 40 | -1.11% | 0.00% |
| AUPH | Aurinia | | Biotechnology | 11.26 | 40 | -1.23% | 28.39% |
| FVE | Five Star | | Long-Term | 2.28 | 40 | -1.30% | 0.00% |
| SVRA | Savara | | Biotechnology | 3.48 | 40 | -1.55% | 13.52% |
| PRGO | Perrigo | | Drug Manufacturers - Specialty & Generic | 22.15 | 40 | -1.60% | -13.01% |
| AMPH | Amphastar | | Drug Manufacturers - Specialty & Generic | 26.52 | 40 | -1.74% | -27.06% |
| GH | Guardant Health | | Diagnostics & Research | 61.49 | 40 | -1.85% | 93.55% |
| CAI | Caris Life | | Biotechnology | 29.71 | 40 | -2.04% | 6.11% |
| For chart view version of above stock list: Chart View ➞ 0 - 25 , 25 - 50 , 50 - 75 , 75 - 100 , 100 - 125 , 125 - 150 , 150 - 175 , 175 - 200 , 200 - 225 , 225 - 250 , 250 - 275 , 275 - 300 , 300 - 325 , 325 - 350 , 350 - 375 , 375 - 400 , 400 - 425 , 425 - 450 , 450 - 475 , 475 - 500 , 500 - 525 , 525 - 550 , 550 - 575 , 575 - 600 , 600 - 625 , 625 - 650 , 650 - 675 , 675 - 700 , 700 - 725 , 725 - 750 , 750 - 775 , 775 - 800 , 800 - 825 , 825 - 850 , 850 - 875 , 875 - 900 , 900 - 925 , 925 - 950 , 950 - 975 , 975 - 1000 | ||
 | Click To Change The Sort Order: By Market Cap or Company Size Performance: Year-to-date, Week and Day |  |
|
Get the most comprehensive stock market coverage daily at 12Stocks.com ➞ Best Stocks Today ➞ Best Stocks Weekly ➞ Best Stocks Year-to-Date ➞ Best Stocks Trends ➞  Best Stocks Today 12Stocks.com Best Nasdaq Stocks ➞ Best S&P 500 Stocks ➞ Best Tech Stocks ➞ Best Biotech Stocks ➞ |
| Detailed Overview of Healthcare Stocks |
| Healthcare Technical Overview, Leaders & Laggards, Top Healthcare ETF Funds & Detailed Healthcare Stocks List, Charts, Trends & More |
| Healthcare Sector: Technical Analysis, Trends & YTD Performance | |
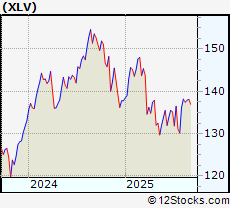
| Healthcare sector is composed of stocks
from pharmaceutical, biotech, diagnostics labs, insurance providers
and healthcare services. Healthcare sector, as represented by XLV, an exchange-traded fund [ETF] that holds basket of Healthcare stocks (e.g, Merck, Amgen) is up by 4.95646% and is currently underperforming the overall market by -9.80144% year-to-date. Below is a quick view of Technical charts and trends: |
|
 XLV Weekly Chart |
|
| Long Term Trend: Very Good | |
| Medium Term Trend: Very Good | |
 XLV Daily Chart |
|
| Short Term Trend: Very Good | |
| Overall Trend Score: 100 | |
| YTD Performance: 4.95646% | |
| **Trend Scores & Views Are Only For Educational Purposes And Not For Investing | |
| 12Stocks.com: Top Performing Healthcare Sector Stocks | ||||||||||||||||||||||||||||||||||||||||||||||
 The top performing Healthcare sector stocks year to date are
Now, more recently, over last week, the top performing Healthcare sector stocks on the move are


|
||||||||||||||||||||||||||||||||||||||||||||||
| 12Stocks.com: Investing in Healthcare Sector using Exchange Traded Funds | |
|
The following table shows list of key exchange traded funds (ETF) that
help investors track Healthcare Index. For detailed view, check out our ETF Funds section of our website. Quick View: Move mouse or cursor over ETF symbol (ticker) to view short-term Technical chart and over ETF name to view long term chart. Click on ticker or stock name for detailed view. Click on to add stock symbol to your watchlist and to view watchlist. |
12Stocks.com List of ETFs that track Healthcare Index
| Ticker | ETF Name | Watchlist | Recent Price | Smart Investing & Trading Score | Change % | Week % | Year-to-date % |
| BTEC | Principal Healthcare Innovators | | 39.49 | 30 | 0 | 1.02328 | 0% |
| 12Stocks.com: Charts, Trends, Fundamental Data and Performances of Healthcare Stocks | |
|
We now take in-depth look at all Healthcare stocks including charts, multi-period performances and overall trends (as measured by Smart Investing & Trading Score). One can sort Healthcare stocks (click link to choose) by Daily, Weekly and by Year-to-Date performances. Also, one can sort by size of the company or by market capitalization. |
| Select Your Default Chart Type: | |||||
| |||||
| Click on stock symbol or name for detailed view. Click on to add stock symbol to your watchlist and to view watchlist. Quick View: Move mouse or cursor over "Daily" to quickly view daily Technical stock chart and over "Weekly" to view weekly Technical stock chart. | |||||

 | SIBN SI-BONE Inc |
| Sector: Health Care | |
| SubSector: Medical Devices | |
| MarketCap: 702.77 Millions | |
| Recent Price: 14.31 Smart Investing & Trading Score: 40 | |
| Day Percent Change: 0.315347% Day Change: 0.1 | |
| Week Change: 0.668073% Year-to-date Change: 2.8% | |
| SIBN Links: Profile News Message Board | |
| Charts:- Daily , Weekly | |
| Add SIBN to Watchlist: View: Get Complete SIBN Trend Analysis ➞ | |
 | LH Labcorp Holdings Inc |
| Sector: Health Care | |
| SubSector: Diagnostics & Research | |
| MarketCap: 23157.5 Millions | |
| Recent Price: 279.44 Smart Investing & Trading Score: 40 | |
| Day Percent Change: 0.136171% Day Change: 0.64 | |
| Week Change: 0.0322176% Year-to-date Change: 23.2% | |
| LH Links: Profile News Message Board | |
| Charts:- Daily , Weekly | |
| Add LH to Watchlist: View: Get Complete LH Trend Analysis ➞ | |
 | LMAT Lemaitre Vascular Inc |
| Sector: Health Care | |
| SubSector: Medical Instruments & Supplies | |
| MarketCap: 2206.93 Millions | |
| Recent Price: 86.78 Smart Investing & Trading Score: 40 | |
| Day Percent Change: 0.126918% Day Change: -0.26 | |
| Week Change: -1.16173% Year-to-date Change: -4.7% | |
| LMAT Links: Profile News Message Board | |
| Charts:- Daily , Weekly | |
| Add LMAT to Watchlist: View: Get Complete LMAT Trend Analysis ➞ | |
 | MYOK MyoKardia, Inc. |
| Sector: Health Care | |
| SubSector: Biotechnology | |
| MarketCap: 2408.55 Millions | |
| Recent Price: 258.01 Smart Investing & Trading Score: 40 | |
| Day Percent Change: 0.12418% Day Change: -9999 | |
| Week Change: -1.45896% Year-to-date Change: 0.0% | |
| MYOK Links: Profile News Message Board | |
| Charts:- Daily , Weekly | |
| Add MYOK to Watchlist: View: Get Complete MYOK Trend Analysis ➞ | |
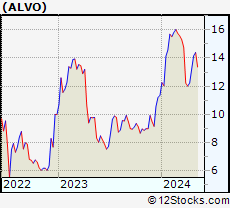 | ALVO Alvotech |
| Sector: Health Care | |
| SubSector: Drug Manufacturers - Specialty & Generic | |
| MarketCap: 2514.04 Millions | |
| Recent Price: 8.20 Smart Investing & Trading Score: 40 | |
| Day Percent Change: 0.1221% Day Change: 0.25 | |
| Week Change: -5.74713% Year-to-date Change: -37.7% | |
| ALVO Links: Profile News Message Board | |
| Charts:- Daily , Weekly | |
| Add ALVO to Watchlist: View: Get Complete ALVO Trend Analysis ➞ | |
 | CDMO Avid Bioservices, Inc. |
| Sector: Health Care | |
| SubSector: Biotechnology | |
| MarketCap: 203.685 Millions | |
| Recent Price: 12.49 Smart Investing & Trading Score: 40 | |
| Day Percent Change: 0.0801282% Day Change: -9999 | |
| Week Change: 0.321285% Year-to-date Change: 1.4% | |
| CDMO Links: Profile News Message Board | |
| Charts:- Daily , Weekly | |
| Add CDMO to Watchlist: View: Get Complete CDMO Trend Analysis ➞ | |
 | BIO.B BIO-RAD LABS -B |
| Sector: Health Care | |
| SubSector: MED-BIOMED/GENE | |
| MarketCap: 2333.41 Millions | |
| Recent Price: 497.86 Smart Investing & Trading Score: 40 | |
| Day Percent Change: 0% Day Change: -9999 | |
| Week Change: 5.5638% Year-to-date Change: 0.0% | |
| BIO.B Links: Profile News Message Board | |
| Charts:- Daily , Weekly | |
| Add BIO.B to Watchlist: View: Get Complete BIO.B Trend Analysis ➞ | |
 | BLUE bluebird bio, Inc. |
| Sector: Health Care | |
| SubSector: Biotechnology | |
| MarketCap: 3365.05 Millions | |
| Recent Price: 4.97 Smart Investing & Trading Score: 40 | |
| Day Percent Change: 0% Day Change: -9999 | |
| Week Change: 0% Year-to-date Change: -42.8% | |
| BLUE Links: Profile News Message Board | |
| Charts:- Daily , Weekly | |
| Add BLUE to Watchlist: View: Get Complete BLUE Trend Analysis ➞ | |
 | MNOV Medicinova Inc |
| Sector: Health Care | |
| SubSector: Biotechnology | |
| MarketCap: 63.27 Millions | |
| Recent Price: 1.25 Smart Investing & Trading Score: 40 | |
| Day Percent Change: 0% Day Change: -0.02 | |
| Week Change: 0% Year-to-date Change: -41.3% | |
| MNOV Links: Profile News Message Board | |
| Charts:- Daily , Weekly | |
| Add MNOV to Watchlist: View: Get Complete MNOV Trend Analysis ➞ | |
 | RVNC Revance Therapeutics, Inc. |
| Sector: Health Care | |
| SubSector: Biotechnology | |
| MarketCap: 854.185 Millions | |
| Recent Price: 3.65 Smart Investing & Trading Score: 40 | |
| Day Percent Change: 0% Day Change: -9999 | |
| Week Change: 0.274725% Year-to-date Change: 19.3% | |
| RVNC Links: Profile News Message Board | |
| Charts:- Daily , Weekly | |
| Add RVNC to Watchlist: View: Get Complete RVNC Trend Analysis ➞ | |
 | NVRO Nevro Corp. |
| Sector: Health Care | |
| SubSector: Medical Appliances & Equipment | |
| MarketCap: 2489.3 Millions | |
| Recent Price: 5.84 Smart Investing & Trading Score: 40 | |
| Day Percent Change: 0% Day Change: -9999 | |
| Week Change: 0% Year-to-date Change: 57.4% | |
| NVRO Links: Profile News Message Board | |
| Charts:- Daily , Weekly | |
| Add NVRO to Watchlist: View: Get Complete NVRO Trend Analysis ➞ | |
 | SILK Silk Road Medical, Inc |
| Sector: Health Care | |
| SubSector: Medical Appliances & Equipment | |
| MarketCap: 881.78 Millions | |
| Recent Price: 27.49 Smart Investing & Trading Score: 40 | |
| Day Percent Change: 0% Day Change: -9999 | |
| Week Change: 0% Year-to-date Change: 0.0% | |
| SILK Links: Profile News Message Board | |
| Charts:- Daily , Weekly | |
| Add SILK to Watchlist: View: Get Complete SILK Trend Analysis ➞ | |
 | AKYA Akoya Biosciences, Inc. |
| Sector: Health Care | |
| SubSector: Medical Instruments & Supplies | |
| MarketCap: 340 Millions | |
| Recent Price: 1.29 Smart Investing & Trading Score: 40 | |
| Day Percent Change: 0% Day Change: -9999 | |
| Week Change: 0% Year-to-date Change: -46.9% | |
| AKYA Links: Profile News Message Board | |
| Charts:- Daily , Weekly | |
| Add AKYA to Watchlist: View: Get Complete AKYA Trend Analysis ➞ | |
 | TYRA Tyra Biosciences Inc |
| Sector: Health Care | |
| SubSector: Biotechnology | |
| MarketCap: 674.21 Millions | |
| Recent Price: 13.38 Smart Investing & Trading Score: 40 | |
| Day Percent Change: -0.33532% Day Change: 1.46 | |
| Week Change: 4.81975% Year-to-date Change: -7.3% | |
| TYRA Links: Profile News Message Board | |
| Charts:- Daily , Weekly | |
| Add TYRA to Watchlist: View: Get Complete TYRA Trend Analysis ➞ | |
 | ALOG Analogic Corporation |
| Sector: Health Care | |
| SubSector: Medical Laboratories & Research | |
| MarketCap: 926.64 Millions | |
| Recent Price: 137.94 Smart Investing & Trading Score: 40 | |
| Day Percent Change: -0.698294% Day Change: -9999 | |
| Week Change: 3.30263% Year-to-date Change: 0.0% | |
| ALOG Links: Profile News Message Board | |
| Charts:- Daily , Weekly | |
| Add ALOG to Watchlist: View: Get Complete ALOG Trend Analysis ➞ | |
 | XOMAO XOMA Corporation |
| Sector: Health Care | |
| SubSector: Biotechnology | |
| MarketCap: 217 Millions | |
| Recent Price: 25.39 Smart Investing & Trading Score: 40 | |
| Day Percent Change: -0.703562% Day Change: 0.25 | |
| Week Change: 0.0788333% Year-to-date Change: 5.4% | |
| XOMAO Links: Profile News Message Board | |
| Charts:- Daily , Weekly | |
| Add XOMAO to Watchlist: View: Get Complete XOMAO Trend Analysis ➞ | |
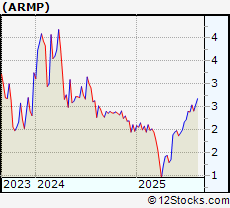 | ARMP Armata Pharmaceuticals Inc |
| Sector: Health Care | |
| SubSector: Biotechnology | |
| MarketCap: 103.26 Millions | |
| Recent Price: 2.96 Smart Investing & Trading Score: 40 | |
| Day Percent Change: -0.704698% Day Change: -0.08 | |
| Week Change: -3.61564% Year-to-date Change: 51.8% | |
| ARMP Links: Profile News Message Board | |
| Charts:- Daily , Weekly | |
| Add ARMP to Watchlist: View: Get Complete ARMP Trend Analysis ➞ | |
 | ARA American Renal Associates Holdings, Inc. |
| Sector: Health Care | |
| SubSector: Medical Laboratories & Research | |
| MarketCap: 274.7 Millions | |
| Recent Price: 34.64 Smart Investing & Trading Score: 40 | |
| Day Percent Change: -1.11333% Day Change: -9999 | |
| Week Change: -17.0697% Year-to-date Change: 0.0% | |
| ARA Links: Profile News Message Board | |
| Charts:- Daily , Weekly | |
| Add ARA to Watchlist: View: Get Complete ARA Trend Analysis ➞ | |
 | AUPH Aurinia Pharmaceuticals Inc |
| Sector: Health Care | |
| SubSector: Biotechnology | |
| MarketCap: 1632.21 Millions | |
| Recent Price: 11.26 Smart Investing & Trading Score: 40 | |
| Day Percent Change: -1.22807% Day Change: 0.07 | |
| Week Change: -12.5776% Year-to-date Change: 28.4% | |
| AUPH Links: Profile News Message Board | |
| Charts:- Daily , Weekly | |
| Add AUPH to Watchlist: View: Get Complete AUPH Trend Analysis ➞ | |
 | FVE Five Star Senior Living Inc. |
| Sector: Health Care | |
| SubSector: Long-Term Care Facilities | |
| MarketCap: 85.2986 Millions | |
| Recent Price: 2.28 Smart Investing & Trading Score: 40 | |
| Day Percent Change: -1.2987% Day Change: -9999 | |
| Week Change: 4.10959% Year-to-date Change: 0.0% | |
| FVE Links: Profile News Message Board | |
| Charts:- Daily , Weekly | |
| Add FVE to Watchlist: View: Get Complete FVE Trend Analysis ➞ | |
 | SVRA Savara Inc |
| Sector: Health Care | |
| SubSector: Biotechnology | |
| MarketCap: 642.95 Millions | |
| Recent Price: 3.48 Smart Investing & Trading Score: 40 | |
| Day Percent Change: -1.55367% Day Change: -0.04 | |
| Week Change: -0.712251% Year-to-date Change: 13.5% | |
| SVRA Links: Profile News Message Board | |
| Charts:- Daily , Weekly | |
| Add SVRA to Watchlist: View: Get Complete SVRA Trend Analysis ➞ | |
 | PRGO Perrigo Company plc |
| Sector: Health Care | |
| SubSector: Drug Manufacturers - Specialty & Generic | |
| MarketCap: 3116.25 Millions | |
| Recent Price: 22.15 Smart Investing & Trading Score: 40 | |
| Day Percent Change: -1.59929% Day Change: -0.24 | |
| Week Change: 3.55306% Year-to-date Change: -13.0% | |
| PRGO Links: Profile News Message Board | |
| Charts:- Daily , Weekly | |
| Add PRGO to Watchlist: View: Get Complete PRGO Trend Analysis ➞ | |
 | AMPH Amphastar Pharmaceuticals Inc |
| Sector: Health Care | |
| SubSector: Drug Manufacturers - Specialty & Generic | |
| MarketCap: 1367.89 Millions | |
| Recent Price: 26.52 Smart Investing & Trading Score: 40 | |
| Day Percent Change: -1.74139% Day Change: 0.04 | |
| Week Change: -1.30257% Year-to-date Change: -27.1% | |
| AMPH Links: Profile News Message Board | |
| Charts:- Daily , Weekly | |
| Add AMPH to Watchlist: View: Get Complete AMPH Trend Analysis ➞ | |
 | GH Guardant Health Inc |
| Sector: Health Care | |
| SubSector: Diagnostics & Research | |
| MarketCap: 7498.56 Millions | |
| Recent Price: 61.49 Smart Investing & Trading Score: 40 | |
| Day Percent Change: -1.85156% Day Change: 2.78 | |
| Week Change: 6.62389% Year-to-date Change: 93.5% | |
| GH Links: Profile News Message Board | |
| Charts:- Daily , Weekly | |
| Add GH to Watchlist: View: Get Complete GH Trend Analysis ➞ | |
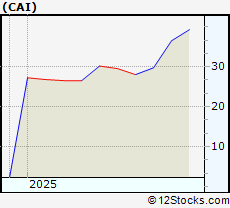 | CAI Caris Life Sciences Inc |
| Sector: Health Care | |
| SubSector: Biotechnology | |
| MarketCap: 9800.66 Millions | |
| Recent Price: 29.71 Smart Investing & Trading Score: 40 | |
| Day Percent Change: -2.04418% Day Change: 3.05 | |
| Week Change: -2.39816% Year-to-date Change: 6.1% | |
| CAI Links: Profile News Message Board | |
| Charts:- Daily , Weekly | |
| Add CAI to Watchlist: View: Get Complete CAI Trend Analysis ➞ | |
| For tabular summary view of above stock list: Summary View ➞ 0 - 25 , 25 - 50 , 50 - 75 , 75 - 100 , 100 - 125 , 125 - 150 , 150 - 175 , 175 - 200 , 200 - 225 , 225 - 250 , 250 - 275 , 275 - 300 , 300 - 325 , 325 - 350 , 350 - 375 , 375 - 400 , 400 - 425 , 425 - 450 , 450 - 475 , 475 - 500 , 500 - 525 , 525 - 550 , 550 - 575 , 575 - 600 , 600 - 625 , 625 - 650 , 650 - 675 , 675 - 700 , 700 - 725 , 725 - 750 , 750 - 775 , 775 - 800 , 800 - 825 , 825 - 850 , 850 - 875 , 875 - 900 , 900 - 925 , 925 - 950 , 950 - 975 , 975 - 1000 | ||
| Click To Change The Sort Order: By Market Cap or Company Size Performance: Year-to-date, Week and Day | |
| Select Chart Type: | ||
|
Best Stocks Today 12Stocks.com |
© 2025 12Stocks.com Terms & Conditions Privacy Contact Us
All Information Provided Only For Education And Not To Be Used For Investing or Trading. See Terms & Conditions


One More Thing ... Get Best Stocks Delivered Daily!
Never Ever Miss A Move With Our Top Ten Stocks Lists
Find Best Stocks In Any Market - Bull or Bear Market
Take A Peek At Our Top Ten Stocks Lists: Daily, Weekly, Year-to-Date & Top Trends
Find Best Stocks In Any Market - Bull or Bear Market
Take A Peek At Our Top Ten Stocks Lists: Daily, Weekly, Year-to-Date & Top Trends
Healthcare Stocks With Best Up Trends [0-bearish to 100-bullish]: Taysha Gene[100], DBV Technologies[100], Valneva SE[100], ClearPoint Neuro[100], Prime Medicine[100], AlloVir [100], Sarepta [100], Monopar [100], Cara [100], Absci Corp[100], Spruce Biosciences[100]
Best Healthcare Stocks Year-to-Date:
Regencell Bioscience[12636.6%], Kaleido BioSciences[9900%], Vor Biopharma[3175%], Nanobiotix ADR[581.379%], Eagle [542.857%], So-Young [395.711%], I-Mab ADR[357.506%], Monopar [337.489%], Nektar [319.84%], 908 Devices[299.543%], DBV Technologies[276.923%] Best Healthcare Stocks This Week:
Athersys [193287%], Nobilis Health[101349%], VBI Vaccines[86898.5%], ContraFect [47677.8%], Clovis Oncology[39610.5%], Endo [28369.6%], NanoString Technologies[17224.7%], Neptune Wellness[14100%], ViewRay [11470.2%], Mallkrodt [11382.1%], Achillion [10033.3%] Best Healthcare Stocks Daily:
Kaleido BioSciences[9900%], Neoleukin [332.665%], Syros [226.23%], Athenex [103.333%], Taysha Gene[53.4591%], DBV Technologies[21.6485%], Valneva SE[20.197%], ClearPoint Neuro[19.7991%], Prime Medicine[19.4097%], Accelerate Diagnostics[17.6471%], Aptose Biosciences[17.5439%]