
 Login Sign Up


| |||||
 |  | ||||

| 12Stocks.com Market Intelligence |
Best Financial Stocks
| In a hurry? Financial Stocks Lists: Performance Trends Table, Stock Charts
Sort Financial stocks: Daily, Weekly, Year-to-Date, Market Cap & Trends. Filter Financial stocks list by size:All Financial Large Mid-Range Small & MicroCap |
| 12Stocks.com Financial Stocks Performances & Trends Daily | |||||||||
|
|  The overall Smart Investing & Trading Score is 53 (0-bearish to 100-bullish) which puts Financial sector in short term neutral trend. The Smart Investing & Trading Score from previous trading session is 36 and hence an improvement of trend.
| ||||||||
Here are the Smart Investing & Trading Scores of the most requested Financial stocks at 12Stocks.com (click stock name for detailed review):
|


| 12Stocks.com: Investing in Financial sector with Stocks | |
|
The following table helps investors and traders sort through current performance and trends (as measured by Smart Investing & Trading Score) of various
stocks in the Financial sector. Quick View: Move mouse or cursor over stock symbol (ticker) to view short-term Technical chart and over stock name to view long term chart. Click on  to add stock symbol to your watchlist and to add stock symbol to your watchlist and  to view watchlist. Click on any ticker or stock name for detailed market intelligence report for that stock. to view watchlist. Click on any ticker or stock name for detailed market intelligence report for that stock. |
12Stocks.com Performance of Stocks in Financial Sector
| Ticker | Stock Name | Watchlist | Category | Recent Price | Trend Score | Change % | YTD Change% |
| NVG | Nuveen AMT-Free |   | Asset Mgmt | 11.82 | 69 | 1.20% | 0.00% |
| SBRA | Sabra Health | | REIT | 14.35 | 90 | 0.91% | 0.56% |
| ADC | Agree Realty | | Property Mgmt | 58.78 | 100 | 1.34% | -6.62% |
| MTG | MGIC | | Insurance | 20.64 | 90 | 0.63% | 7.00% |
| OZK | Bank OZK | | Regional Banks | 46.75 | 100 | 1.08% | -6.18% |
| WTM | White Mountains | | Insurance | 1802.57 | 73 | -1.23% | 19.77% |
| CEF | Sprott Physical | | Asset Mgmt | 21.19 | 54 | -0.42% | 10.65% |
| HLNE | Hamilton Lane | | Asset Mgmt | 115.67 | 77 | 0.29% | 1.97% |
| LXP | Lexington Realty | | REIT - | 8.72 | 65 | 1.40% | -12.10% |
| TCBIO | Texas Capital | | Banks - Regional | 19.80 | 69 | 3.61% | 7.08% |
| NAD | Nuveen Quality | | Investments | 11.08 | 57 | 0.82% | -3.23% |
| JXN | Jackson | | Insurance - Life | 71.21 | 100 | 0.88% | 38.54% |
| FNB | F.N.B | | Regional Banks | 13.79 | 100 | 1.10% | 0.15% |
| FHB | First Hawaiian | | Regional Banks | 21.78 | 100 | 0.41% | -4.72% |
| PHYS | Sprott Physical | | Exchange Traded Fund | 17.80 | 54 | -0.17% | 11.74% |
| INDB | Independent Bank | | Regional Banks | 51.92 | 87 | 1.15% | -21.11% |
| ONB | Old National | | Regional Banks | 17.19 | 100 | 0.94% | 1.78% |
| BOH | Bank of Hawaii | | Regional Banks | 58.86 | 69 | 0.63% | -18.77% |
| UBSI | United Bankshares | | Regional Banks | 33.96 | 67 | 0.41% | -9.56% |
| VTMX | Vesta s | | REIT - Industrial | 36.15 | 83 | 0.08% | -9.09% |
| AFGE | American | | Insurance | 19.20 | 64 | 1.19% | -1.51% |
| WAFD | Washington Federal | | S&L | 28.45 | 93 | 1.46% | -13.68% |
| EPR | EPR Properties | | REIT - Retail | 42.00 | 90 | -0.24% | -13.31% |
| UMBF | UMB | | Regional - Southwest Banks | 82.56 | 88 | 0.84% | -1.18% |
| KNSL | Kinsale Capital | | Insurance | 382.37 | 25 | 2.48% | 14.17% |
| For chart view version of above stock list: Chart View ➞ 0 - 25 , 25 - 50 , 50 - 75 , 75 - 100 , 100 - 125 , 125 - 150 , 150 - 175 , 175 - 200 , 200 - 225 , 225 - 250 , 250 - 275 , 275 - 300 , 300 - 325 , 325 - 350 , 350 - 375 , 375 - 400 , 400 - 425 , 425 - 450 , 450 - 475 , 475 - 500 , 500 - 525 , 525 - 550 , 550 - 575 , 575 - 600 , 600 - 625 , 625 - 650 , 650 - 675 , 675 - 700 , 700 - 725 , 725 - 750 , 750 - 775 , 775 - 800 , 800 - 825 , 825 - 850 , 850 - 875 , 875 - 900 , 900 - 925 , 925 - 950 , 950 - 975 , 975 - 1000 , 1000 - 1025 , 1025 - 1050 , 1050 - 1075 , 1075 - 1100 , 1100 - 1125 , 1125 - 1150 , 1150 - 1175 , 1175 - 1200 , 1200 - 1225 , 1225 - 1250 | ||
 | Click To Change The Sort Order: By Market Cap or Company Size Performance: Year-to-date, Week and Day |  |
|
Get the most comprehensive stock market coverage daily at 12Stocks.com ➞ Best Stocks Today ➞ Best Stocks Weekly ➞ Best Stocks Year-to-Date ➞ Best Stocks Trends ➞  Best Stocks Today 12Stocks.com Best Nasdaq Stocks ➞ Best S&P 500 Stocks ➞ Best Tech Stocks ➞ Best Biotech Stocks ➞ |
| Detailed Overview of Financial Stocks |
| Financial Technical Overview, Leaders & Laggards, Top Financial ETF Funds & Detailed Financial Stocks List, Charts, Trends & More |
| Financial Sector: Technical Analysis, Trends & YTD Performance | |
| Financial sector is composed of stocks
from banks, brokers, insurance, REITs
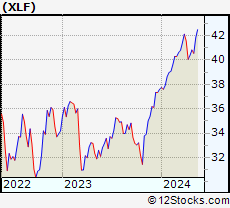
and services subsectors. Financial sector, as represented by XLF, an exchange-traded fund [ETF] that holds basket of Financial stocks (e.g, Bank of America, Goldman Sachs) is up by 7.85% and is currently outperforming the overall market by 0.97% year-to-date. Below is a quick view of Technical charts and trends: |
|
 XLF Weekly Chart |
|
| Long Term Trend: Good | |
| Medium Term Trend: Good | |
 XLF Daily Chart |
|
| Short Term Trend: Very Good | |
| Overall Trend Score: 53 | |
| YTD Performance: 7.85% | |
| **Trend Scores & Views Are Only For Educational Purposes And Not For Investing | |
| 12Stocks.com: Top Performing Financial Sector Stocks | ||||||||||||||||||||||||||||||||||||||||||||||||
 The top performing Financial sector stocks year to date are
Now, more recently, over last week, the top performing Financial sector stocks on the move are


|
||||||||||||||||||||||||||||||||||||||||||||||||
| 12Stocks.com: Investing in Financial Sector using Exchange Traded Funds | |
|
The following table shows list of key exchange traded funds (ETF) that
help investors track Financial Index. For detailed view, check out our ETF Funds section of our website. Quick View: Move mouse or cursor over ETF symbol (ticker) to view short-term Technical chart and over ETF name to view long term chart. Click on ticker or stock name for detailed view. Click on to add stock symbol to your watchlist and to view watchlist. |
12Stocks.com List of ETFs that track Financial Index
| Ticker | ETF Name | Watchlist | Recent Price | Smart Investing & Trading Score | Change % | Week % | Year-to-date % |
| XLF | Financial | | 40.55 | 53 | 0.22 | -0.66 | 7.85% |
| IAI | Broker-Dealers & Secs | | 114.27 | 95 | 0.98 | 1.11 | 5.29% |
| IYF | Financials | | 92.47 | 78 | 0.38 | 0.33 | 8.27% |
| IYG | Financial Services | | 64.09 | 60 | 0.31 | -0.8 | 7.29% |
| KRE | Regional Banking | | 49.65 | 100 | 1.29 | 3.03 | -5.3% |
| IXG | Global Financials | | 84.84 | 85 | 0.87 | 0.77 | 7.97% |
| VFH | Financials | | 98.70 | 73 | 0.34 | -0.23 | 6.98% |
| KBE | Bank | | 46.39 | 100 | 1.16 | 2.34 | 0.8% |
| FAS | Financial Bull 3X | | 98.83 | 60 | 0.95 | -1.79 | 19.58% |
| FAZ | Financial Bear 3X | | 11.08 | 17 | -0.89 | 2.03 | -18.95% |
| UYG | Financials | | 62.79 | 60 | 0.56 | -1.35 | 13.75% |
| IAT | Regional Banks | | 42.29 | 100 | 0.93 | 1.37 | 1.08% |
| KIE | Insurance | | 49.48 | 60 | 0.39 | 1.96 | 9.42% |
| PSCF | SmallCap Financials | | 47.28 | 100 | 0.77 | 1.98 | -3.86% |
| EUFN | Europe Financials | | 22.65 | 85 | 0.24 | 0.82 | 8.04% |
| PGF | Financial Preferred | | 14.85 | 64 | 1.43 | 1.92 | 1.85% |
| 12Stocks.com: Charts, Trends, Fundamental Data and Performances of Financial Stocks | |
|
We now take in-depth look at all Financial stocks including charts, multi-period performances and overall trends (as measured by Smart Investing & Trading Score). One can sort Financial stocks (click link to choose) by Daily, Weekly and by Year-to-Date performances. Also, one can sort by size of the company or by market capitalization. |
| Select Your Default Chart Type: | |||||
| |||||
| Click on stock symbol or name for detailed view. Click on to add stock symbol to your watchlist and to view watchlist. Quick View: Move mouse or cursor over "Daily" to quickly view daily Technical stock chart and over "Weekly" to view weekly Technical stock chart. | |||||

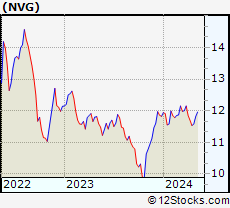 | NVG Nuveen AMT-Free Municipal Credit Income Fund |
| Sector: Financials | |
| SubSector: Asset Management | |
| MarketCap: 2612.93 Millions | |
| Recent Price: 11.82 Smart Investing & Trading Score: 69 | |
| Day Percent Change: 1.20% Day Change: 0.14 | |
| Week Change: 2.07% Year-to-date Change: 0.0% | |
| NVG Links: Profile News Message Board | |
| Charts:- Daily , Weekly | |
| Add NVG to Watchlist: View: Get Complete NVG Trend Analysis ➞ | |
 | SBRA Sabra Health Care REIT, Inc. |
| Sector: Financials | |
| SubSector: REIT - Healthcare Facilities | |
| MarketCap: 2576.54 Millions | |
| Recent Price: 14.35 Smart Investing & Trading Score: 90 | |
| Day Percent Change: 0.91% Day Change: 0.13 | |
| Week Change: 2.94% Year-to-date Change: 0.6% | |
| SBRA Links: Profile News Message Board | |
| Charts:- Daily , Weekly | |
| Add SBRA to Watchlist: View: Get Complete SBRA Trend Analysis ➞ | |
 | ADC Agree Realty Corporation |
| Sector: Financials | |
| SubSector: Property Management | |
| MarketCap: 2573.82 Millions | |
| Recent Price: 58.78 Smart Investing & Trading Score: 100 | |
| Day Percent Change: 1.34% Day Change: 0.78 | |
| Week Change: 1.75% Year-to-date Change: -6.6% | |
| ADC Links: Profile News Message Board | |
| Charts:- Daily , Weekly | |
| Add ADC to Watchlist: View: Get Complete ADC Trend Analysis ➞ | |
 | MTG MGIC Investment Corporation |
| Sector: Financials | |
| SubSector: Property & Casualty Insurance | |
| MarketCap: 2521.62 Millions | |
| Recent Price: 20.64 Smart Investing & Trading Score: 90 | |
| Day Percent Change: 0.63% Day Change: 0.13 | |
| Week Change: 0.78% Year-to-date Change: 7.0% | |
| MTG Links: Profile News Message Board | |
| Charts:- Daily , Weekly | |
| Add MTG to Watchlist: View: Get Complete MTG Trend Analysis ➞ | |
 | OZK Bank OZK |
| Sector: Financials | |
| SubSector: Regional - Southeast Banks | |
| MarketCap: 2518.35 Millions | |
| Recent Price: 46.75 Smart Investing & Trading Score: 100 | |
| Day Percent Change: 1.08% Day Change: 0.50 | |
| Week Change: 1.59% Year-to-date Change: -6.2% | |
| OZK Links: Profile News Message Board | |
| Charts:- Daily , Weekly | |
| Add OZK to Watchlist: View: Get Complete OZK Trend Analysis ➞ | |
 | WTM White Mountains Insurance Group, Ltd. |
| Sector: Financials | |
| SubSector: Property & Casualty Insurance | |
| MarketCap: 2502.62 Millions | |
| Recent Price: 1802.57 Smart Investing & Trading Score: 73 | |
| Day Percent Change: -1.23% Day Change: -22.43 | |
| Week Change: 1.93% Year-to-date Change: 19.8% | |
| WTM Links: Profile News Message Board | |
| Charts:- Daily , Weekly | |
| Add WTM to Watchlist: View: Get Complete WTM Trend Analysis ➞ | |
 | CEF Sprott Physical Gold and Silver Trust |
| Sector: Financials | |
| SubSector: Asset Management | |
| MarketCap: 2485.33 Millions | |
| Recent Price: 21.19 Smart Investing & Trading Score: 54 | |
| Day Percent Change: -0.42% Day Change: -0.09 | |
| Week Change: -2.08% Year-to-date Change: 10.7% | |
| CEF Links: Profile News Message Board | |
| Charts:- Daily , Weekly | |
| Add CEF to Watchlist: View: Get Complete CEF Trend Analysis ➞ | |
 | HLNE Hamilton Lane Incorporated |
| Sector: Financials | |
| SubSector: Asset Management | |
| MarketCap: 2484.13 Millions | |
| Recent Price: 115.67 Smart Investing & Trading Score: 77 | |
| Day Percent Change: 0.29% Day Change: 0.34 | |
| Week Change: 1% Year-to-date Change: 2.0% | |
| HLNE Links: Profile News Message Board | |
| Charts:- Daily , Weekly | |
| Add HLNE to Watchlist: View: Get Complete HLNE Trend Analysis ➞ | |
 | LXP Lexington Realty Trust |
| Sector: Financials | |
| SubSector: REIT - Diversified | |
| MarketCap: 2483.43 Millions | |
| Recent Price: 8.72 Smart Investing & Trading Score: 65 | |
| Day Percent Change: 1.40% Day Change: 0.12 | |
| Week Change: 2.83% Year-to-date Change: -12.1% | |
| LXP Links: Profile News Message Board | |
| Charts:- Daily , Weekly | |
| Add LXP to Watchlist: View: Get Complete LXP Trend Analysis ➞ | |
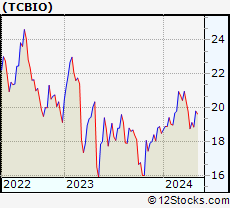 | TCBIO Texas Capital Bancshares, Inc. |
| Sector: Financials | |
| SubSector: Banks - Regional | |
| MarketCap: 2470 Millions | |
| Recent Price: 19.80 Smart Investing & Trading Score: 69 | |
| Day Percent Change: 3.61% Day Change: 0.69 | |
| Week Change: 4.98% Year-to-date Change: 7.1% | |
| TCBIO Links: Profile News Message Board | |
| Charts:- Daily , Weekly | |
| Add TCBIO to Watchlist: View: Get Complete TCBIO Trend Analysis ➞ | |
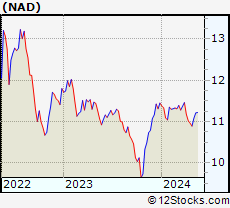 | NAD Nuveen Quality Municipal Income Fund |
| Sector: Financials | |
| SubSector: Diversified Investments | |
| MarketCap: 2464.7 Millions | |
| Recent Price: 11.08 Smart Investing & Trading Score: 57 | |
| Day Percent Change: 0.82% Day Change: 0.09 | |
| Week Change: 1.74% Year-to-date Change: -3.2% | |
| NAD Links: Profile News Message Board | |
| Charts:- Daily , Weekly | |
| Add NAD to Watchlist: View: Get Complete NAD Trend Analysis ➞ | |
 | JXN Jackson Financial Inc. |
| Sector: Financials | |
| SubSector: Insurance - Life | |
| MarketCap: 2460 Millions | |
| Recent Price: 71.21 Smart Investing & Trading Score: 100 | |
| Day Percent Change: 0.88% Day Change: 0.62 | |
| Week Change: 2.37% Year-to-date Change: 38.5% | |
| JXN Links: Profile News Message Board | |
| Charts:- Daily , Weekly | |
| Add JXN to Watchlist: View: Get Complete JXN Trend Analysis ➞ | |
 | FNB F.N.B. Corporation |
| Sector: Financials | |
| SubSector: Regional - Southeast Banks | |
| MarketCap: 2445.55 Millions | |
| Recent Price: 13.79 Smart Investing & Trading Score: 100 | |
| Day Percent Change: 1.10% Day Change: 0.15 | |
| Week Change: 0.36% Year-to-date Change: 0.2% | |
| FNB Links: Profile News Message Board | |
| Charts:- Daily , Weekly | |
| Add FNB to Watchlist: View: Get Complete FNB Trend Analysis ➞ | |
 | FHB First Hawaiian, Inc. |
| Sector: Financials | |
| SubSector: Regional - Pacific Banks | |
| MarketCap: 2398.99 Millions | |
| Recent Price: 21.78 Smart Investing & Trading Score: 100 | |
| Day Percent Change: 0.41% Day Change: 0.09 | |
| Week Change: -0.5% Year-to-date Change: -4.7% | |
| FHB Links: Profile News Message Board | |
| Charts:- Daily , Weekly | |
| Add FHB to Watchlist: View: Get Complete FHB Trend Analysis ➞ | |
 | PHYS Sprott Physical Gold Trust |
| Sector: Financials | |
| SubSector: Exchange Traded Fund | |
| MarketCap: 2365.21 Millions | |
| Recent Price: 17.80 Smart Investing & Trading Score: 54 | |
| Day Percent Change: -0.17% Day Change: -0.03 | |
| Week Change: -1.87% Year-to-date Change: 11.7% | |
| PHYS Links: Profile News Message Board | |
| Charts:- Daily , Weekly | |
| Add PHYS to Watchlist: View: Get Complete PHYS Trend Analysis ➞ | |
 | INDB Independent Bank Corp. |
| Sector: Financials | |
| SubSector: Regional - Northeast Banks | |
| MarketCap: 2347.09 Millions | |
| Recent Price: 51.92 Smart Investing & Trading Score: 87 | |
| Day Percent Change: 1.15% Day Change: 0.59 | |
| Week Change: -1.54% Year-to-date Change: -21.1% | |
| INDB Links: Profile News Message Board | |
| Charts:- Daily , Weekly | |
| Add INDB to Watchlist: View: Get Complete INDB Trend Analysis ➞ | |
 | ONB Old National Bancorp |
| Sector: Financials | |
| SubSector: Regional - Midwest Banks | |
| MarketCap: 2340.8 Millions | |
| Recent Price: 17.19 Smart Investing & Trading Score: 100 | |
| Day Percent Change: 0.94% Day Change: 0.16 | |
| Week Change: 3.74% Year-to-date Change: 1.8% | |
| ONB Links: Profile News Message Board | |
| Charts:- Daily , Weekly | |
| Add ONB to Watchlist: View: Get Complete ONB Trend Analysis ➞ | |
 | BOH Bank of Hawaii Corporation |
| Sector: Financials | |
| SubSector: Regional - Pacific Banks | |
| MarketCap: 2305.19 Millions | |
| Recent Price: 58.86 Smart Investing & Trading Score: 69 | |
| Day Percent Change: 0.63% Day Change: 0.37 | |
| Week Change: 0.39% Year-to-date Change: -18.8% | |
| BOH Links: Profile News Message Board | |
| Charts:- Daily , Weekly | |
| Add BOH to Watchlist: View: Get Complete BOH Trend Analysis ➞ | |
 | UBSI United Bankshares, Inc. |
| Sector: Financials | |
| SubSector: Regional - Mid-Atlantic Banks | |
| MarketCap: 2286.79 Millions | |
| Recent Price: 33.96 Smart Investing & Trading Score: 67 | |
| Day Percent Change: 0.41% Day Change: 0.14 | |
| Week Change: 1.83% Year-to-date Change: -9.6% | |
| UBSI Links: Profile News Message Board | |
| Charts:- Daily , Weekly | |
| Add UBSI to Watchlist: View: Get Complete UBSI Trend Analysis ➞ | |
 | VTMX Vesta Financials Corp SAB de CV |
| Sector: Financials | |
| SubSector: REIT - Industrial | |
| MarketCap: 2270 Millions | |
| Recent Price: 36.15 Smart Investing & Trading Score: 83 | |
| Day Percent Change: 0.08% Day Change: 0.03 | |
| Week Change: -0.17% Year-to-date Change: -9.1% | |
| VTMX Links: Profile News Message Board | |
| Charts:- Daily , Weekly | |
| Add VTMX to Watchlist: View: Get Complete VTMX Trend Analysis ➞ | |
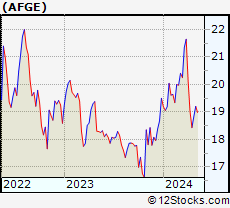 | AFGE American Financial Group, Inc. |
| Sector: Financials | |
| SubSector: Property & Casualty Insurance | |
| MarketCap: 2239.66 Millions | |
| Recent Price: 19.20 Smart Investing & Trading Score: 64 | |
| Day Percent Change: 1.19% Day Change: 0.22 | |
| Week Change: 1.99% Year-to-date Change: -1.5% | |
| AFGE Links: Profile News Message Board | |
| Charts:- Daily , Weekly | |
| Add AFGE to Watchlist: View: Get Complete AFGE Trend Analysis ➞ | |
 | WAFD Washington Federal, Inc. |
| Sector: Financials | |
| SubSector: Savings & Loans | |
| MarketCap: 2219.2 Millions | |
| Recent Price: 28.45 Smart Investing & Trading Score: 93 | |
| Day Percent Change: 1.46% Day Change: 0.41 | |
| Week Change: 1.93% Year-to-date Change: -13.7% | |
| WAFD Links: Profile News Message Board | |
| Charts:- Daily , Weekly | |
| Add WAFD to Watchlist: View: Get Complete WAFD Trend Analysis ➞ | |
 | EPR EPR Properties |
| Sector: Financials | |
| SubSector: REIT - Retail | |
| MarketCap: 2217.64 Millions | |
| Recent Price: 42.00 Smart Investing & Trading Score: 90 | |
| Day Percent Change: -0.24% Day Change: -0.10 | |
| Week Change: 2.46% Year-to-date Change: -13.3% | |
| EPR Links: Profile News Message Board | |
| Charts:- Daily , Weekly | |
| Add EPR to Watchlist: View: Get Complete EPR Trend Analysis ➞ | |
 | UMBF UMB Financial Corporation |
| Sector: Financials | |
| SubSector: Regional - Southwest Banks | |
| MarketCap: 2207.35 Millions | |
| Recent Price: 82.56 Smart Investing & Trading Score: 88 | |
| Day Percent Change: 0.84% Day Change: 0.69 | |
| Week Change: -0.73% Year-to-date Change: -1.2% | |
| UMBF Links: Profile News Message Board | |
| Charts:- Daily , Weekly | |
| Add UMBF to Watchlist: View: Get Complete UMBF Trend Analysis ➞ | |
 | KNSL Kinsale Capital Group, Inc. |
| Sector: Financials | |
| SubSector: Property & Casualty Insurance | |
| MarketCap: 2198.12 Millions | |
| Recent Price: 382.37 Smart Investing & Trading Score: 25 | |
| Day Percent Change: 2.48% Day Change: 9.26 | |
| Week Change: 2.06% Year-to-date Change: 14.2% | |
| KNSL Links: Profile News Message Board | |
| Charts:- Daily , Weekly | |
| Add KNSL to Watchlist: View: Get Complete KNSL Trend Analysis ➞ | |
| For tabular summary view of above stock list: Summary View ➞ 0 - 25 , 25 - 50 , 50 - 75 , 75 - 100 , 100 - 125 , 125 - 150 , 150 - 175 , 175 - 200 , 200 - 225 , 225 - 250 , 250 - 275 , 275 - 300 , 300 - 325 , 325 - 350 , 350 - 375 , 375 - 400 , 400 - 425 , 425 - 450 , 450 - 475 , 475 - 500 , 500 - 525 , 525 - 550 , 550 - 575 , 575 - 600 , 600 - 625 , 625 - 650 , 650 - 675 , 675 - 700 , 700 - 725 , 725 - 750 , 750 - 775 , 775 - 800 , 800 - 825 , 825 - 850 , 850 - 875 , 875 - 900 , 900 - 925 , 925 - 950 , 950 - 975 , 975 - 1000 , 1000 - 1025 , 1025 - 1050 , 1050 - 1075 , 1075 - 1100 , 1100 - 1125 , 1125 - 1150 , 1150 - 1175 , 1175 - 1200 , 1200 - 1225 , 1225 - 1250 | ||
| Click To Change The Sort Order: By Market Cap or Company Size Performance: Year-to-date, Week and Day | |
| Select Chart Type: | ||
|
Best Stocks Today 12Stocks.com |
© 2024 12Stocks.com Terms & Conditions Privacy Contact Us
All Information Provided Only For Education And Not To Be Used For Investing or Trading. See Terms & Conditions


One More Thing ... Get Best Stocks Delivered Daily!
Never Ever Miss A Move With Our Top Ten Stocks Lists
Find Best Stocks In Any Market - Bull or Bear Market
Take A Peek At Our Top Ten Stocks Lists: Daily, Weekly, Year-to-Date & Top Trends
Find Best Stocks In Any Market - Bull or Bear Market
Take A Peek At Our Top Ten Stocks Lists: Daily, Weekly, Year-to-Date & Top Trends
Financial Stocks With Best Up Trends [0-bearish to 100-bullish]: Siebert [100], Office Properties[100], Banco BBVA[100], AG Mortgage[100], Grupo Financiero[100], Banco Macro[100], Global X[100], Grupo Supervielle[100], Reinsurance [100], Camden Property[100], Noah [100]
Best Financial Stocks Year-to-Date:
Root [436.68%], Banco Macro[109.83%], Hippo [103.4%], Gladstone Capital[100.28%], Grupo Financiero[98.78%], Banco BBVA[92.83%], EverQuote [77.7%], Grupo Supervielle[69.21%], Yiren Digital[66.99%], LendingTree [62.96%], Lufax Holding[53.09%] Best Financial Stocks This Week:
Office Properties[42.79%], LendingTree [30.37%], SelectQuote [26.71%], Heartland [23.01%], Industrial Logistics[20.39%], New York[18.86%], KE [17.8%], Banco Macro[17.21%], Douglas Elliman[16.39%], Siebert [14.85%], eXp World[14.82%] Best Financial Stocks Daily:
Siebert [17.17%], SelectQuote [13.33%], Office Properties[12.11%], Banco BBVA[9.27%], Oportun [9.01%], AG Mortgage[8.85%], Diversified Healthcare[8.26%], RE/MAX [7.68%], Grupo Financiero[7.62%], Banco Macro[7.32%], Xenia Hotels[7.01%]