
 Login Sign Up


| |||||
 |  | ||||

| 12Stocks.com Market Intelligence |
Best Financial Stocks
| In a hurry? Financial Stocks Lists: Performance Trends Table, Stock Charts
Sort Financial stocks: Daily, Weekly, Year-to-Date, Market Cap & Trends. Filter Financial stocks list by size:All Financial Large Mid-Range Small & MicroCap |
| 12Stocks.com Financial Stocks Performances & Trends Daily | |||||||||
|
|  The overall Smart Investing & Trading Score is 53 (0-bearish to 100-bullish) which puts Financial sector in short term neutral trend. The Smart Investing & Trading Score from previous trading session is 36 and hence an improvement of trend.
| ||||||||
Here are the Smart Investing & Trading Scores of the most requested Financial stocks at 12Stocks.com (click stock name for detailed review):
|


| 12Stocks.com: Investing in Financial sector with Stocks | |
|
The following table helps investors and traders sort through current performance and trends (as measured by Smart Investing & Trading Score) of various
stocks in the Financial sector. Quick View: Move mouse or cursor over stock symbol (ticker) to view short-term Technical chart and over stock name to view long term chart. Click on  to add stock symbol to your watchlist and to add stock symbol to your watchlist and  to view watchlist. Click on any ticker or stock name for detailed market intelligence report for that stock. to view watchlist. Click on any ticker or stock name for detailed market intelligence report for that stock. |
12Stocks.com Performance of Stocks in Financial Sector
| Ticker | Stock Name | Watchlist | Category | Recent Price | Trend Score | Change % | YTD Change% |
| AJG | Arthur J. |   | Insurance | 238.72 | 57 | 0.08% | 6.15% |
| DB | Deutsche Bank | | Foreign Banks | 16.47 | 83 | 1.73% | 21.55% |
| MTB | M&T Bank | | Regional Banks | 146.58 | 90 | 0.21% | 6.93% |
| BXP | Boston Properties | | REIT - Office | 60.78 | 30 | 1.18% | -13.38% |
| EFX | Equifax | | Credit Services | 227.05 | 39 | 1.14% | -8.18% |
| ESS | Essex Property | | REIT | 250.31 | 95 | 0.20% | 0.96% |
| CINF | Cinnati | | Insurance | 116.94 | 56 | 0.67% | 13.03% |
| AMP | Ameriprise | | Asset Mgmt | 418.95 | 73 | 0.59% | 10.30% |
| XP | XP | | Asset Mgmt | 22.39 | 49 | 5.96% | -14.12% |
| CBRE | CBRE | | Property Mgmt | 86.61 | 25 | -0.21% | -6.96% |
| APO | Apollo Global | | Investments | 109.46 | 30 | -2.33% | 17.46% |
| HIG | Hartford | | Insurance | 97.90 | 59 | 0.42% | 21.80% |
| AI | C3.ai | | REIT Mortgage | 24.04 | 64 | 3.84% | -16.27% |
| MKTX | MarketAxess | | Brokerage | 203.82 | 47 | -2.53% | -30.40% |
| MKL | Markel | | Insurance | 1581.06 | 100 | 0.29% | 11.35% |
| ACGL | Arch Capital | | Insurance | 94.41 | 73 | -0.80% | 27.12% |
| BSBK | Bogota | | Banks Regional | 6.83 | 60 | 2.55% | -15.05% |
| VEL | Velocity | | Mortgage Finance | 17.33 | 85 | -0.06% | 4.27% |
| BAP | Credicorp | | Banks | 168.64 | 52 | 2.38% | 12.48% |
| SLMBP | SLM | | Credit Services | 76.50 | 48 | 0.16% | 15.65% |
| RYAN | Ryan Specialty | | Insurance - Specialty | 51.50 | 52 | -2.57% | 19.63% |
| MAA | Mid-America Apartment | | REIT | 133.00 | 100 | 1.00% | -1.09% |
| SUI | Sun Communities | | REIT | 117.30 | 32 | 0.57% | -12.23% |
| EXR | Extra Space | | REIT - Industrial | 141.87 | 87 | 1.49% | -11.51% |
| VTR | Ventas | | REIT | 46.79 | 100 | 1.23% | -6.12% |
| For chart view version of above stock list: Chart View ➞ 0 - 25 , 25 - 50 , 50 - 75 , 75 - 100 , 100 - 125 , 125 - 150 , 150 - 175 , 175 - 200 , 200 - 225 , 225 - 250 , 250 - 275 , 275 - 300 , 300 - 325 , 325 - 350 , 350 - 375 , 375 - 400 , 400 - 425 , 425 - 450 , 450 - 475 , 475 - 500 , 500 - 525 , 525 - 550 , 550 - 575 , 575 - 600 , 600 - 625 , 625 - 650 , 650 - 675 , 675 - 700 , 700 - 725 , 725 - 750 , 750 - 775 , 775 - 800 , 800 - 825 , 825 - 850 , 850 - 875 , 875 - 900 , 900 - 925 , 925 - 950 , 950 - 975 , 975 - 1000 , 1000 - 1025 , 1025 - 1050 , 1050 - 1075 , 1075 - 1100 , 1100 - 1125 , 1125 - 1150 , 1150 - 1175 , 1175 - 1200 , 1200 - 1225 , 1225 - 1250 | ||
 | Click To Change The Sort Order: By Market Cap or Company Size Performance: Year-to-date, Week and Day |  |
|
Get the most comprehensive stock market coverage daily at 12Stocks.com ➞ Best Stocks Today ➞ Best Stocks Weekly ➞ Best Stocks Year-to-Date ➞ Best Stocks Trends ➞  Best Stocks Today 12Stocks.com Best Nasdaq Stocks ➞ Best S&P 500 Stocks ➞ Best Tech Stocks ➞ Best Biotech Stocks ➞ |
| Detailed Overview of Financial Stocks |
| Financial Technical Overview, Leaders & Laggards, Top Financial ETF Funds & Detailed Financial Stocks List, Charts, Trends & More |
| Financial Sector: Technical Analysis, Trends & YTD Performance | |
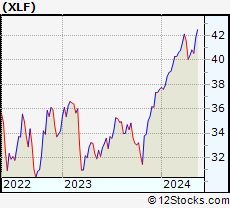
| Financial sector is composed of stocks
from banks, brokers, insurance, REITs
and services subsectors. Financial sector, as represented by XLF, an exchange-traded fund [ETF] that holds basket of Financial stocks (e.g, Bank of America, Goldman Sachs) is up by 7.85% and is currently outperforming the overall market by 0.97% year-to-date. Below is a quick view of Technical charts and trends: |
|
 XLF Weekly Chart |
|
| Long Term Trend: Good | |
| Medium Term Trend: Good | |
 XLF Daily Chart |
|
| Short Term Trend: Very Good | |
| Overall Trend Score: 53 | |
| YTD Performance: 7.85% | |
| **Trend Scores & Views Are Only For Educational Purposes And Not For Investing | |
| 12Stocks.com: Top Performing Financial Sector Stocks | ||||||||||||||||||||||||||||||||||||||||||||||||
 The top performing Financial sector stocks year to date are
Now, more recently, over last week, the top performing Financial sector stocks on the move are


|
||||||||||||||||||||||||||||||||||||||||||||||||
| 12Stocks.com: Investing in Financial Sector using Exchange Traded Funds | |
|
The following table shows list of key exchange traded funds (ETF) that
help investors track Financial Index. For detailed view, check out our ETF Funds section of our website. Quick View: Move mouse or cursor over ETF symbol (ticker) to view short-term Technical chart and over ETF name to view long term chart. Click on ticker or stock name for detailed view. Click on to add stock symbol to your watchlist and to view watchlist. |
12Stocks.com List of ETFs that track Financial Index
| Ticker | ETF Name | Watchlist | Recent Price | Smart Investing & Trading Score | Change % | Week % | Year-to-date % |
| XLF | Financial | | 40.55 | 53 | 0.22 | -0.66 | 7.85% |
| IAI | Broker-Dealers & Secs | | 114.27 | 95 | 0.98 | 1.11 | 5.29% |
| IYF | Financials | | 92.47 | 78 | 0.38 | 0.33 | 8.27% |
| IYG | Financial Services | | 64.09 | 60 | 0.31 | -0.8 | 7.29% |
| KRE | Regional Banking | | 49.65 | 100 | 1.29 | 3.03 | -5.3% |
| IXG | Global Financials | | 84.84 | 85 | 0.87 | 0.77 | 7.97% |
| VFH | Financials | | 98.70 | 73 | 0.34 | -0.23 | 6.98% |
| KBE | Bank | | 46.39 | 100 | 1.16 | 2.34 | 0.8% |
| FAS | Financial Bull 3X | | 98.83 | 60 | 0.95 | -1.79 | 19.58% |
| FAZ | Financial Bear 3X | | 11.08 | 17 | -0.89 | 2.03 | -18.95% |
| UYG | Financials | | 62.79 | 60 | 0.56 | -1.35 | 13.75% |
| IAT | Regional Banks | | 42.29 | 100 | 0.93 | 1.37 | 1.08% |
| KIE | Insurance | | 49.48 | 60 | 0.39 | 1.96 | 9.42% |
| PSCF | SmallCap Financials | | 47.28 | 100 | 0.77 | 1.98 | -3.86% |
| EUFN | Europe Financials | | 22.65 | 85 | 0.24 | 0.82 | 8.04% |
| PGF | Financial Preferred | | 14.85 | 64 | 1.43 | 1.92 | 1.85% |
| 12Stocks.com: Charts, Trends, Fundamental Data and Performances of Financial Stocks | |
|
We now take in-depth look at all Financial stocks including charts, multi-period performances and overall trends (as measured by Smart Investing & Trading Score). One can sort Financial stocks (click link to choose) by Daily, Weekly and by Year-to-Date performances. Also, one can sort by size of the company or by market capitalization. |
| Select Your Default Chart Type: | |||||
| |||||
| Click on stock symbol or name for detailed view. Click on to add stock symbol to your watchlist and to view watchlist. Quick View: Move mouse or cursor over "Daily" to quickly view daily Technical stock chart and over "Weekly" to view weekly Technical stock chart. | |||||

 | AJG Arthur J. Gallagher & Co. |
| Sector: Financials | |
| SubSector: Insurance Brokers | |
| MarketCap: 14852.2 Millions | |
| Recent Price: 238.72 Smart Investing & Trading Score: 57 | |
| Day Percent Change: 0.08% Day Change: 0.18 | |
| Week Change: 1.97% Year-to-date Change: 6.2% | |
| AJG Links: Profile News Message Board | |
| Charts:- Daily , Weekly | |
| Add AJG to Watchlist: View: Get Complete AJG Trend Analysis ➞ | |
 | DB Deutsche Bank Aktiengesellschaft |
| Sector: Financials | |
| SubSector: Foreign Regional Banks | |
| MarketCap: 14500.5 Millions | |
| Recent Price: 16.47 Smart Investing & Trading Score: 83 | |
| Day Percent Change: 1.73% Day Change: 0.28 | |
| Week Change: -7.32% Year-to-date Change: 21.6% | |
| DB Links: Profile News Message Board | |
| Charts:- Daily , Weekly | |
| Add DB to Watchlist: View: Get Complete DB Trend Analysis ➞ | |
 | MTB M&T Bank Corporation |
| Sector: Financials | |
| SubSector: Regional - Northeast Banks | |
| MarketCap: 13950.9 Millions | |
| Recent Price: 146.58 Smart Investing & Trading Score: 90 | |
| Day Percent Change: 0.21% Day Change: 0.31 | |
| Week Change: 0.14% Year-to-date Change: 6.9% | |
| MTB Links: Profile News Message Board | |
| Charts:- Daily , Weekly | |
| Add MTB to Watchlist: View: Get Complete MTB Trend Analysis ➞ | |
 | BXP Boston Properties, Inc. |
| Sector: Financials | |
| SubSector: REIT - Office | |
| MarketCap: 13788.6 Millions | |
| Recent Price: 60.78 Smart Investing & Trading Score: 30 | |
| Day Percent Change: 1.18% Day Change: 0.71 | |
| Week Change: -1.19% Year-to-date Change: -13.4% | |
| BXP Links: Profile News Message Board | |
| Charts:- Daily , Weekly | |
| Add BXP to Watchlist: View: Get Complete BXP Trend Analysis ➞ | |
 | EFX Equifax Inc. |
| Sector: Financials | |
| SubSector: Credit Services | |
| MarketCap: 13754.6 Millions | |
| Recent Price: 227.05 Smart Investing & Trading Score: 39 | |
| Day Percent Change: 1.14% Day Change: 2.55 | |
| Week Change: 1.62% Year-to-date Change: -8.2% | |
| EFX Links: Profile News Message Board | |
| Charts:- Daily , Weekly | |
| Add EFX to Watchlist: View: Get Complete EFX Trend Analysis ➞ | |
 | ESS Essex Property Trust, Inc. |
| Sector: Financials | |
| SubSector: REIT - Residential | |
| MarketCap: 13725.5 Millions | |
| Recent Price: 250.31 Smart Investing & Trading Score: 95 | |
| Day Percent Change: 0.20% Day Change: 0.51 | |
| Week Change: 1.37% Year-to-date Change: 1.0% | |
| ESS Links: Profile News Message Board | |
| Charts:- Daily , Weekly | |
| Add ESS to Watchlist: View: Get Complete ESS Trend Analysis ➞ | |
 | CINF Cincinnati Financial Corporation |
| Sector: Financials | |
| SubSector: Property & Casualty Insurance | |
| MarketCap: 13637 Millions | |
| Recent Price: 116.94 Smart Investing & Trading Score: 56 | |
| Day Percent Change: 0.67% Day Change: 0.78 | |
| Week Change: 5.47% Year-to-date Change: 13.0% | |
| CINF Links: Profile News Message Board | |
| Charts:- Daily , Weekly | |
| Add CINF to Watchlist: View: Get Complete CINF Trend Analysis ➞ | |
 | AMP Ameriprise Financial, Inc. |
| Sector: Financials | |
| SubSector: Asset Management | |
| MarketCap: 13270.5 Millions | |
| Recent Price: 418.95 Smart Investing & Trading Score: 73 | |
| Day Percent Change: 0.59% Day Change: 2.47 | |
| Week Change: 2.18% Year-to-date Change: 10.3% | |
| AMP Links: Profile News Message Board | |
| Charts:- Daily , Weekly | |
| Add AMP to Watchlist: View: Get Complete AMP Trend Analysis ➞ | |
 | XP XP Inc. |
| Sector: Financials | |
| SubSector: Asset Management | |
| MarketCap: 12990.3 Millions | |
| Recent Price: 22.39 Smart Investing & Trading Score: 49 | |
| Day Percent Change: 5.96% Day Change: 1.26 | |
| Week Change: 6.32% Year-to-date Change: -14.1% | |
| XP Links: Profile News Message Board | |
| Charts:- Daily , Weekly | |
| Add XP to Watchlist: View: Get Complete XP Trend Analysis ➞ | |
 | CBRE CBRE Group, Inc. |
| Sector: Financials | |
| SubSector: Property Management | |
| MarketCap: 12799.2 Millions | |
| Recent Price: 86.61 Smart Investing & Trading Score: 25 | |
| Day Percent Change: -0.21% Day Change: -0.18 | |
| Week Change: -0.82% Year-to-date Change: -7.0% | |
| CBRE Links: Profile News Message Board | |
| Charts:- Daily , Weekly | |
| Add CBRE to Watchlist: View: Get Complete CBRE Trend Analysis ➞ | |
 | APO Apollo Global Management, Inc. |
| Sector: Financials | |
| SubSector: Diversified Investments | |
| MarketCap: 12706 Millions | |
| Recent Price: 109.46 Smart Investing & Trading Score: 30 | |
| Day Percent Change: -2.33% Day Change: -2.61 | |
| Week Change: -2.46% Year-to-date Change: 17.5% | |
| APO Links: Profile News Message Board | |
| Charts:- Daily , Weekly | |
| Add APO to Watchlist: View: Get Complete APO Trend Analysis ➞ | |
 | HIG The Hartford Financial Services Group, Inc. |
| Sector: Financials | |
| SubSector: Property & Casualty Insurance | |
| MarketCap: 12582.8 Millions | |
| Recent Price: 97.90 Smart Investing & Trading Score: 59 | |
| Day Percent Change: 0.42% Day Change: 0.41 | |
| Week Change: 2.73% Year-to-date Change: 21.8% | |
| HIG Links: Profile News Message Board | |
| Charts:- Daily , Weekly | |
| Add HIG to Watchlist: View: Get Complete HIG Trend Analysis ➞ | |
 | AI C3.ai, Inc. |
| Sector: Financials | |
| SubSector: REIT Mortgage | |
| MarketCap: 12467 Millions | |
| Recent Price: 24.04 Smart Investing & Trading Score: 64 | |
| Day Percent Change: 3.84% Day Change: 0.89 | |
| Week Change: 5.3% Year-to-date Change: -16.3% | |
| AI Links: Profile News Message Board | |
| Charts:- Daily , Weekly | |
| Add AI to Watchlist: View: Get Complete AI Trend Analysis ➞ | |
 | MKTX MarketAxess Holdings Inc. |
| Sector: Financials | |
| SubSector: Investment Brokerage - National | |
| MarketCap: 12431.5 Millions | |
| Recent Price: 203.82 Smart Investing & Trading Score: 47 | |
| Day Percent Change: -2.53% Day Change: -5.30 | |
| Week Change: 1.01% Year-to-date Change: -30.4% | |
| MKTX Links: Profile News Message Board | |
| Charts:- Daily , Weekly | |
| Add MKTX to Watchlist: View: Get Complete MKTX Trend Analysis ➞ | |
 | MKL Markel Corporation |
| Sector: Financials | |
| SubSector: Property & Casualty Insurance | |
| MarketCap: 12405.9 Millions | |
| Recent Price: 1581.06 Smart Investing & Trading Score: 100 | |
| Day Percent Change: 0.29% Day Change: 4.51 | |
| Week Change: 10.06% Year-to-date Change: 11.4% | |
| MKL Links: Profile News Message Board | |
| Charts:- Daily , Weekly | |
| Add MKL to Watchlist: View: Get Complete MKL Trend Analysis ➞ | |
 | ACGL Arch Capital Group Ltd. |
| Sector: Financials | |
| SubSector: Property & Casualty Insurance | |
| MarketCap: 12350.9 Millions | |
| Recent Price: 94.41 Smart Investing & Trading Score: 73 | |
| Day Percent Change: -0.80% Day Change: -0.76 | |
| Week Change: 3.86% Year-to-date Change: 27.1% | |
| ACGL Links: Profile News Message Board | |
| Charts:- Daily , Weekly | |
| Add ACGL to Watchlist: View: Get Complete ACGL Trend Analysis ➞ | |
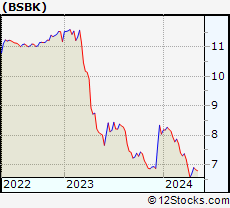 | BSBK Bogota Financial Corp. |
| Sector: Financials | |
| SubSector: Banks Regional | |
| MarketCap: 12157 Millions | |
| Recent Price: 6.83 Smart Investing & Trading Score: 60 | |
| Day Percent Change: 2.55% Day Change: 0.17 | |
| Week Change: -1.01% Year-to-date Change: -15.1% | |
| BSBK Links: Profile News Message Board | |
| Charts:- Daily , Weekly | |
| Add BSBK to Watchlist: View: Get Complete BSBK Trend Analysis ➞ | |
 | VEL Velocity Financial, Inc. |
| Sector: Financials | |
| SubSector: Mortgage Finance | |
| MarketCap: 12157 Millions | |
| Recent Price: 17.33 Smart Investing & Trading Score: 85 | |
| Day Percent Change: -0.06% Day Change: -0.01 | |
| Week Change: 1.88% Year-to-date Change: 4.3% | |
| VEL Links: Profile News Message Board | |
| Charts:- Daily , Weekly | |
| Add VEL to Watchlist: View: Get Complete VEL Trend Analysis ➞ | |
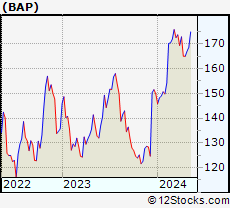 | BAP Credicorp Ltd. |
| Sector: Financials | |
| SubSector: Money Center Banks | |
| MarketCap: 11809.9 Millions | |
| Recent Price: 168.64 Smart Investing & Trading Score: 52 | |
| Day Percent Change: 2.38% Day Change: 3.92 | |
| Week Change: 0.95% Year-to-date Change: 12.5% | |
| BAP Links: Profile News Message Board | |
| Charts:- Daily , Weekly | |
| Add BAP to Watchlist: View: Get Complete BAP Trend Analysis ➞ | |
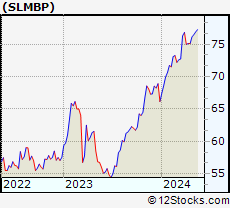 | SLMBP SLM Corporation |
| Sector: Financials | |
| SubSector: Credit Services | |
| MarketCap: 11675.8 Millions | |
| Recent Price: 76.50 Smart Investing & Trading Score: 48 | |
| Day Percent Change: 0.16% Day Change: 0.12 | |
| Week Change: 0.46% Year-to-date Change: 15.7% | |
| SLMBP Links: Profile News Message Board | |
| Charts:- Daily , Weekly | |
| Add SLMBP to Watchlist: View: Get Complete SLMBP Trend Analysis ➞ | |
 | RYAN Ryan Specialty Holdings, Inc. |
| Sector: Financials | |
| SubSector: Insurance - Specialty | |
| MarketCap: 11630 Millions | |
| Recent Price: 51.50 Smart Investing & Trading Score: 52 | |
| Day Percent Change: -2.57% Day Change: -1.36 | |
| Week Change: 5.23% Year-to-date Change: 19.6% | |
| RYAN Links: Profile News Message Board | |
| Charts:- Daily , Weekly | |
| Add RYAN to Watchlist: View: Get Complete RYAN Trend Analysis ➞ | |
 | MAA Mid-America Apartment Communities, Inc. |
| Sector: Financials | |
| SubSector: REIT - Residential | |
| MarketCap: 11385.5 Millions | |
| Recent Price: 133.00 Smart Investing & Trading Score: 100 | |
| Day Percent Change: 1.00% Day Change: 1.32 | |
| Week Change: 2.92% Year-to-date Change: -1.1% | |
| MAA Links: Profile News Message Board | |
| Charts:- Daily , Weekly | |
| Add MAA to Watchlist: View: Get Complete MAA Trend Analysis ➞ | |
 | SUI Sun Communities, Inc. |
| Sector: Financials | |
| SubSector: REIT - Residential | |
| MarketCap: 11280.5 Millions | |
| Recent Price: 117.30 Smart Investing & Trading Score: 32 | |
| Day Percent Change: 0.57% Day Change: 0.66 | |
| Week Change: -1.49% Year-to-date Change: -12.2% | |
| SUI Links: Profile News Message Board | |
| Charts:- Daily , Weekly | |
| Add SUI to Watchlist: View: Get Complete SUI Trend Analysis ➞ | |
 | EXR Extra Space Storage Inc. |
| Sector: Financials | |
| SubSector: REIT - Industrial | |
| MarketCap: 11203.9 Millions | |
| Recent Price: 141.87 Smart Investing & Trading Score: 87 | |
| Day Percent Change: 1.49% Day Change: 2.08 | |
| Week Change: 6.29% Year-to-date Change: -11.5% | |
| EXR Links: Profile News Message Board | |
| Charts:- Daily , Weekly | |
| Add EXR to Watchlist: View: Get Complete EXR Trend Analysis ➞ | |
 | VTR Ventas, Inc. |
| Sector: Financials | |
| SubSector: REIT - Healthcare Facilities | |
| MarketCap: 11180.4 Millions | |
| Recent Price: 46.79 Smart Investing & Trading Score: 100 | |
| Day Percent Change: 1.23% Day Change: 0.57 | |
| Week Change: 6.34% Year-to-date Change: -6.1% | |
| VTR Links: Profile News Message Board | |
| Charts:- Daily , Weekly | |
| Add VTR to Watchlist: View: Get Complete VTR Trend Analysis ➞ | |
| For tabular summary view of above stock list: Summary View ➞ 0 - 25 , 25 - 50 , 50 - 75 , 75 - 100 , 100 - 125 , 125 - 150 , 150 - 175 , 175 - 200 , 200 - 225 , 225 - 250 , 250 - 275 , 275 - 300 , 300 - 325 , 325 - 350 , 350 - 375 , 375 - 400 , 400 - 425 , 425 - 450 , 450 - 475 , 475 - 500 , 500 - 525 , 525 - 550 , 550 - 575 , 575 - 600 , 600 - 625 , 625 - 650 , 650 - 675 , 675 - 700 , 700 - 725 , 725 - 750 , 750 - 775 , 775 - 800 , 800 - 825 , 825 - 850 , 850 - 875 , 875 - 900 , 900 - 925 , 925 - 950 , 950 - 975 , 975 - 1000 , 1000 - 1025 , 1025 - 1050 , 1050 - 1075 , 1075 - 1100 , 1100 - 1125 , 1125 - 1150 , 1150 - 1175 , 1175 - 1200 , 1200 - 1225 , 1225 - 1250 | ||
| Click To Change The Sort Order: By Market Cap or Company Size Performance: Year-to-date, Week and Day | |
| Select Chart Type: | ||
|
Best Stocks Today 12Stocks.com |
© 2024 12Stocks.com Terms & Conditions Privacy Contact Us
All Information Provided Only For Education And Not To Be Used For Investing or Trading. See Terms & Conditions


One More Thing ... Get Best Stocks Delivered Daily!
Never Ever Miss A Move With Our Top Ten Stocks Lists
Find Best Stocks In Any Market - Bull or Bear Market
Take A Peek At Our Top Ten Stocks Lists: Daily, Weekly, Year-to-Date & Top Trends
Find Best Stocks In Any Market - Bull or Bear Market
Take A Peek At Our Top Ten Stocks Lists: Daily, Weekly, Year-to-Date & Top Trends
Financial Stocks With Best Up Trends [0-bearish to 100-bullish]: Siebert [100], Office Properties[100], Banco BBVA[100], AG Mortgage[100], Grupo Financiero[100], Banco Macro[100], Global X[100], Grupo Supervielle[100], Reinsurance [100], Camden Property[100], Noah [100]
Best Financial Stocks Year-to-Date:
Root [436.68%], Banco Macro[109.83%], Hippo [103.4%], Gladstone Capital[100.28%], Grupo Financiero[98.78%], Banco BBVA[92.83%], EverQuote [77.7%], Grupo Supervielle[69.21%], Yiren Digital[66.99%], LendingTree [62.96%], Lufax Holding[53.09%] Best Financial Stocks This Week:
Office Properties[42.79%], LendingTree [30.37%], SelectQuote [26.71%], Heartland [23.01%], Industrial Logistics[20.39%], New York[18.86%], KE [17.8%], Banco Macro[17.21%], Douglas Elliman[16.39%], Siebert [14.85%], eXp World[14.82%] Best Financial Stocks Daily:
Siebert [17.17%], SelectQuote [13.33%], Office Properties[12.11%], Banco BBVA[9.27%], Oportun [9.01%], AG Mortgage[8.85%], Diversified Healthcare[8.26%], RE/MAX [7.68%], Grupo Financiero[7.62%], Banco Macro[7.32%], Xenia Hotels[7.01%]