
 Login Sign Up


| |||||
 |  | ||||

| 12Stocks.com Market Intelligence |
Best Financial Stocks
| In a hurry? Financial Stocks Lists: Performance Trends Table, Stock Charts
Sort Financial stocks: Daily, Weekly, Year-to-Date, Market Cap & Trends. Filter Financial stocks list by size:All Financial Large Mid-Range Small & MicroCap |
| 12Stocks.com Financial Stocks Performances & Trends Daily | |||||||||
|
|  The overall Smart Investing & Trading Score is 53 (0-bearish to 100-bullish) which puts Financial sector in short term neutral trend. The Smart Investing & Trading Score from previous trading session is 36 and hence an improvement of trend.
| ||||||||
Here are the Smart Investing & Trading Scores of the most requested Financial stocks at 12Stocks.com (click stock name for detailed review):
|


| 12Stocks.com: Investing in Financial sector with Stocks | |
|
The following table helps investors and traders sort through current performance and trends (as measured by Smart Investing & Trading Score) of various
stocks in the Financial sector. Quick View: Move mouse or cursor over stock symbol (ticker) to view short-term Technical chart and over stock name to view long term chart. Click on  to add stock symbol to your watchlist and to add stock symbol to your watchlist and  to view watchlist. Click on any ticker or stock name for detailed market intelligence report for that stock. to view watchlist. Click on any ticker or stock name for detailed market intelligence report for that stock. |
12Stocks.com Performance of Stocks in Financial Sector
| Ticker | Stock Name | Watchlist | Category | Recent Price | Trend Score | Change % | YTD Change% |
| MFC | Manulife |   | Life Insurance | 24.01 | 95 | 1.31% | 8.64% |
| EQR | Equity Residential | | REIT | 65.91 | 100 | 0.53% | 7.77% |
| BSBR | Banco Santander | | Foreign Banks | 5.83 | 100 | 1.57% | -10.99% |
| CSGP | CoStar | | Property Mgmt | 91.23 | 73 | 1.64% | 4.39% |
| WELL | Welltower | | REIT | 95.81 | 78 | -0.28% | 6.25% |
| AIG | American | | Insurance | 78.48 | 88 | 0.49% | 15.84% |
| BCS | Barclays | | Foreign Banks | 10.26 | 66 | 0.10% | 30.20% |
| PRU | Prudential | | Life Insurance | 112.26 | 85 | 0.87% | 8.24% |
| AVB | AvalonBay Communities | | REIT | 192.81 | 100 | 0.19% | 2.99% |
| STT | State Street | | Asset Mgmt | 74.39 | 78 | 1.63% | -3.96% |
| SPG | Simon Property | | REIT - Retail | 142.93 | 32 | 1.11% | 0.20% |
| KKR | KKR | | Asset Mgmt | 95.01 | 39 | -2.18% | 14.68% |
| SLF | Sun Life | | Insurance | 52.48 | 64 | 0.81% | 1.20% |
| O | Realty ome | | REIT - Retail | 55.26 | 100 | 0.64% | -3.76% |
| IBKR | Interactive Brokers | | Brokerage | 120.12 | 93 | 0.27% | 44.90% |
| ARE | Alexandria Real | | REIT - Office | 120.51 | 52 | 1.98% | -4.94% |
| COIN | Coinbase Global | | Financial Data & Stock Exchanges | 223.25 | 63 | 0.38% | 29.20% |
| OWL | Blue Owl | | Asset Mgmt | 17.96 | 0 | -3.26% | 20.62% |
| HBANP | Huntington Bancshares | | Banks - Regional | 17.97 | 40 | 0.67% | 0.06% |
| HBANL | Huntington Bancshares | | Banks - Regional | 25.16 | 100 | 1.62% | 5.45% |
| HBANM | Huntington Bancshares | | Banks - Regional | 21.86 | 47 | -0.05% | 0.05% |
| IX | ORIX | | Credit Services | 104.66 | 52 | 1.01% | 12.07% |
| NTRS | Northern Trust | | Asset Mgmt | 84.62 | 93 | 1.34% | 0.28% |
| NMR | Nomura | | Brokerage | 5.82 | 58 | 1.39% | 29.05% |
| NDAQ | Nasdaq | | Investments | 60.87 | 68 | 1.33% | 4.70% |
| For chart view version of above stock list: Chart View ➞ 0 - 25 , 25 - 50 , 50 - 75 , 75 - 100 , 100 - 125 , 125 - 150 , 150 - 175 , 175 - 200 , 200 - 225 , 225 - 250 , 250 - 275 , 275 - 300 , 300 - 325 , 325 - 350 , 350 - 375 , 375 - 400 , 400 - 425 , 425 - 450 , 450 - 475 , 475 - 500 , 500 - 525 , 525 - 550 , 550 - 575 , 575 - 600 , 600 - 625 , 625 - 650 , 650 - 675 , 675 - 700 , 700 - 725 , 725 - 750 , 750 - 775 , 775 - 800 , 800 - 825 , 825 - 850 , 850 - 875 , 875 - 900 , 900 - 925 , 925 - 950 , 950 - 975 , 975 - 1000 , 1000 - 1025 , 1025 - 1050 , 1050 - 1075 , 1075 - 1100 , 1100 - 1125 , 1125 - 1150 , 1150 - 1175 , 1175 - 1200 , 1200 - 1225 , 1225 - 1250 | ||
 | Click To Change The Sort Order: By Market Cap or Company Size Performance: Year-to-date, Week and Day |  |
|
Get the most comprehensive stock market coverage daily at 12Stocks.com ➞ Best Stocks Today ➞ Best Stocks Weekly ➞ Best Stocks Year-to-Date ➞ Best Stocks Trends ➞  Best Stocks Today 12Stocks.com Best Nasdaq Stocks ➞ Best S&P 500 Stocks ➞ Best Tech Stocks ➞ Best Biotech Stocks ➞ |
| Detailed Overview of Financial Stocks |
| Financial Technical Overview, Leaders & Laggards, Top Financial ETF Funds & Detailed Financial Stocks List, Charts, Trends & More |
| Financial Sector: Technical Analysis, Trends & YTD Performance | |
| Financial sector is composed of stocks
from banks, brokers, insurance, REITs
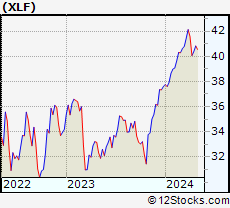
and services subsectors. Financial sector, as represented by XLF, an exchange-traded fund [ETF] that holds basket of Financial stocks (e.g, Bank of America, Goldman Sachs) is up by 7.85% and is currently outperforming the overall market by 0.97% year-to-date. Below is a quick view of Technical charts and trends: |
|
 XLF Weekly Chart |
|
| Long Term Trend: Good | |
| Medium Term Trend: Good | |
 XLF Daily Chart |
|
| Short Term Trend: Very Good | |
| Overall Trend Score: 53 | |
| YTD Performance: 7.85% | |
| **Trend Scores & Views Are Only For Educational Purposes And Not For Investing | |
| 12Stocks.com: Top Performing Financial Sector Stocks | ||||||||||||||||||||||||||||||||||||||||||||||||
 The top performing Financial sector stocks year to date are
Now, more recently, over last week, the top performing Financial sector stocks on the move are


|
||||||||||||||||||||||||||||||||||||||||||||||||
| 12Stocks.com: Investing in Financial Sector using Exchange Traded Funds | |
|
The following table shows list of key exchange traded funds (ETF) that
help investors track Financial Index. For detailed view, check out our ETF Funds section of our website. Quick View: Move mouse or cursor over ETF symbol (ticker) to view short-term Technical chart and over ETF name to view long term chart. Click on ticker or stock name for detailed view. Click on to add stock symbol to your watchlist and to view watchlist. |
12Stocks.com List of ETFs that track Financial Index
| Ticker | ETF Name | Watchlist | Recent Price | Smart Investing & Trading Score | Change % | Week % | Year-to-date % |
| XLF | Financial | | 40.55 | 53 | 0.22 | -0.66 | 7.85% |
| IAI | Broker-Dealers & Secs | | 114.27 | 95 | 0.98 | 1.11 | 5.29% |
| IYF | Financials | | 92.47 | 78 | 0.38 | 0.33 | 8.27% |
| IYG | Financial Services | | 64.09 | 60 | 0.31 | -0.8 | 7.29% |
| KRE | Regional Banking | | 49.65 | 100 | 1.29 | 3.03 | -5.3% |
| IXG | Global Financials | | 84.84 | 85 | 0.87 | 0.77 | 7.97% |
| VFH | Financials | | 98.70 | 73 | 0.34 | -0.23 | 6.98% |
| KBE | Bank | | 46.39 | 100 | 1.16 | 2.34 | 0.8% |
| FAS | Financial Bull 3X | | 98.83 | 60 | 0.95 | -1.79 | 19.58% |
| FAZ | Financial Bear 3X | | 11.08 | 17 | -0.89 | 2.03 | -18.95% |
| UYG | Financials | | 62.79 | 60 | 0.56 | -1.35 | 13.75% |
| IAT | Regional Banks | | 42.29 | 100 | 0.93 | 1.37 | 1.08% |
| KIE | Insurance | | 49.48 | 60 | 0.39 | 1.96 | 9.42% |
| PSCF | SmallCap Financials | | 47.28 | 100 | 0.77 | 1.98 | -3.86% |
| EUFN | Europe Financials | | 22.65 | 85 | 0.24 | 0.82 | 8.04% |
| PGF | Financial Preferred | | 14.85 | 64 | 1.43 | 1.92 | 1.85% |
| 12Stocks.com: Charts, Trends, Fundamental Data and Performances of Financial Stocks | |
|
We now take in-depth look at all Financial stocks including charts, multi-period performances and overall trends (as measured by Smart Investing & Trading Score). One can sort Financial stocks (click link to choose) by Daily, Weekly and by Year-to-Date performances. Also, one can sort by size of the company or by market capitalization. |
| Select Your Default Chart Type: | |||||
| |||||
| Click on stock symbol or name for detailed view. Click on to add stock symbol to your watchlist and to view watchlist. Quick View: Move mouse or cursor over "Daily" to quickly view daily Technical stock chart and over "Weekly" to view weekly Technical stock chart. | |||||

 | MFC Manulife Financial Corporation |
| Sector: Financials | |
| SubSector: Life Insurance | |
| MarketCap: 22188.7 Millions | |
| Recent Price: 24.01 Smart Investing & Trading Score: 95 | |
| Day Percent Change: 1.31% Day Change: 0.31 | |
| Week Change: 2.3% Year-to-date Change: 8.6% | |
| MFC Links: Profile News Message Board | |
| Charts:- Daily , Weekly | |
| Add MFC to Watchlist: View: Get Complete MFC Trend Analysis ➞ | |
 | EQR Equity Residential |
| Sector: Financials | |
| SubSector: REIT - Residential | |
| MarketCap: 22061.9 Millions | |
| Recent Price: 65.91 Smart Investing & Trading Score: 100 | |
| Day Percent Change: 0.53% Day Change: 0.35 | |
| Week Change: 1.18% Year-to-date Change: 7.8% | |
| EQR Links: Profile News Message Board | |
| Charts:- Daily , Weekly | |
| Add EQR to Watchlist: View: Get Complete EQR Trend Analysis ➞ | |
 | BSBR Banco Santander (Brasil) S.A. |
| Sector: Financials | |
| SubSector: Foreign Regional Banks | |
| MarketCap: 21961.4 Millions | |
| Recent Price: 5.83 Smart Investing & Trading Score: 100 | |
| Day Percent Change: 1.57% Day Change: 0.09 | |
| Week Change: 8.77% Year-to-date Change: -11.0% | |
| BSBR Links: Profile News Message Board | |
| Charts:- Daily , Weekly | |
| Add BSBR to Watchlist: View: Get Complete BSBR Trend Analysis ➞ | |
 | CSGP CoStar Group, Inc. |
| Sector: Financials | |
| SubSector: Property Management | |
| MarketCap: 21454.4 Millions | |
| Recent Price: 91.23 Smart Investing & Trading Score: 73 | |
| Day Percent Change: 1.64% Day Change: 1.47 | |
| Week Change: -1.53% Year-to-date Change: 4.4% | |
| CSGP Links: Profile News Message Board | |
| Charts:- Daily , Weekly | |
| Add CSGP to Watchlist: View: Get Complete CSGP Trend Analysis ➞ | |
 | WELL Welltower Inc. |
| Sector: Financials | |
| SubSector: REIT - Healthcare Facilities | |
| MarketCap: 21398.8 Millions | |
| Recent Price: 95.81 Smart Investing & Trading Score: 78 | |
| Day Percent Change: -0.28% Day Change: -0.27 | |
| Week Change: 1.56% Year-to-date Change: 6.3% | |
| WELL Links: Profile News Message Board | |
| Charts:- Daily , Weekly | |
| Add WELL to Watchlist: View: Get Complete WELL Trend Analysis ➞ | |
 | AIG American International Group, Inc. |
| Sector: Financials | |
| SubSector: Property & Casualty Insurance | |
| MarketCap: 21219 Millions | |
| Recent Price: 78.48 Smart Investing & Trading Score: 88 | |
| Day Percent Change: 0.49% Day Change: 0.38 | |
| Week Change: 5.3% Year-to-date Change: 15.8% | |
| AIG Links: Profile News Message Board | |
| Charts:- Daily , Weekly | |
| Add AIG to Watchlist: View: Get Complete AIG Trend Analysis ➞ | |
 | BCS Barclays PLC |
| Sector: Financials | |
| SubSector: Foreign Money Center Banks | |
| MarketCap: 21013.4 Millions | |
| Recent Price: 10.26 Smart Investing & Trading Score: 66 | |
| Day Percent Change: 0.10% Day Change: 0.01 | |
| Week Change: -1.54% Year-to-date Change: 30.2% | |
| BCS Links: Profile News Message Board | |
| Charts:- Daily , Weekly | |
| Add BCS to Watchlist: View: Get Complete BCS Trend Analysis ➞ | |
 | PRU Prudential Financial, Inc. |
| Sector: Financials | |
| SubSector: Life Insurance | |
| MarketCap: 21001.6 Millions | |
| Recent Price: 112.26 Smart Investing & Trading Score: 85 | |
| Day Percent Change: 0.87% Day Change: 0.97 | |
| Week Change: 1.59% Year-to-date Change: 8.2% | |
| PRU Links: Profile News Message Board | |
| Charts:- Daily , Weekly | |
| Add PRU to Watchlist: View: Get Complete PRU Trend Analysis ➞ | |
 | AVB AvalonBay Communities, Inc. |
| Sector: Financials | |
| SubSector: REIT - Residential | |
| MarketCap: 19921.9 Millions | |
| Recent Price: 192.81 Smart Investing & Trading Score: 100 | |
| Day Percent Change: 0.19% Day Change: 0.36 | |
| Week Change: 0.71% Year-to-date Change: 3.0% | |
| AVB Links: Profile News Message Board | |
| Charts:- Daily , Weekly | |
| Add AVB to Watchlist: View: Get Complete AVB Trend Analysis ➞ | |
 | STT State Street Corporation |
| Sector: Financials | |
| SubSector: Asset Management | |
| MarketCap: 18623 Millions | |
| Recent Price: 74.39 Smart Investing & Trading Score: 78 | |
| Day Percent Change: 1.63% Day Change: 1.19 | |
| Week Change: 1.36% Year-to-date Change: -4.0% | |
| STT Links: Profile News Message Board | |
| Charts:- Daily , Weekly | |
| Add STT to Watchlist: View: Get Complete STT Trend Analysis ➞ | |
 | SPG Simon Property Group, Inc. |
| Sector: Financials | |
| SubSector: REIT - Retail | |
| MarketCap: 17959.6 Millions | |
| Recent Price: 142.93 Smart Investing & Trading Score: 32 | |
| Day Percent Change: 1.11% Day Change: 1.57 | |
| Week Change: 0.4% Year-to-date Change: 0.2% | |
| SPG Links: Profile News Message Board | |
| Charts:- Daily , Weekly | |
| Add SPG to Watchlist: View: Get Complete SPG Trend Analysis ➞ | |
 | KKR KKR & Co. Inc. |
| Sector: Financials | |
| SubSector: Asset Management | |
| MarketCap: 17722.5 Millions | |
| Recent Price: 95.01 Smart Investing & Trading Score: 39 | |
| Day Percent Change: -2.18% Day Change: -2.12 | |
| Week Change: -0.55% Year-to-date Change: 14.7% | |
| KKR Links: Profile News Message Board | |
| Charts:- Daily , Weekly | |
| Add KKR to Watchlist: View: Get Complete KKR Trend Analysis ➞ | |
 | SLF Sun Life Financial Inc. |
| Sector: Financials | |
| SubSector: Property & Casualty Insurance | |
| MarketCap: 17722 Millions | |
| Recent Price: 52.48 Smart Investing & Trading Score: 64 | |
| Day Percent Change: 0.81% Day Change: 0.42 | |
| Week Change: 1.57% Year-to-date Change: 1.2% | |
| SLF Links: Profile News Message Board | |
| Charts:- Daily , Weekly | |
| Add SLF to Watchlist: View: Get Complete SLF Trend Analysis ➞ | |
 | O Realty Income Corporation |
| Sector: Financials | |
| SubSector: REIT - Retail | |
| MarketCap: 17647.4 Millions | |
| Recent Price: 55.26 Smart Investing & Trading Score: 100 | |
| Day Percent Change: 0.64% Day Change: 0.35 | |
| Week Change: 2.89% Year-to-date Change: -3.8% | |
| O Links: Profile News Message Board | |
| Charts:- Daily , Weekly | |
| Add O to Watchlist: View: Get Complete O Trend Analysis ➞ | |
 | IBKR Interactive Brokers Group, Inc. |
| Sector: Financials | |
| SubSector: Investment Brokerage - National | |
| MarketCap: 16975.7 Millions | |
| Recent Price: 120.12 Smart Investing & Trading Score: 93 | |
| Day Percent Change: 0.27% Day Change: 0.32 | |
| Week Change: 3.42% Year-to-date Change: 44.9% | |
| IBKR Links: Profile News Message Board | |
| Charts:- Daily , Weekly | |
| Add IBKR to Watchlist: View: Get Complete IBKR Trend Analysis ➞ | |
 | ARE Alexandria Real Estate Equities, Inc. |
| Sector: Financials | |
| SubSector: REIT - Office | |
| MarketCap: 16793.6 Millions | |
| Recent Price: 120.51 Smart Investing & Trading Score: 52 | |
| Day Percent Change: 1.98% Day Change: 2.34 | |
| Week Change: 3.67% Year-to-date Change: -4.9% | |
| ARE Links: Profile News Message Board | |
| Charts:- Daily , Weekly | |
| Add ARE to Watchlist: View: Get Complete ARE Trend Analysis ➞ | |
 | COIN Coinbase Global, Inc. |
| Sector: Financials | |
| SubSector: Financial Data & Stock Exchanges | |
| MarketCap: 16390 Millions | |
| Recent Price: 223.25 Smart Investing & Trading Score: 63 | |
| Day Percent Change: 0.38% Day Change: 0.84 | |
| Week Change: -5.58% Year-to-date Change: 29.2% | |
| COIN Links: Profile News Message Board | |
| Charts:- Daily , Weekly | |
| Add COIN to Watchlist: View: Get Complete COIN Trend Analysis ➞ | |
 | OWL Blue Owl Capital Inc. |
| Sector: Financials | |
| SubSector: Asset Management | |
| MarketCap: 16240 Millions | |
| Recent Price: 17.96 Smart Investing & Trading Score: 0 | |
| Day Percent Change: -3.26% Day Change: -0.61 | |
| Week Change: -4.42% Year-to-date Change: 20.6% | |
| OWL Links: Profile News Message Board | |
| Charts:- Daily , Weekly | |
| Add OWL to Watchlist: View: Get Complete OWL Trend Analysis ➞ | |
 | HBANP Huntington Bancshares Incorporated |
| Sector: Financials | |
| SubSector: Banks - Regional | |
| MarketCap: 15560 Millions | |
| Recent Price: 17.97 Smart Investing & Trading Score: 40 | |
| Day Percent Change: 0.67% Day Change: 0.12 | |
| Week Change: -0.17% Year-to-date Change: 0.1% | |
| HBANP Links: Profile News Message Board | |
| Charts:- Daily , Weekly | |
| Add HBANP to Watchlist: View: Get Complete HBANP Trend Analysis ➞ | |
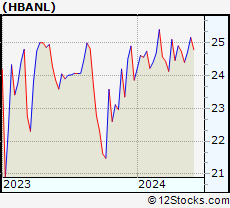 | HBANL Huntington Bancshares Incorporated |
| Sector: Financials | |
| SubSector: Banks - Regional | |
| MarketCap: 15560 Millions | |
| Recent Price: 25.16 Smart Investing & Trading Score: 100 | |
| Day Percent Change: 1.62% Day Change: 0.40 | |
| Week Change: 1.78% Year-to-date Change: 5.5% | |
| HBANL Links: Profile News Message Board | |
| Charts:- Daily , Weekly | |
| Add HBANL to Watchlist: View: Get Complete HBANL Trend Analysis ➞ | |
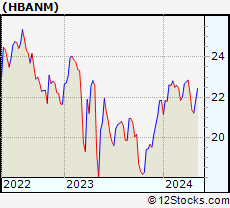 | HBANM Huntington Bancshares Incorporated |
| Sector: Financials | |
| SubSector: Banks - Regional | |
| MarketCap: 15560 Millions | |
| Recent Price: 21.86 Smart Investing & Trading Score: 47 | |
| Day Percent Change: -0.05% Day Change: -0.01 | |
| Week Change: 3.02% Year-to-date Change: 0.1% | |
| HBANM Links: Profile News Message Board | |
| Charts:- Daily , Weekly | |
| Add HBANM to Watchlist: View: Get Complete HBANM Trend Analysis ➞ | |
 | IX ORIX Corporation |
| Sector: Financials | |
| SubSector: Credit Services | |
| MarketCap: 15483.4 Millions | |
| Recent Price: 104.66 Smart Investing & Trading Score: 52 | |
| Day Percent Change: 1.01% Day Change: 1.05 | |
| Week Change: 2.05% Year-to-date Change: 12.1% | |
| IX Links: Profile News Message Board | |
| Charts:- Daily , Weekly | |
| Add IX to Watchlist: View: Get Complete IX Trend Analysis ➞ | |
 | NTRS Northern Trust Corporation |
| Sector: Financials | |
| SubSector: Asset Management | |
| MarketCap: 15316.8 Millions | |
| Recent Price: 84.62 Smart Investing & Trading Score: 93 | |
| Day Percent Change: 1.34% Day Change: 1.12 | |
| Week Change: 1.49% Year-to-date Change: 0.3% | |
| NTRS Links: Profile News Message Board | |
| Charts:- Daily , Weekly | |
| Add NTRS to Watchlist: View: Get Complete NTRS Trend Analysis ➞ | |
 | NMR Nomura Holdings, Inc. |
| Sector: Financials | |
| SubSector: Investment Brokerage - National | |
| MarketCap: 15277 Millions | |
| Recent Price: 5.82 Smart Investing & Trading Score: 58 | |
| Day Percent Change: 1.39% Day Change: 0.08 | |
| Week Change: 0% Year-to-date Change: 29.1% | |
| NMR Links: Profile News Message Board | |
| Charts:- Daily , Weekly | |
| Add NMR to Watchlist: View: Get Complete NMR Trend Analysis ➞ | |
 | NDAQ Nasdaq, Inc. |
| Sector: Financials | |
| SubSector: Diversified Investments | |
| MarketCap: 14885.2 Millions | |
| Recent Price: 60.87 Smart Investing & Trading Score: 68 | |
| Day Percent Change: 1.33% Day Change: 0.80 | |
| Week Change: 1.25% Year-to-date Change: 4.7% | |
| NDAQ Links: Profile News Message Board | |
| Charts:- Daily , Weekly | |
| Add NDAQ to Watchlist: View: Get Complete NDAQ Trend Analysis ➞ | |
| For tabular summary view of above stock list: Summary View ➞ 0 - 25 , 25 - 50 , 50 - 75 , 75 - 100 , 100 - 125 , 125 - 150 , 150 - 175 , 175 - 200 , 200 - 225 , 225 - 250 , 250 - 275 , 275 - 300 , 300 - 325 , 325 - 350 , 350 - 375 , 375 - 400 , 400 - 425 , 425 - 450 , 450 - 475 , 475 - 500 , 500 - 525 , 525 - 550 , 550 - 575 , 575 - 600 , 600 - 625 , 625 - 650 , 650 - 675 , 675 - 700 , 700 - 725 , 725 - 750 , 750 - 775 , 775 - 800 , 800 - 825 , 825 - 850 , 850 - 875 , 875 - 900 , 900 - 925 , 925 - 950 , 950 - 975 , 975 - 1000 , 1000 - 1025 , 1025 - 1050 , 1050 - 1075 , 1075 - 1100 , 1100 - 1125 , 1125 - 1150 , 1150 - 1175 , 1175 - 1200 , 1200 - 1225 , 1225 - 1250 | ||
| Click To Change The Sort Order: By Market Cap or Company Size Performance: Year-to-date, Week and Day | |
| Select Chart Type: | ||
|
Best Stocks Today 12Stocks.com |
© 2024 12Stocks.com Terms & Conditions Privacy Contact Us
All Information Provided Only For Education And Not To Be Used For Investing or Trading. See Terms & Conditions


One More Thing ... Get Best Stocks Delivered Daily!
Never Ever Miss A Move With Our Top Ten Stocks Lists
Find Best Stocks In Any Market - Bull or Bear Market
Take A Peek At Our Top Ten Stocks Lists: Daily, Weekly, Year-to-Date & Top Trends
Find Best Stocks In Any Market - Bull or Bear Market
Take A Peek At Our Top Ten Stocks Lists: Daily, Weekly, Year-to-Date & Top Trends
Financial Stocks With Best Up Trends [0-bearish to 100-bullish]: Siebert [100], Office Properties[100], Banco BBVA[100], AG Mortgage[100], Grupo Financiero[100], Banco Macro[100], Global X[100], Grupo Supervielle[100], Reinsurance [100], Camden Property[100], Noah [100]
Best Financial Stocks Year-to-Date:
Root [436.68%], Banco Macro[109.83%], Hippo [103.4%], Gladstone Capital[100.28%], Grupo Financiero[98.78%], Banco BBVA[92.83%], EverQuote [77.7%], Grupo Supervielle[69.21%], Yiren Digital[66.99%], LendingTree [62.96%], Lufax Holding[53.09%] Best Financial Stocks This Week:
Office Properties[42.79%], LendingTree [30.37%], SelectQuote [26.71%], Heartland [23.01%], Industrial Logistics[20.39%], New York[18.86%], KE [17.8%], Banco Macro[17.21%], Douglas Elliman[16.39%], Siebert [14.85%], eXp World[14.82%] Best Financial Stocks Daily:
Siebert [17.17%], SelectQuote [13.33%], Office Properties[12.11%], Banco BBVA[9.27%], Oportun [9.01%], AG Mortgage[8.85%], Diversified Healthcare[8.26%], RE/MAX [7.68%], Grupo Financiero[7.62%], Banco Macro[7.32%], Xenia Hotels[7.01%]