
 Login Sign Up


| |||||
 |  | ||||

| 12Stocks.com Market Intelligence |
Best Financial Stocks
| In a hurry? Financial Stocks Lists: Performance Trends Table, Stock Charts
Sort Financial stocks: Daily, Weekly, Year-to-Date, Market Cap & Trends. Filter Financial stocks list by size:All Financial Large Mid-Range Small & MicroCap |
| 12Stocks.com Financial Stocks Performances & Trends Daily | |||||||||
|
|  The overall Smart Investing & Trading Score is 90 (0-bearish to 100-bullish) which puts Financial sector in short term bullish trend. The Smart Investing & Trading Score from previous trading session is 60 and an improvement of trend continues.
| ||||||||
Here are the Smart Investing & Trading Scores of the most requested Financial stocks at 12Stocks.com (click stock name for detailed review):
|


| 12Stocks.com: Investing in Financial sector with Stocks | |
|
The following table helps investors and traders sort through current performance and trends (as measured by Smart Investing & Trading Score) of various
stocks in the Financial sector. Quick View: Move mouse or cursor over stock symbol (ticker) to view short-term Technical chart and over stock name to view long term chart. Click on  to add stock symbol to your watchlist and to add stock symbol to your watchlist and  to view watchlist. Click on any ticker or stock name for detailed market intelligence report for that stock. to view watchlist. Click on any ticker or stock name for detailed market intelligence report for that stock. |
12Stocks.com Performance of Stocks in Financial Sector
| Ticker | Stock Name | Watchlist | Category | Recent Price | Trend Score | Change % | YTD Change% |
| HEI.A | HEICO CORP |   | N/A | 198.03 | 100 | 1.38% | 0.00% |
| KIO | KKR ome | | Closed-End Fund - Debt | 12.67 | 70 | 0.00% | 3.05% |
| VKQ | Invesco Municipal | | Closed-End Fund - Debt | 9.58 | 80 | -0.10% | 1.76% |
| OLP | One Liberty | | REIT - | 23.14 | 30 | 0.78% | -10.71% |
| PGC | Peapack-Gladstone | | Banks - Regional | 29.94 | 100 | 2.25% | -3.44% |
| WDH | Waterdrop | | Insurance - | 1.86 | 30 | -2.11% | 61.00% |
| UBA | Urstadt Biddle | | REIT - Retail | 12.86 | 0 | -1.98% | 0.00% |
| PPR | Voya Prime | | Closed-End Fund - Debt | 4.60 | 20 | 0.22% | 0.00% |
| IQI | Invesco Quality | | Closed-End Fund - Debt | 9.88 | 60 | -0.50% | 4.28% |
| NRIM | Northrim Bancorp | | Banks - Regional | 92.70 | 50 | 3.60% | 22.36% |
| FFWM | First Foundation | | Banks - Regional | 5.96 | 60 | 2.23% | -1.49% |
| PKST | Peakstone Realty | | REIT - Office | 13.85 | 61 | -1.19% | 16.12% |
| NFBK | Northfield Bancorp | | Banks - Regional | 11.88 | 80 | 3.76% | 7.52% |
| OKSB | Southwest Bancorp | | Regional - Southwest Banks | 6.94 | 10 | 0.14% | 0.00% |
| PROS | ProSight Global | | Insurance | 12.85 | 20 | 0.00% | 0.00% |
| MUI | BlackRock Muni | | Closed-End Fund - Debt | 12.09 | 60 | 3.11% | 0.02% |
| SCNB | Suffolk Bancorp | | Regional Banks | 21.66 | 70 | -0.41% | 0.00% |
| KCLI | Kansas City | | Life Insurance | 35.75 | 90 | 1.42% | 1.28% |
| YRD | Yiren Digital | | Credit Services | 6.04 | 60 | 1.00% | 24.54% |
| OBNK | Origin Bancorp | | Regional Banks | 32.27 | 70 | 0.12% | 0.00% |
| VCV | Invesco California | | Closed-End Fund - Debt | 10.54 | 80 | 0.00% | -1.17% |
| PML | Pimco Municipal | | Closed-End Fund - Debt | 7.80 | 90 | 0.13% | -0.60% |
| SITC | SITE Centers | | REIT - Retail | 8.91 | 40 | 2.89% | -32.87% |
| NML | Neuberger Berman | | Closed-End Fund - Equity | 8.58 | 0 | -0.12% | 1.10% |
| FRPH | FRP | | Real Estate Services | 25.02 | 20 | 0.60% | -16.43% |
| For chart view version of above stock list: Chart View ➞ 0 - 25 , 25 - 50 , 50 - 75 , 75 - 100 , 100 - 125 , 125 - 150 , 150 - 175 , 175 - 200 , 200 - 225 , 225 - 250 , 250 - 275 , 275 - 300 , 300 - 325 , 325 - 350 , 350 - 375 , 375 - 400 , 400 - 425 , 425 - 450 , 450 - 475 , 475 - 500 , 500 - 525 , 525 - 550 , 550 - 575 , 575 - 600 , 600 - 625 , 625 - 650 , 650 - 675 , 675 - 700 , 700 - 725 , 725 - 750 , 750 - 775 , 775 - 800 , 800 - 825 , 825 - 850 , 850 - 875 , 875 - 900 , 900 - 925 , 925 - 950 , 950 - 975 , 975 - 1000 , 1000 - 1025 , 1025 - 1050 , 1050 - 1075 , 1075 - 1100 , 1100 - 1125 , 1125 - 1150 , 1150 - 1175 , 1175 - 1200 , 1200 - 1225 , 1225 - 1250 , 1250 - 1275 , 1275 - 1300 , 1300 - 1325 , 1325 - 1350 , 1350 - 1375 , 1375 - 1400 , 1400 - 1425 , 1425 - 1450 , 1450 - 1475 , 1475 - 1500 , 1500 - 1525 , 1525 - 1550 | ||
 | Click To Change The Sort Order: By Market Cap or Company Size Performance: Year-to-date, Week and Day |  |
|
Get the most comprehensive stock market coverage daily at 12Stocks.com ➞ Best Stocks Today ➞ Best Stocks Weekly ➞ Best Stocks Year-to-Date ➞ Best Stocks Trends ➞  Best Stocks Today 12Stocks.com Best Nasdaq Stocks ➞ Best S&P 500 Stocks ➞ Best Tech Stocks ➞ Best Biotech Stocks ➞ |
| Detailed Overview of Financial Stocks |
| Financial Technical Overview, Leaders & Laggards, Top Financial ETF Funds & Detailed Financial Stocks List, Charts, Trends & More |
| Financial Sector: Technical Analysis, Trends & YTD Performance | |
| Financial sector is composed of stocks
from banks, brokers, insurance, REITs
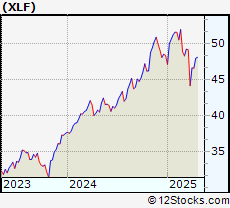
and services subsectors. Financial sector, as represented by XLF, an exchange-traded fund [ETF] that holds basket of Financial stocks (e.g, Bank of America, Goldman Sachs) is up by 13.0735% and is currently underperforming the overall market by -0.7866% year-to-date. Below is a quick view of Technical charts and trends: |
|
 XLF Weekly Chart |
|
| Long Term Trend: Good | |
| Medium Term Trend: Good | |
 XLF Daily Chart |
|
| Short Term Trend: Very Good | |
| Overall Trend Score: 90 | |
| YTD Performance: 13.0735% | |
| **Trend Scores & Views Are Only For Educational Purposes And Not For Investing | |
| 12Stocks.com: Top Performing Financial Sector Stocks | |||||||||||||||||||||||||||||||||||||||||||||||
 The top performing Financial sector stocks year to date are
Now, more recently, over last week, the top performing Financial sector stocks on the move are


|
|||||||||||||||||||||||||||||||||||||||||||||||
| 12Stocks.com: Investing in Financial Sector using Exchange Traded Funds | |
|
The following table shows list of key exchange traded funds (ETF) that
help investors track Financial Index. For detailed view, check out our ETF Funds section of our website. Quick View: Move mouse or cursor over ETF symbol (ticker) to view short-term Technical chart and over ETF name to view long term chart. Click on ticker or stock name for detailed view. Click on to add stock symbol to your watchlist and to view watchlist. |
12Stocks.com List of ETFs that track Financial Index
| Ticker | ETF Name | Watchlist | Recent Price | Smart Investing & Trading Score | Change % | Week % | Year-to-date % |
| CHIX | China Financials | | 10.57 | 20 | 0 | 0 | 0% |
| 12Stocks.com: Charts, Trends, Fundamental Data and Performances of Financial Stocks | |
|
We now take in-depth look at all Financial stocks including charts, multi-period performances and overall trends (as measured by Smart Investing & Trading Score). One can sort Financial stocks (click link to choose) by Daily, Weekly and by Year-to-Date performances. Also, one can sort by size of the company or by market capitalization. |
| Select Your Default Chart Type: | |||||
| |||||
| Click on stock symbol or name for detailed view. Click on to add stock symbol to your watchlist and to view watchlist. Quick View: Move mouse or cursor over "Daily" to quickly view daily Technical stock chart and over "Weekly" to view weekly Technical stock chart. | |||||

 | HEI.A HEICO CORP NEW |
| Sector: Financials | |
| SubSector: N/A | |
| MarketCap: 519.923 Millions | |
| Recent Price: 198.03 Smart Investing & Trading Score: 100 | |
| Day Percent Change: 1.37709% Day Change: -9999 | |
| Week Change: 86.031% Year-to-date Change: 0.0% | |
| HEI.A Links: Profile News Message Board | |
| Charts:- Daily , Weekly | |
| Add HEI.A to Watchlist: View: Get Complete HEI.A Trend Analysis ➞ | |
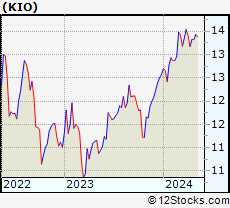 | KIO KKR Income Opportunities Fund |
| Sector: Financials | |
| SubSector: Closed-End Fund - Debt | |
| MarketCap: 514.15 Millions | |
| Recent Price: 12.67 Smart Investing & Trading Score: 70 | |
| Day Percent Change: 0% Day Change: -0.04 | |
| Week Change: 0.316706% Year-to-date Change: 3.0% | |
| KIO Links: Profile News Message Board | |
| Charts:- Daily , Weekly | |
| Add KIO to Watchlist: View: Get Complete KIO Trend Analysis ➞ | |
 | VKQ Invesco Municipal Trust |
| Sector: Financials | |
| SubSector: Closed-End Fund - Debt | |
| MarketCap: 510.75 Millions | |
| Recent Price: 9.58 Smart Investing & Trading Score: 80 | |
| Day Percent Change: -0.104275% Day Change: -0.03 | |
| Week Change: 0.736067% Year-to-date Change: 1.8% | |
| VKQ Links: Profile News Message Board | |
| Charts:- Daily , Weekly | |
| Add VKQ to Watchlist: View: Get Complete VKQ Trend Analysis ➞ | |
 | OLP One Liberty Properties, Inc |
| Sector: Financials | |
| SubSector: REIT - Diversified | |
| MarketCap: 510.62 Millions | |
| Recent Price: 23.14 Smart Investing & Trading Score: 30 | |
| Day Percent Change: 0.783972% Day Change: -0.1 | |
| Week Change: 1.49123% Year-to-date Change: -10.7% | |
| OLP Links: Profile News Message Board | |
| Charts:- Daily , Weekly | |
| Add OLP to Watchlist: View: Get Complete OLP Trend Analysis ➞ | |
 | PGC Peapack-Gladstone Financial Corp |
| Sector: Financials | |
| SubSector: Banks - Regional | |
| MarketCap: 510.04 Millions | |
| Recent Price: 29.94 Smart Investing & Trading Score: 100 | |
| Day Percent Change: 2.2541% Day Change: -0.22 | |
| Week Change: 3.77816% Year-to-date Change: -3.4% | |
| PGC Links: Profile News Message Board | |
| Charts:- Daily , Weekly | |
| Add PGC to Watchlist: View: Get Complete PGC Trend Analysis ➞ | |
 | WDH Waterdrop Inc ADR |
| Sector: Financials | |
| SubSector: Insurance - Diversified | |
| MarketCap: 509.46 Millions | |
| Recent Price: 1.86 Smart Investing & Trading Score: 30 | |
| Day Percent Change: -2.10526% Day Change: -0.01 | |
| Week Change: -0.534759% Year-to-date Change: 61.0% | |
| WDH Links: Profile News Message Board | |
| Charts:- Daily , Weekly | |
| Add WDH to Watchlist: View: Get Complete WDH Trend Analysis ➞ | |
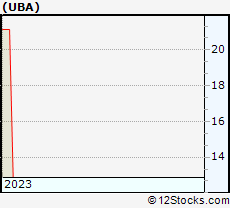 | UBA Urstadt Biddle Properties Inc. |
| Sector: Financials | |
| SubSector: REIT - Retail | |
| MarketCap: 508.914 Millions | |
| Recent Price: 12.86 Smart Investing & Trading Score: 0 | |
| Day Percent Change: -1.98171% Day Change: -9999 | |
| Week Change: -39.1675% Year-to-date Change: 0.0% | |
| UBA Links: Profile News Message Board | |
| Charts:- Daily , Weekly | |
| Add UBA to Watchlist: View: Get Complete UBA Trend Analysis ➞ | |
 | PPR Voya Prime Rate Trust |
| Sector: Financials | |
| SubSector: Closed-End Fund - Debt | |
| MarketCap: 508.307 Millions | |
| Recent Price: 4.60 Smart Investing & Trading Score: 20 | |
| Day Percent Change: 0.217865% Day Change: -9999 | |
| Week Change: 0.217865% Year-to-date Change: 0.0% | |
| PPR Links: Profile News Message Board | |
| Charts:- Daily , Weekly | |
| Add PPR to Watchlist: View: Get Complete PPR Trend Analysis ➞ | |
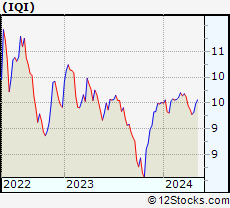 | IQI Invesco Quality Municipal Income Trust |
| Sector: Financials | |
| SubSector: Closed-End Fund - Debt | |
| MarketCap: 506.63 Millions | |
| Recent Price: 9.88 Smart Investing & Trading Score: 60 | |
| Day Percent Change: -0.503525% Day Change: -0.03 | |
| Week Change: 0.20284% Year-to-date Change: 4.3% | |
| IQI Links: Profile News Message Board | |
| Charts:- Daily , Weekly | |
| Add IQI to Watchlist: View: Get Complete IQI Trend Analysis ➞ | |
 | NRIM Northrim Bancorp, Inc |
| Sector: Financials | |
| SubSector: Banks - Regional | |
| MarketCap: 502.01 Millions | |
| Recent Price: 92.70 Smart Investing & Trading Score: 50 | |
| Day Percent Change: 3.59857% Day Change: -0.16 | |
| Week Change: 0.73897% Year-to-date Change: 22.4% | |
| NRIM Links: Profile News Message Board | |
| Charts:- Daily , Weekly | |
| Add NRIM to Watchlist: View: Get Complete NRIM Trend Analysis ➞ | |
 | FFWM First Foundation Inc |
| Sector: Financials | |
| SubSector: Banks - Regional | |
| MarketCap: 501.73 Millions | |
| Recent Price: 5.96 Smart Investing & Trading Score: 60 | |
| Day Percent Change: 2.22985% Day Change: -0.02 | |
| Week Change: 0.846024% Year-to-date Change: -1.5% | |
| FFWM Links: Profile News Message Board | |
| Charts:- Daily , Weekly | |
| Add FFWM to Watchlist: View: Get Complete FFWM Trend Analysis ➞ | |
 | PKST Peakstone Realty Trust |
| Sector: Financials | |
| SubSector: REIT - Office | |
| MarketCap: 499.99 Millions | |
| Recent Price: 13.85 Smart Investing & Trading Score: 61 | |
| Day Percent Change: -1.19% Day Change: -0.15 | |
| Week Change: 1.89% Year-to-date Change: 16.1% | |
| PKST Links: Profile News Message Board | |
| Charts:- Daily , Weekly | |
| Add PKST to Watchlist: View: Get Complete PKST Trend Analysis ➞ | |
 | NFBK Northfield Bancorp Inc |
| Sector: Financials | |
| SubSector: Banks - Regional | |
| MarketCap: 498.38 Millions | |
| Recent Price: 11.88 Smart Investing & Trading Score: 80 | |
| Day Percent Change: 3.75546% Day Change: -0.09 | |
| Week Change: 2.06186% Year-to-date Change: 7.5% | |
| NFBK Links: Profile News Message Board | |
| Charts:- Daily , Weekly | |
| Add NFBK to Watchlist: View: Get Complete NFBK Trend Analysis ➞ | |
 | OKSB Southwest Bancorp, Inc. |
| Sector: Financials | |
| SubSector: Regional - Southwest Banks | |
| MarketCap: 497.81 Millions | |
| Recent Price: 6.94 Smart Investing & Trading Score: 10 | |
| Day Percent Change: 0.1443% Day Change: -9999 | |
| Week Change: -72.6556% Year-to-date Change: 0.0% | |
| OKSB Links: Profile News Message Board | |
| Charts:- Daily , Weekly | |
| Add OKSB to Watchlist: View: Get Complete OKSB Trend Analysis ➞ | |
 | PROS ProSight Global, Inc. |
| Sector: Financials | |
| SubSector: Property & Casualty Insurance | |
| MarketCap: 496.312 Millions | |
| Recent Price: 12.85 Smart Investing & Trading Score: 20 | |
| Day Percent Change: 0% Day Change: -9999 | |
| Week Change: 0% Year-to-date Change: 0.0% | |
| PROS Links: Profile News Message Board | |
| Charts:- Daily , Weekly | |
| Add PROS to Watchlist: View: Get Complete PROS Trend Analysis ➞ | |
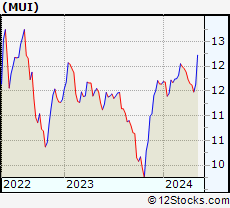 | MUI BlackRock Muni Intermediate Duration Fund, Inc. |
| Sector: Financials | |
| SubSector: Closed-End Fund - Debt | |
| MarketCap: 496.307 Millions | |
| Recent Price: 12.09 Smart Investing & Trading Score: 60 | |
| Day Percent Change: 3.11301% Day Change: -9999 | |
| Week Change: 0.3861% Year-to-date Change: 0.0% | |
| MUI Links: Profile News Message Board | |
| Charts:- Daily , Weekly | |
| Add MUI to Watchlist: View: Get Complete MUI Trend Analysis ➞ | |
 | SCNB Suffolk Bancorp |
| Sector: Financials | |
| SubSector: Regional - Northeast Banks | |
| MarketCap: 496.17 Millions | |
| Recent Price: 21.66 Smart Investing & Trading Score: 70 | |
| Day Percent Change: -0.413793% Day Change: -9999 | |
| Week Change: 110.291% Year-to-date Change: 0.0% | |
| SCNB Links: Profile News Message Board | |
| Charts:- Daily , Weekly | |
| Add SCNB to Watchlist: View: Get Complete SCNB Trend Analysis ➞ | |
 | KCLI Kansas City Life Insurance Company |
| Sector: Financials | |
| SubSector: Life Insurance | |
| MarketCap: 495.24 Millions | |
| Recent Price: 35.75 Smart Investing & Trading Score: 90 | |
| Day Percent Change: 1.41844% Day Change: -9999 | |
| Week Change: -1.02436% Year-to-date Change: 1.3% | |
| KCLI Links: Profile News Message Board | |
| Charts:- Daily , Weekly | |
| Add KCLI to Watchlist: View: Get Complete KCLI Trend Analysis ➞ | |
 | YRD Yiren Digital Ltd ADR |
| Sector: Financials | |
| SubSector: Credit Services | |
| MarketCap: 495.13 Millions | |
| Recent Price: 6.04 Smart Investing & Trading Score: 60 | |
| Day Percent Change: 1.00334% Day Change: 0.21 | |
| Week Change: 4.86111% Year-to-date Change: 24.5% | |
| YRD Links: Profile News Message Board | |
| Charts:- Daily , Weekly | |
| Add YRD to Watchlist: View: Get Complete YRD Trend Analysis ➞ | |
 | OBNK Origin Bancorp, Inc. |
| Sector: Financials | |
| SubSector: Regional - Southeast Banks | |
| MarketCap: 494.235 Millions | |
| Recent Price: 32.27 Smart Investing & Trading Score: 70 | |
| Day Percent Change: 0.124108% Day Change: -9999 | |
| Week Change: 4.90897% Year-to-date Change: 0.0% | |
| OBNK Links: Profile News Message Board | |
| Charts:- Daily , Weekly | |
| Add OBNK to Watchlist: View: Get Complete OBNK Trend Analysis ➞ | |
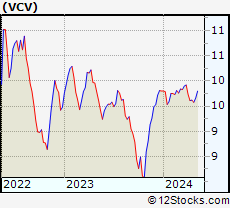 | VCV Invesco California Value Municipal Income Trust |
| Sector: Financials | |
| SubSector: Closed-End Fund - Debt | |
| MarketCap: 492.45 Millions | |
| Recent Price: 10.54 Smart Investing & Trading Score: 80 | |
| Day Percent Change: 0% Day Change: 0.02 | |
| Week Change: 0.572519% Year-to-date Change: -1.2% | |
| VCV Links: Profile News Message Board | |
| Charts:- Daily , Weekly | |
| Add VCV to Watchlist: View: Get Complete VCV Trend Analysis ➞ | |
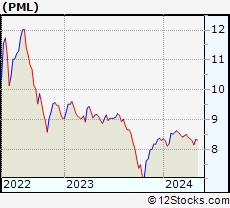 | PML Pimco Municipal Income Fund II |
| Sector: Financials | |
| SubSector: Closed-End Fund - Debt | |
| MarketCap: 491.25 Millions | |
| Recent Price: 7.80 Smart Investing & Trading Score: 90 | |
| Day Percent Change: 0.12837% Day Change: -0.02 | |
| Week Change: 3.58566% Year-to-date Change: -0.6% | |
| PML Links: Profile News Message Board | |
| Charts:- Daily , Weekly | |
| Add PML to Watchlist: View: Get Complete PML Trend Analysis ➞ | |
 | SITC SITE Centers Corp |
| Sector: Financials | |
| SubSector: REIT - Retail | |
| MarketCap: 489.84 Millions | |
| Recent Price: 8.91 Smart Investing & Trading Score: 40 | |
| Day Percent Change: 2.88684% Day Change: 0.01 | |
| Week Change: -0.112108% Year-to-date Change: -32.9% | |
| SITC Links: Profile News Message Board | |
| Charts:- Daily , Weekly | |
| Add SITC to Watchlist: View: Get Complete SITC Trend Analysis ➞ | |
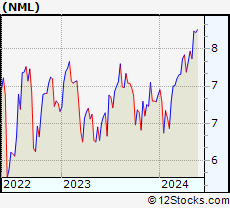 | NML Neuberger Berman Energy Infrastructure and Income Fund Inc |
| Sector: Financials | |
| SubSector: Closed-End Fund - Equity | |
| MarketCap: 488.4 Millions | |
| Recent Price: 8.58 Smart Investing & Trading Score: 0 | |
| Day Percent Change: -0.116414% Day Change: 0.03 | |
| Week Change: -0.694444% Year-to-date Change: 1.1% | |
| NML Links: Profile News Message Board | |
| Charts:- Daily , Weekly | |
| Add NML to Watchlist: View: Get Complete NML Trend Analysis ➞ | |
 | FRPH FRP Holdings Inc |
| Sector: Financials | |
| SubSector: Real Estate Services | |
| MarketCap: 486.71 Millions | |
| Recent Price: 25.02 Smart Investing & Trading Score: 20 | |
| Day Percent Change: 0.603136% Day Change: -0.08 | |
| Week Change: 0.160128% Year-to-date Change: -16.4% | |
| FRPH Links: Profile News Message Board | |
| Charts:- Daily , Weekly | |
| Add FRPH to Watchlist: View: Get Complete FRPH Trend Analysis ➞ | |
| For tabular summary view of above stock list: Summary View ➞ 0 - 25 , 25 - 50 , 50 - 75 , 75 - 100 , 100 - 125 , 125 - 150 , 150 - 175 , 175 - 200 , 200 - 225 , 225 - 250 , 250 - 275 , 275 - 300 , 300 - 325 , 325 - 350 , 350 - 375 , 375 - 400 , 400 - 425 , 425 - 450 , 450 - 475 , 475 - 500 , 500 - 525 , 525 - 550 , 550 - 575 , 575 - 600 , 600 - 625 , 625 - 650 , 650 - 675 , 675 - 700 , 700 - 725 , 725 - 750 , 750 - 775 , 775 - 800 , 800 - 825 , 825 - 850 , 850 - 875 , 875 - 900 , 900 - 925 , 925 - 950 , 950 - 975 , 975 - 1000 , 1000 - 1025 , 1025 - 1050 , 1050 - 1075 , 1075 - 1100 , 1100 - 1125 , 1125 - 1150 , 1150 - 1175 , 1175 - 1200 , 1200 - 1225 , 1225 - 1250 , 1250 - 1275 , 1275 - 1300 , 1300 - 1325 , 1325 - 1350 , 1350 - 1375 , 1375 - 1400 , 1400 - 1425 , 1425 - 1450 , 1450 - 1475 , 1475 - 1500 , 1500 - 1525 , 1525 - 1550 | ||
| Click To Change The Sort Order: By Market Cap or Company Size Performance: Year-to-date, Week and Day | |
| Select Chart Type: | ||
|
Best Stocks Today 12Stocks.com |
© 2025 12Stocks.com Terms & Conditions Privacy Contact Us
All Information Provided Only For Education And Not To Be Used For Investing or Trading. See Terms & Conditions


One More Thing ... Get Best Stocks Delivered Daily!
Never Ever Miss A Move With Our Top Ten Stocks Lists
Find Best Stocks In Any Market - Bull or Bear Market
Take A Peek At Our Top Ten Stocks Lists: Daily, Weekly, Year-to-Date & Top Trends
Find Best Stocks In Any Market - Bull or Bear Market
Take A Peek At Our Top Ten Stocks Lists: Daily, Weekly, Year-to-Date & Top Trends
Financial Stocks With Best Up Trends [0-bearish to 100-bullish]: Better Home[100], AMREP Corp[100], PIMCO California[100], Torchmark [100], PIMCO California[100], Triumph Bancorp[100], StepStone [100], Radian [100], National Bank[100], PIMCO Municipal[100], MARA [100]
Best Financial Stocks Year-to-Date:
Insight Select[12384.6%], Oxford Lane[292.479%], Better Home[250.328%], Metalpha Technology[213.274%], Robinhood Markets[206.567%], Cipher Mining[145.528%], Mr. Cooper[133.957%], Banco Santander[130.037%], IHS Holding[117.61%], Deutsche Bank[114.776%], LoanDepot [110.733%] Best Financial Stocks This Week:
Colony Starwood[15929900%], Blackhawk Network[91300%], Macquarie Global[81662.9%], Credit Suisse[63241.6%], Pennsylvania Real[23823%], First Republic[22570.9%], Select ome[14000%], CorEnergy Infrastructure[6797.78%], FedNat Holding[5525%], BlackRock Municipal[5340%], BlackRock MuniYield[3379.04%] Best Financial Stocks Daily:
Better Home[13.3451%], AMREP Corp[11.992%], PIMCO California[11.9545%], Torchmark [11.8363%], Forge Global[11.5409%], PIMCO California[11.4754%], BlackRock Muni[10.8108%], Blackrock MuniYield[10.72%], Triumph Bancorp[10.2661%], StepStone [8.74771%], BlackRock MuniYield[8.15348%]