
 Login Sign Up


| |||||
 |  | ||||

| 12Stocks.com Market Intelligence |
Best Financial Stocks
| In a hurry? Financial Stocks Lists: Performance Trends Table, Stock Charts
Sort Financial stocks: Daily, Weekly, Year-to-Date, Market Cap & Trends. Filter Financial stocks list by size:All Financial Large Mid-Range Small & MicroCap |
| 12Stocks.com Financial Stocks Performances & Trends Daily | |||||||||
|
|  The overall Smart Investing & Trading Score is 33 (0-bearish to 100-bullish) which puts Financial sector in short term bearish to neutral trend. The Smart Investing & Trading Score from previous trading session is 26 and hence an improvement of trend.
| ||||||||
Here are the Smart Investing & Trading Scores of the most requested Financial stocks at 12Stocks.com (click stock name for detailed review):
|


| 12Stocks.com: Investing in Financial sector with Stocks | |
|
The following table helps investors and traders sort through current performance and trends (as measured by Smart Investing & Trading Score) of various
stocks in the Financial sector. Quick View: Move mouse or cursor over stock symbol (ticker) to view short-term Technical chart and over stock name to view long term chart. Click on  to add stock symbol to your watchlist and to add stock symbol to your watchlist and  to view watchlist. Click on any ticker or stock name for detailed market intelligence report for that stock. to view watchlist. Click on any ticker or stock name for detailed market intelligence report for that stock. |
12Stocks.com Performance of Stocks in Financial Sector
| Ticker | Stock Name | Watchlist | Category | Recent Price | Smart Investing & Trading Score | Change % | Weekly Change% |
| STC | Stewart Information |   | Insurance | 67.35 | 100 | 2.67% | 2.67% |
| COLB | Columbia Banking | | S&L | 23.88 | 43 | 2.67% | 2.67% |
| HTH | Hilltop | | Mortgage | 30.35 | 68 | 2.64% | 2.64% |
| AOMR | Angel Oak | | REIT - Mortgage | 9.43 | 73 | 2.61% | 2.61% |
| IBOC | Bancshares | | Regional - Southwest Banks | 69.20 | 76 | 2.61% | 2.61% |
| HIG | Hartford | | Insurance | 126.21 | 64 | 2.61% | 2.61% |
| PPBI | Pacific Premier | | Regional Banks | 21.73 | 60 | 2.60% | 2.60% |
| HR | Healthcare Realty | | REIT | 16.97 | 100 | 2.60% | 2.60% |
| FSBW | FS Bancorp | | Regional Banks | 38.82 | 43 | 2.59% | 2.59% |
| ARR | ARMOUR Residential | | Mortgage | 16.80 | 93 | 2.56% | 2.56% |
| SYF | Synchrony | | Credit Services | 69.25 | 53 | 2.55% | 2.55% |
| ITIC | Investors Title | | Insurance | 215.58 | 64 | 2.52% | 2.52% |
| NMRK | Newmark | | Property Mgmt | 15.50 | 95 | 2.51% | 2.51% |
| HIFS | Hingham Institution | | S&L | 245.84 | 66 | 2.51% | 2.51% |
| VICI | VICI Properties | | REIT - | 33.93 | 100 | 2.48% | 2.48% |
| XHR | Xenia Hotels | | REIT | 12.79 | 61 | 2.48% | 2.48% |
| NNN | National Retail | | REIT - | 43.05 | 93 | 2.45% | 2.45% |
| FNF | Fidelity National | | Insurance | 57.96 | 90 | 2.44% | 2.44% |
| CINF | Cinnati | | Insurance | 149.74 | 55 | 2.43% | 2.43% |
| RMR | RMR | | Real Estatet | 16.13 | 53 | 2.41% | 2.41% |
| REG | Regency Centers | | REIT - Retail | 72.18 | 63 | 2.41% | 2.41% |
| NTST | NetSTREIT | | REIT Retail | 18.75 | 100 | 2.40% | 2.40% |
| HOPE | Hope Bancorp | | Regional Banks | 9.94 | 17 | 2.37% | 2.37% |
| TRUP | Trupanion | | Insurance | 47.30 | 38 | 2.36% | 2.36% |
| CSGP | CoStar | | Property Mgmt | 96.83 | 83 | 2.36% | 2.36% |
| For chart view version of above stock list: Chart View ➞ 0 - 25 , 25 - 50 , 50 - 75 , 75 - 100 , 100 - 125 , 125 - 150 , 150 - 175 , 175 - 200 , 200 - 225 , 225 - 250 , 250 - 275 , 275 - 300 , 300 - 325 , 325 - 350 , 350 - 375 , 375 - 400 , 400 - 425 , 425 - 450 , 450 - 475 , 475 - 500 , 500 - 525 , 525 - 550 , 550 - 575 | ||
 | Click To Change The Sort Order: By Market Cap or Company Size Performance: Year-to-date, Week and Day |  |
|
Get the most comprehensive stock market coverage daily at 12Stocks.com ➞ Best Stocks Today ➞ Best Stocks Weekly ➞ Best Stocks Year-to-Date ➞ Best Stocks Trends ➞  Best Stocks Today 12Stocks.com Best Nasdaq Stocks ➞ Best S&P 500 Stocks ➞ Best Tech Stocks ➞ Best Biotech Stocks ➞ |
| Detailed Overview of Financial Stocks |
| Financial Technical Overview, Leaders & Laggards, Top Financial ETF Funds & Detailed Financial Stocks List, Charts, Trends & More |
| Financial Sector: Technical Analysis, Trends & YTD Performance | |
| Financial sector is composed of stocks
from banks, brokers, insurance, REITs
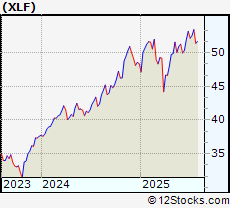
and services subsectors. Financial sector, as represented by XLF, an exchange-traded fund [ETF] that holds basket of Financial stocks (e.g, Bank of America, Goldman Sachs) is up by 7.8% and is currently outperforming the overall market by 0.27% year-to-date. Below is a quick view of Technical charts and trends: |
|
 XLF Weekly Chart |
|
| Long Term Trend: Good | |
| Medium Term Trend: Not Good | |
 XLF Daily Chart |
|
| Short Term Trend: Not Good | |
| Overall Trend Score: 33 | |
| YTD Performance: 7.8% | |
| **Trend Scores & Views Are Only For Educational Purposes And Not For Investing | |
| 12Stocks.com: Top Performing Financial Sector Stocks | ||||||||||||||||||||||||||||||||||||||||||||||||
 The top performing Financial sector stocks year to date are
Now, more recently, over last week, the top performing Financial sector stocks on the move are


|
||||||||||||||||||||||||||||||||||||||||||||||||
| 12Stocks.com: Investing in Financial Sector using Exchange Traded Funds | |
|
The following table shows list of key exchange traded funds (ETF) that
help investors track Financial Index. For detailed view, check out our ETF Funds section of our website. Quick View: Move mouse or cursor over ETF symbol (ticker) to view short-term Technical chart and over ETF name to view long term chart. Click on ticker or stock name for detailed view. Click on to add stock symbol to your watchlist and to view watchlist. |
12Stocks.com List of ETFs that track Financial Index
| Ticker | ETF Name | Watchlist | Recent Price | Smart Investing & Trading Score | Change % | Week % | Year-to-date % |
| XLF | Financial | | 51.91 | 33 | 0.99 | 0.99 | 7.8% |
| IAI | Broker-Dealers & Secs | | 174.97 | 63 | 2.34 | 2.34 | 21.82% |
| KBE | Bank | | 55.98 | 43 | 1.3 | 1.3 | 1.64% |
| FAS | Financial Bull 3X | | 161.82 | 33 | 2.91 | 2.91 | 7.48% |
| FAZ | Financial Bear 3X | | 4.54 | 62 | -2.78 | -2.78 | -27.4% |
| UYG | Financials | | 92.87 | 26 | 1.72 | 1.72 | 9% |
| KIE | Insurance | | 56.42 | 25 | 1.27 | 1.27 | 0.32% |
| 12Stocks.com: Charts, Trends, Fundamental Data and Performances of Financial Stocks | |
|
We now take in-depth look at all Financial stocks including charts, multi-period performances and overall trends (as measured by Smart Investing & Trading Score). One can sort Financial stocks (click link to choose) by Daily, Weekly and by Year-to-Date performances. Also, one can sort by size of the company or by market capitalization. |
| Select Your Default Chart Type: | |||||
| |||||
| Click on stock symbol or name for detailed view. Click on to add stock symbol to your watchlist and to view watchlist. Quick View: Move mouse or cursor over "Daily" to quickly view daily Technical stock chart and over "Weekly" to view weekly Technical stock chart. | |||||

 | STC Stewart Information Services Corporation |
| Sector: Financials | |
| SubSector: Property & Casualty Insurance | |
| MarketCap: 629.912 Millions | |
| Recent Price: 67.35 Smart Investing & Trading Score: 100 | |
| Day Percent Change: 2.67% Day Change: 1.75 | |
| Week Change: 2.67% Year-to-date Change: 0.5% | |
| STC Links: Profile News Message Board | |
| Charts:- Daily , Weekly | |
| Add STC to Watchlist: View: Get Complete STC Trend Analysis ➞ | |
 | COLB Columbia Banking System, Inc. |
| Sector: Financials | |
| SubSector: Savings & Loans | |
| MarketCap: 1868.3 Millions | |
| Recent Price: 23.88 Smart Investing & Trading Score: 43 | |
| Day Percent Change: 2.67% Day Change: 0.62 | |
| Week Change: 2.67% Year-to-date Change: -10.4% | |
| COLB Links: Profile News Message Board | |
| Charts:- Daily , Weekly | |
| Add COLB to Watchlist: View: Get Complete COLB Trend Analysis ➞ | |
 | HTH Hilltop Holdings Inc. |
| Sector: Financials | |
| SubSector: Mortgage Investment | |
| MarketCap: 1317.89 Millions | |
| Recent Price: 30.35 Smart Investing & Trading Score: 68 | |
| Day Percent Change: 2.64% Day Change: 0.78 | |
| Week Change: 2.64% Year-to-date Change: 6.6% | |
| HTH Links: Profile News Message Board | |
| Charts:- Daily , Weekly | |
| Add HTH to Watchlist: View: Get Complete HTH Trend Analysis ➞ | |
 | AOMR Angel Oak Mortgage REIT, Inc. |
| Sector: Financials | |
| SubSector: REIT - Mortgage | |
| MarketCap: 202 Millions | |
| Recent Price: 9.43 Smart Investing & Trading Score: 73 | |
| Day Percent Change: 2.61% Day Change: 0.24 | |
| Week Change: 2.61% Year-to-date Change: 4.9% | |
| AOMR Links: Profile News Message Board | |
| Charts:- Daily , Weekly | |
| Add AOMR to Watchlist: View: Get Complete AOMR Trend Analysis ➞ | |
 | IBOC International Bancshares Corporation |
| Sector: Financials | |
| SubSector: Regional - Southwest Banks | |
| MarketCap: 1159.45 Millions | |
| Recent Price: 69.20 Smart Investing & Trading Score: 76 | |
| Day Percent Change: 2.61% Day Change: 1.76 | |
| Week Change: 2.61% Year-to-date Change: 10.8% | |
| IBOC Links: Profile News Message Board | |
| Charts:- Daily , Weekly | |
| Add IBOC to Watchlist: View: Get Complete IBOC Trend Analysis ➞ | |
 | HIG The Hartford Financial Services Group, Inc. |
| Sector: Financials | |
| SubSector: Property & Casualty Insurance | |
| MarketCap: 12582.8 Millions | |
| Recent Price: 126.21 Smart Investing & Trading Score: 64 | |
| Day Percent Change: 2.61% Day Change: 3.21 | |
| Week Change: 2.61% Year-to-date Change: 15.9% | |
| HIG Links: Profile News Message Board | |
| Charts:- Daily , Weekly | |
| Add HIG to Watchlist: View: Get Complete HIG Trend Analysis ➞ | |
 | PPBI Pacific Premier Bancorp, Inc. |
| Sector: Financials | |
| SubSector: Regional - Pacific Banks | |
| MarketCap: 978.029 Millions | |
| Recent Price: 21.73 Smart Investing & Trading Score: 60 | |
| Day Percent Change: 2.6% Day Change: 0.55 | |
| Week Change: 2.6% Year-to-date Change: -11.7% | |
| PPBI Links: Profile News Message Board | |
| Charts:- Daily , Weekly | |
| Add PPBI to Watchlist: View: Get Complete PPBI Trend Analysis ➞ | |
 | HR Healthcare Realty Trust Incorporated |
| Sector: Financials | |
| SubSector: REIT - Healthcare Facilities | |
| MarketCap: 3718.84 Millions | |
| Recent Price: 16.97 Smart Investing & Trading Score: 100 | |
| Day Percent Change: 2.6% Day Change: 0.43 | |
| Week Change: 2.6% Year-to-date Change: 2.0% | |
| HR Links: Profile News Message Board | |
| Charts:- Daily , Weekly | |
| Add HR to Watchlist: View: Get Complete HR Trend Analysis ➞ | |
 | FSBW FS Bancorp, Inc. |
| Sector: Financials | |
| SubSector: Regional - Pacific Banks | |
| MarketCap: 140.429 Millions | |
| Recent Price: 38.82 Smart Investing & Trading Score: 43 | |
| Day Percent Change: 2.59% Day Change: 0.98 | |
| Week Change: 2.59% Year-to-date Change: -4.8% | |
| FSBW Links: Profile News Message Board | |
| Charts:- Daily , Weekly | |
| Add FSBW to Watchlist: View: Get Complete FSBW Trend Analysis ➞ | |
 | ARR ARMOUR Residential REIT, Inc. |
| Sector: Financials | |
| SubSector: Mortgage Investment | |
| MarketCap: 578.739 Millions | |
| Recent Price: 16.80 Smart Investing & Trading Score: 93 | |
| Day Percent Change: 2.56% Day Change: 0.42 | |
| Week Change: 2.56% Year-to-date Change: -5.8% | |
| ARR Links: Profile News Message Board | |
| Charts:- Daily , Weekly | |
| Add ARR to Watchlist: View: Get Complete ARR Trend Analysis ➞ | |
 | SYF Synchrony Financial |
| Sector: Financials | |
| SubSector: Credit Services | |
| MarketCap: 9297.28 Millions | |
| Recent Price: 69.25 Smart Investing & Trading Score: 53 | |
| Day Percent Change: 2.55% Day Change: 1.72 | |
| Week Change: 2.55% Year-to-date Change: 6.9% | |
| SYF Links: Profile News Message Board | |
| Charts:- Daily , Weekly | |
| Add SYF to Watchlist: View: Get Complete SYF Trend Analysis ➞ | |
 | ITIC Investors Title Company |
| Sector: Financials | |
| SubSector: Surety & Title Insurance | |
| MarketCap: 219.518 Millions | |
| Recent Price: 215.58 Smart Investing & Trading Score: 64 | |
| Day Percent Change: 2.52% Day Change: 5.3 | |
| Week Change: 2.52% Year-to-date Change: -8.8% | |
| ITIC Links: Profile News Message Board | |
| Charts:- Daily , Weekly | |
| Add ITIC to Watchlist: View: Get Complete ITIC Trend Analysis ➞ | |
 | NMRK Newmark Group, Inc. |
| Sector: Financials | |
| SubSector: Property Management | |
| MarketCap: 767.542 Millions | |
| Recent Price: 15.50 Smart Investing & Trading Score: 95 | |
| Day Percent Change: 2.51% Day Change: 0.38 | |
| Week Change: 2.51% Year-to-date Change: 21.3% | |
| NMRK Links: Profile News Message Board | |
| Charts:- Daily , Weekly | |
| Add NMRK to Watchlist: View: Get Complete NMRK Trend Analysis ➞ | |
 | HIFS Hingham Institution for Savings |
| Sector: Financials | |
| SubSector: Savings & Loans | |
| MarketCap: 341.93 Millions | |
| Recent Price: 245.84 Smart Investing & Trading Score: 66 | |
| Day Percent Change: 2.51% Day Change: 6.03 | |
| Week Change: 2.51% Year-to-date Change: -3.0% | |
| HIFS Links: Profile News Message Board | |
| Charts:- Daily , Weekly | |
| Add HIFS to Watchlist: View: Get Complete HIFS Trend Analysis ➞ | |
 | VICI VICI Properties Inc. |
| Sector: Financials | |
| SubSector: REIT - Diversified | |
| MarketCap: 7327.03 Millions | |
| Recent Price: 33.93 Smart Investing & Trading Score: 100 | |
| Day Percent Change: 2.48% Day Change: 0.82 | |
| Week Change: 2.48% Year-to-date Change: 17.7% | |
| VICI Links: Profile News Message Board | |
| Charts:- Daily , Weekly | |
| Add VICI to Watchlist: View: Get Complete VICI Trend Analysis ➞ | |
 | XHR Xenia Hotels & Resorts, Inc. |
| Sector: Financials | |
| SubSector: REIT - Hotel/Motel | |
| MarketCap: 1058.24 Millions | |
| Recent Price: 12.79 Smart Investing & Trading Score: 61 | |
| Day Percent Change: 2.48% Day Change: 0.31 | |
| Week Change: 2.48% Year-to-date Change: -12.9% | |
| XHR Links: Profile News Message Board | |
| Charts:- Daily , Weekly | |
| Add XHR to Watchlist: View: Get Complete XHR Trend Analysis ➞ | |
 | NNN National Retail Properties, Inc. |
| Sector: Financials | |
| SubSector: REIT - Diversified | |
| MarketCap: 5459.93 Millions | |
| Recent Price: 43.05 Smart Investing & Trading Score: 93 | |
| Day Percent Change: 2.45% Day Change: 1.03 | |
| Week Change: 2.45% Year-to-date Change: 7.0% | |
| NNN Links: Profile News Message Board | |
| Charts:- Daily , Weekly | |
| Add NNN to Watchlist: View: Get Complete NNN Trend Analysis ➞ | |
 | FNF Fidelity National Financial, Inc. |
| Sector: Financials | |
| SubSector: Surety & Title Insurance | |
| MarketCap: 6532.18 Millions | |
| Recent Price: 57.96 Smart Investing & Trading Score: 90 | |
| Day Percent Change: 2.44% Day Change: 1.38 | |
| Week Change: 2.44% Year-to-date Change: 4.0% | |
| FNF Links: Profile News Message Board | |
| Charts:- Daily , Weekly | |
| Add FNF to Watchlist: View: Get Complete FNF Trend Analysis ➞ | |
 | CINF Cincinnati Financial Corporation |
| Sector: Financials | |
| SubSector: Property & Casualty Insurance | |
| MarketCap: 13637 Millions | |
| Recent Price: 149.74 Smart Investing & Trading Score: 55 | |
| Day Percent Change: 2.43% Day Change: 3.55 | |
| Week Change: 2.43% Year-to-date Change: 4.8% | |
| CINF Links: Profile News Message Board | |
| Charts:- Daily , Weekly | |
| Add CINF to Watchlist: View: Get Complete CINF Trend Analysis ➞ | |
 | RMR The RMR Group Inc. |
| Sector: Financials | |
| SubSector: Real Estate Development | |
| MarketCap: 797.419 Millions | |
| Recent Price: 16.13 Smart Investing & Trading Score: 53 | |
| Day Percent Change: 2.41% Day Change: 0.38 | |
| Week Change: 2.41% Year-to-date Change: -17.5% | |
| RMR Links: Profile News Message Board | |
| Charts:- Daily , Weekly | |
| Add RMR to Watchlist: View: Get Complete RMR Trend Analysis ➞ | |
 | REG Regency Centers Corporation |
| Sector: Financials | |
| SubSector: REIT - Retail | |
| MarketCap: 6345.84 Millions | |
| Recent Price: 72.18 Smart Investing & Trading Score: 63 | |
| Day Percent Change: 2.41% Day Change: 1.7 | |
| Week Change: 2.41% Year-to-date Change: -1.4% | |
| REG Links: Profile News Message Board | |
| Charts:- Daily , Weekly | |
| Add REG to Watchlist: View: Get Complete REG Trend Analysis ➞ | |
 | NTST NetSTREIT Corp. |
| Sector: Financials | |
| SubSector: REIT Retail | |
| MarketCap: 51267 Millions | |
| Recent Price: 18.75 Smart Investing & Trading Score: 100 | |
| Day Percent Change: 2.4% Day Change: 0.44 | |
| Week Change: 2.4% Year-to-date Change: 34.4% | |
| NTST Links: Profile News Message Board | |
| Charts:- Daily , Weekly | |
| Add NTST to Watchlist: View: Get Complete NTST Trend Analysis ➞ | |
 | HOPE Hope Bancorp, Inc. |
| Sector: Financials | |
| SubSector: Regional - Pacific Banks | |
| MarketCap: 1099.29 Millions | |
| Recent Price: 9.94 Smart Investing & Trading Score: 17 | |
| Day Percent Change: 2.37% Day Change: 0.23 | |
| Week Change: 2.37% Year-to-date Change: -18.2% | |
| HOPE Links: Profile News Message Board | |
| Charts:- Daily , Weekly | |
| Add HOPE to Watchlist: View: Get Complete HOPE Trend Analysis ➞ | |
 | TRUP Trupanion, Inc. |
| Sector: Financials | |
| SubSector: Accident & Health Insurance | |
| MarketCap: 852.06 Millions | |
| Recent Price: 47.30 Smart Investing & Trading Score: 38 | |
| Day Percent Change: 2.36% Day Change: 1.09 | |
| Week Change: 2.36% Year-to-date Change: -1.9% | |
| TRUP Links: Profile News Message Board | |
| Charts:- Daily , Weekly | |
| Add TRUP to Watchlist: View: Get Complete TRUP Trend Analysis ➞ | |
 | CSGP CoStar Group, Inc. |
| Sector: Financials | |
| SubSector: Property Management | |
| MarketCap: 21454.4 Millions | |
| Recent Price: 96.83 Smart Investing & Trading Score: 83 | |
| Day Percent Change: 2.36% Day Change: 2.23 | |
| Week Change: 2.36% Year-to-date Change: 35.3% | |
| CSGP Links: Profile News Message Board | |
| Charts:- Daily , Weekly | |
| Add CSGP to Watchlist: View: Get Complete CSGP Trend Analysis ➞ | |
| For tabular summary view of above stock list: Summary View ➞ 0 - 25 , 25 - 50 , 50 - 75 , 75 - 100 , 100 - 125 , 125 - 150 , 150 - 175 , 175 - 200 , 200 - 225 , 225 - 250 , 250 - 275 , 275 - 300 , 300 - 325 , 325 - 350 , 350 - 375 , 375 - 400 , 400 - 425 , 425 - 450 , 450 - 475 , 475 - 500 , 500 - 525 , 525 - 550 , 550 - 575 | ||
| Click To Change The Sort Order: By Market Cap or Company Size Performance: Year-to-date, Week and Day | |
| Select Chart Type: | ||
|
Best Stocks Today 12Stocks.com |
© 2025 12Stocks.com Terms & Conditions Privacy Contact Us
All Information Provided Only For Education And Not To Be Used For Investing or Trading. See Terms & Conditions


One More Thing ... Get Best Stocks Delivered Daily!
Never Ever Miss A Move With Our Top Ten Stocks Lists
Find Best Stocks In Any Market - Bull or Bear Market
Take A Peek At Our Top Ten Stocks Lists: Daily, Weekly, Year-to-Date & Top Trends
Find Best Stocks In Any Market - Bull or Bear Market
Take A Peek At Our Top Ten Stocks Lists: Daily, Weekly, Year-to-Date & Top Trends
Financial Stocks With Best Up Trends [0-bearish to 100-bullish]: Uniti [100], LendingTree [100], Mercury General[100], Perella Weinberg[100], Broadstone Net[100], LendingClub [100], TPG RE[100], CareTrust REIT[100], Stewart Information[100], Healthcare Realty[100], VICI Properties[100]
Best Financial Stocks Year-to-Date:
ESSA Bancorp[3207.77%], Easterly Government[108.45%], Mr. Cooper[86.58%], Heritage Insurance[75.29%], Root [65.29%], Industrial Logistics[64.89%], Rocket [58.42%], Diversified Healthcare[49.61%], ProAssurance [49.59%], Uniti [47.09%], SoFi Technologies[41.62%] Best Financial Stocks This Week:
Uniti [64.77%], Industrial Logistics[11.36%], LendingTree [7.32%], eXp World[7.27%], EverQuote [6.89%], Camping World[6.84%], First Foundation[6.69%], Diamond Hill[5.46%], Mercury General[5.36%], Cipher Mining[5.27%], AlTi Global[5.13%] Best Financial Stocks Daily:
Uniti [64.77%], Industrial Logistics[11.36%], LendingTree [7.32%], eXp World[7.27%], EverQuote [6.89%], Camping World[6.84%], First Foundation[6.69%], Diamond Hill[5.46%], Mercury General[5.36%], Cipher Mining[5.27%], AlTi Global[5.13%]