
 Login Sign Up


| |||||
 |  | ||||

| 12Stocks.com Market Intelligence |
Best Financial Stocks
| In a hurry? Financial Stocks Lists: Performance Trends Table, Stock Charts
Sort Financial stocks: Daily, Weekly, Year-to-Date, Market Cap & Trends. Filter Financial stocks list by size:All Financial Large Mid-Range Small & MicroCap |
| 12Stocks.com Financial Stocks Performances & Trends Daily | |||||||||
|
|  The overall Smart Investing & Trading Score is 20 (0-bearish to 100-bullish) which puts Financial sector in short term bearish trend. The Smart Investing & Trading Score from previous trading session is 30 and a deterioration of trend continues.
| ||||||||
Here are the Smart Investing & Trading Scores of the most requested Financial stocks at 12Stocks.com (click stock name for detailed review):
|


| 12Stocks.com: Investing in Financial sector with Stocks | |
|
The following table helps investors and traders sort through current performance and trends (as measured by Smart Investing & Trading Score) of various
stocks in the Financial sector. Quick View: Move mouse or cursor over stock symbol (ticker) to view short-term Technical chart and over stock name to view long term chart. Click on  to add stock symbol to your watchlist and to add stock symbol to your watchlist and  to view watchlist. Click on any ticker or stock name for detailed market intelligence report for that stock. to view watchlist. Click on any ticker or stock name for detailed market intelligence report for that stock. |
12Stocks.com Performance of Stocks in Financial Sector
| Ticker | Stock Name | Watchlist | Category | Recent Price | Trend Score | Change % | YTD Change% |
| NYMTP | New York |   | Mortgage | 25.32 | 30 | 0.00% | 0.00% |
| FCB | FCB | | Regional Banks | 68.64 | 100 | 0.51% | 0.00% |
| SKWD | Skyward Specialty | | Insurance - Property & Casualty | 45.77 | 10 | -0.30% | -2.18% |
| ANAT | American National | | Insurance | 242.06 | 70 | 0.21% | 0.00% |
| AGII | Argo | | Insurance | 75.38 | 30 | 0.40% | 0.00% |
| OFC | Corporate Office | | REIT - Office | 24.11 | 50 | -1.83% | 0.00% |
| HHC | Howard Hughes | | Real Estatet | 67.85 | 0 | -0.91% | 0.00% |
| LTXB | LegacyTexas | | Regional Banks | 68.64 | 100 | 0.51% | 0.00% |
| OFG | OFG Bancorp | | Banks - Regional | 42.49 | 0 | -0.61% | 3.63% |
| HAWK | Blackhawk Network | | Credit Services | 36.56 | 70 | -2.06% | 0.00% |
| RVT | Royce Small | | Closed-End Fund - Equity | 16.24 | 80 | 0.00% | 7.34% |
| NTB | Bank of N T Butterfield & Son | | Banks - | 42.14 | 0 | -1.08% | 19.88% |
| USA | Liberty All-Star | | Closed-End Fund - Equity | 6.45 | 40 | 1.10% | -0.71% |
| BHFAP | Brighthouse | | Life Insurance | 16.22 | 20 | -1.22% | -24.18% |
| STL | Sterling Bancorp | | Banks | 14.06 | 30 | 0.50% | 0.00% |
| GZT | Gazit Globe | | Real Estatet | 59.21 | 20 | -0.77% | 0.00% |
| WRE | Washington Real | | REIT - Office | 17.57 | 10 | 0.00% | 0.00% |
| LC | LendingClub Corp | | Banks - Regional | 14.97 | 10 | 0.27% | -7.19% |
| PWP | Perella Weinberg | | Capital Markets | 21.01 | 30 | 1.25% | -10.20% |
| TRUP | Trupanion | | Insurance - Property & Casualty | 43.26 | 20 | -0.41% | -10.25% |
| GAB | Gabelli Equity | | Closed-End Fund - Equity | 6.15 | 70 | 0.00% | 14.53% |
| HMN | Horace Mann | | Insurance - Property & Casualty | 44.21 | 10 | -0.50% | 16.18% |
| IBKC | IBERIABANK | | Regional Banks | 22.91 | 40 | -0.30% | 0.00% |
| VBTX | Veritex | | Banks - Regional | 33.07 | 20 | 0.00% | 28.37% |
| BOFI | BofI Holding | | S&L | 93.70 | 90 | 1.00% | 0.00% |
| For chart view version of above stock list: Chart View ➞ 0 - 25 , 25 - 50 , 50 - 75 , 75 - 100 , 100 - 125 , 125 - 150 , 150 - 175 , 175 - 200 , 200 - 225 , 225 - 250 , 250 - 275 , 275 - 300 , 300 - 325 , 325 - 350 , 350 - 375 , 375 - 400 , 400 - 425 , 425 - 450 , 450 - 475 , 475 - 500 , 500 - 525 , 525 - 550 , 550 - 575 , 575 - 600 , 600 - 625 , 625 - 650 , 650 - 675 , 675 - 700 , 700 - 725 , 725 - 750 , 750 - 775 , 775 - 800 , 800 - 825 , 825 - 850 , 850 - 875 , 875 - 900 , 900 - 925 , 925 - 950 , 950 - 975 , 975 - 1000 , 1000 - 1025 , 1025 - 1050 , 1050 - 1075 , 1075 - 1100 , 1100 - 1125 , 1125 - 1150 , 1150 - 1175 , 1175 - 1200 , 1200 - 1225 , 1225 - 1250 , 1250 - 1275 , 1275 - 1300 , 1300 - 1325 , 1325 - 1350 , 1350 - 1375 , 1375 - 1400 , 1400 - 1425 , 1425 - 1450 , 1450 - 1475 , 1475 - 1500 , 1500 - 1525 , 1525 - 1550 | ||
 | Click To Change The Sort Order: By Market Cap or Company Size Performance: Year-to-date, Week and Day |  |
|
Get the most comprehensive stock market coverage daily at 12Stocks.com ➞ Best Stocks Today ➞ Best Stocks Weekly ➞ Best Stocks Year-to-Date ➞ Best Stocks Trends ➞  Best Stocks Today 12Stocks.com Best Nasdaq Stocks ➞ Best S&P 500 Stocks ➞ Best Tech Stocks ➞ Best Biotech Stocks ➞ |
| Detailed Overview of Financial Stocks |
| Financial Technical Overview, Leaders & Laggards, Top Financial ETF Funds & Detailed Financial Stocks List, Charts, Trends & More |
| Financial Sector: Technical Analysis, Trends & YTD Performance | |
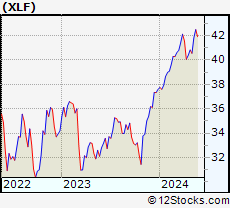
| Financial sector is composed of stocks
from banks, brokers, insurance, REITs
and services subsectors. Financial sector, as represented by XLF, an exchange-traded fund [ETF] that holds basket of Financial stocks (e.g, Bank of America, Goldman Sachs) is up by 11.4442% and is currently underperforming the overall market by -3.3137% year-to-date. Below is a quick view of Technical charts and trends: |
|
 XLF Weekly Chart |
|
| Long Term Trend: Good | |
| Medium Term Trend: Not Good | |
 XLF Daily Chart |
|
| Short Term Trend: Not Good | |
| Overall Trend Score: 20 | |
| YTD Performance: 11.4442% | |
| **Trend Scores & Views Are Only For Educational Purposes And Not For Investing | |
| 12Stocks.com: Top Performing Financial Sector Stocks | |||||||||||||||||||||||||||||||||||||||||||||||
 The top performing Financial sector stocks year to date are
Now, more recently, over last week, the top performing Financial sector stocks on the move are


|
|||||||||||||||||||||||||||||||||||||||||||||||
| 12Stocks.com: Investing in Financial Sector using Exchange Traded Funds | |
|
The following table shows list of key exchange traded funds (ETF) that
help investors track Financial Index. For detailed view, check out our ETF Funds section of our website. Quick View: Move mouse or cursor over ETF symbol (ticker) to view short-term Technical chart and over ETF name to view long term chart. Click on ticker or stock name for detailed view. Click on to add stock symbol to your watchlist and to view watchlist. |
12Stocks.com List of ETFs that track Financial Index
| Ticker | ETF Name | Watchlist | Recent Price | Smart Investing & Trading Score | Change % | Week % | Year-to-date % |
| CHIX | China Financials | | 10.57 | 20 | 0 | 0 | 0% |
| 12Stocks.com: Charts, Trends, Fundamental Data and Performances of Financial Stocks | |
|
We now take in-depth look at all Financial stocks including charts, multi-period performances and overall trends (as measured by Smart Investing & Trading Score). One can sort Financial stocks (click link to choose) by Daily, Weekly and by Year-to-Date performances. Also, one can sort by size of the company or by market capitalization. |
| Select Your Default Chart Type: | |||||
| |||||
| Click on stock symbol or name for detailed view. Click on to add stock symbol to your watchlist and to view watchlist. Quick View: Move mouse or cursor over "Daily" to quickly view daily Technical stock chart and over "Weekly" to view weekly Technical stock chart. | |||||

 | NYMTP New York Mortgage Trust, Inc. |
| Sector: Financials | |
| SubSector: Mortgage Investment | |
| MarketCap: 2047.69 Millions | |
| Recent Price: 25.32 Smart Investing & Trading Score: 30 | |
| Day Percent Change: 0% Day Change: -9999 | |
| Week Change: 0.00197472% Year-to-date Change: 0.0% | |
| NYMTP Links: Profile News Message Board | |
| Charts:- Daily , Weekly | |
| Add NYMTP to Watchlist: View: Get Complete NYMTP Trend Analysis ➞ | |
 | FCB FCB Financial Holdings, Inc. |
| Sector: Financials | |
| SubSector: Regional - Southeast Banks | |
| MarketCap: 2044.44 Millions | |
| Recent Price: 68.64 Smart Investing & Trading Score: 100 | |
| Day Percent Change: 0.51252% Day Change: -9999 | |
| Week Change: 66.6424% Year-to-date Change: 0.0% | |
| FCB Links: Profile News Message Board | |
| Charts:- Daily , Weekly | |
| Add FCB to Watchlist: View: Get Complete FCB Trend Analysis ➞ | |
 | SKWD Skyward Specialty Insurance Group Inc |
| Sector: Financials | |
| SubSector: Insurance - Property & Casualty | |
| MarketCap: 2033.64 Millions | |
| Recent Price: 45.77 Smart Investing & Trading Score: 10 | |
| Day Percent Change: -0.3% Day Change: -0.15 | |
| Week Change: 1.85% Year-to-date Change: -2.2% | |
| SKWD Links: Profile News Message Board | |
| Charts:- Daily , Weekly | |
| Add SKWD to Watchlist: View: Get Complete SKWD Trend Analysis ➞ | |
 | ANAT American National Insurance Company |
| Sector: Financials | |
| SubSector: Property & Casualty Insurance | |
| MarketCap: 2024.22 Millions | |
| Recent Price: 242.06 Smart Investing & Trading Score: 70 | |
| Day Percent Change: 0.206988% Day Change: -9999 | |
| Week Change: 27.3866% Year-to-date Change: 0.0% | |
| ANAT Links: Profile News Message Board | |
| Charts:- Daily , Weekly | |
| Add ANAT to Watchlist: View: Get Complete ANAT Trend Analysis ➞ | |
 | AGII Argo Group International Holdings, Ltd. |
| Sector: Financials | |
| SubSector: Property & Casualty Insurance | |
| MarketCap: 2021.66 Millions | |
| Recent Price: 75.38 Smart Investing & Trading Score: 30 | |
| Day Percent Change: 0.399574% Day Change: -9999 | |
| Week Change: 32.1992% Year-to-date Change: 0.0% | |
| AGII Links: Profile News Message Board | |
| Charts:- Daily , Weekly | |
| Add AGII to Watchlist: View: Get Complete AGII Trend Analysis ➞ | |
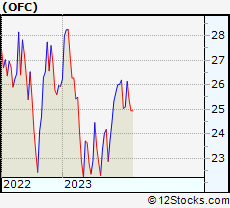 | OFC Corporate Office Properties Trust |
| Sector: Financials | |
| SubSector: REIT - Office | |
| MarketCap: 2015.76 Millions | |
| Recent Price: 24.11 Smart Investing & Trading Score: 50 | |
| Day Percent Change: -1.83225% Day Change: -9999 | |
| Week Change: 2.33447% Year-to-date Change: 0.0% | |
| OFC Links: Profile News Message Board | |
| Charts:- Daily , Weekly | |
| Add OFC to Watchlist: View: Get Complete OFC Trend Analysis ➞ | |
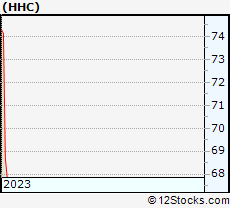 | HHC The Howard Hughes Corporation |
| Sector: Financials | |
| SubSector: Real Estate Development | |
| MarketCap: 2002.49 Millions | |
| Recent Price: 67.85 Smart Investing & Trading Score: 0 | |
| Day Percent Change: -0.905506% Day Change: -9999 | |
| Week Change: -2.64026% Year-to-date Change: 0.0% | |
| HHC Links: Profile News Message Board | |
| Charts:- Daily , Weekly | |
| Add HHC to Watchlist: View: Get Complete HHC Trend Analysis ➞ | |
 | LTXB LegacyTexas Financial Group, Inc. |
| Sector: Financials | |
| SubSector: Regional - Southwest Banks | |
| MarketCap: 1994.52 Millions | |
| Recent Price: 68.64 Smart Investing & Trading Score: 100 | |
| Day Percent Change: 0.51252% Day Change: -9999 | |
| Week Change: 1542.11% Year-to-date Change: 0.0% | |
| LTXB Links: Profile News Message Board | |
| Charts:- Daily , Weekly | |
| Add LTXB to Watchlist: View: Get Complete LTXB Trend Analysis ➞ | |
 | OFG OFG Bancorp |
| Sector: Financials | |
| SubSector: Banks - Regional | |
| MarketCap: 1994.46 Millions | |
| Recent Price: 42.49 Smart Investing & Trading Score: 0 | |
| Day Percent Change: -0.608187% Day Change: -0.21 | |
| Week Change: -4.19391% Year-to-date Change: 3.6% | |
| OFG Links: Profile News Message Board | |
| Charts:- Daily , Weekly | |
| Add OFG to Watchlist: View: Get Complete OFG Trend Analysis ➞ | |
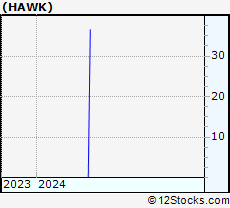 | HAWK Blackhawk Network Holdings, Inc. |
| Sector: Financials | |
| SubSector: Credit Services | |
| MarketCap: 1957.47 Millions | |
| Recent Price: 36.56 Smart Investing & Trading Score: 70 | |
| Day Percent Change: -2.06268% Day Change: -9999 | |
| Week Change: 91300% Year-to-date Change: 0.0% | |
| HAWK Links: Profile News Message Board | |
| Charts:- Daily , Weekly | |
| Add HAWK to Watchlist: View: Get Complete HAWK Trend Analysis ➞ | |
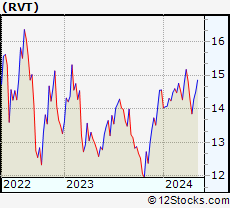 | RVT Royce Small Cap Trust Inc |
| Sector: Financials | |
| SubSector: Closed-End Fund - Equity | |
| MarketCap: 1957.11 Millions | |
| Recent Price: 16.24 Smart Investing & Trading Score: 80 | |
| Day Percent Change: 0% Day Change: 0.01 | |
| Week Change: 0.246914% Year-to-date Change: 7.3% | |
| RVT Links: Profile News Message Board | |
| Charts:- Daily , Weekly | |
| Add RVT to Watchlist: View: Get Complete RVT Trend Analysis ➞ | |
 | NTB Bank of N T Butterfield & Son Ltd |
| Sector: Financials | |
| SubSector: Banks - Diversified | |
| MarketCap: 1944.84 Millions | |
| Recent Price: 42.14 Smart Investing & Trading Score: 0 | |
| Day Percent Change: -1.07981% Day Change: -0.26 | |
| Week Change: -5.43088% Year-to-date Change: 19.9% | |
| NTB Links: Profile News Message Board | |
| Charts:- Daily , Weekly | |
| Add NTB to Watchlist: View: Get Complete NTB Trend Analysis ➞ | |
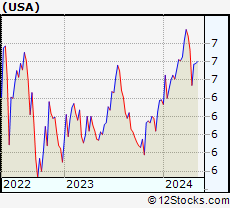 | USA Liberty All-Star Equity Fund |
| Sector: Financials | |
| SubSector: Closed-End Fund - Equity | |
| MarketCap: 1939.61 Millions | |
| Recent Price: 6.45 Smart Investing & Trading Score: 40 | |
| Day Percent Change: 1.09718% Day Change: -0.08 | |
| Week Change: -0.154799% Year-to-date Change: -0.7% | |
| USA Links: Profile News Message Board | |
| Charts:- Daily , Weekly | |
| Add USA to Watchlist: View: Get Complete USA Trend Analysis ➞ | |
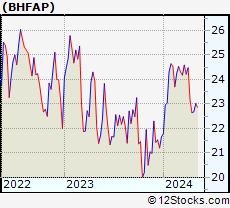 | BHFAP Brighthouse Financial, Inc. |
| Sector: Financials | |
| SubSector: Life Insurance | |
| MarketCap: 1936.76 Millions | |
| Recent Price: 16.22 Smart Investing & Trading Score: 20 | |
| Day Percent Change: -1.21863% Day Change: -0.19 | |
| Week Change: 1.82046% Year-to-date Change: -24.2% | |
| BHFAP Links: Profile News Message Board | |
| Charts:- Daily , Weekly | |
| Add BHFAP to Watchlist: View: Get Complete BHFAP Trend Analysis ➞ | |
 | STL Sterling Bancorp |
| Sector: Financials | |
| SubSector: Money Center Banks | |
| MarketCap: 1932.09 Millions | |
| Recent Price: 14.06 Smart Investing & Trading Score: 30 | |
| Day Percent Change: 0.500357% Day Change: -9999 | |
| Week Change: -48.2517% Year-to-date Change: 0.0% | |
| STL Links: Profile News Message Board | |
| Charts:- Daily , Weekly | |
| Add STL to Watchlist: View: Get Complete STL Trend Analysis ➞ | |
 | GZT Gazit Globe Ltd |
| Sector: Financials | |
| SubSector: Real Estate Development | |
| MarketCap: 1931.8 Millions | |
| Recent Price: 59.21 Smart Investing & Trading Score: 20 | |
| Day Percent Change: -0.770907% Day Change: -9999 | |
| Week Change: 0.101437% Year-to-date Change: 0.0% | |
| GZT Links: Profile News Message Board | |
| Charts:- Daily , Weekly | |
| Add GZT to Watchlist: View: Get Complete GZT Trend Analysis ➞ | |
 | WRE Washington Real Estate Investment Trust |
| Sector: Financials | |
| SubSector: REIT - Office | |
| MarketCap: 1928.46 Millions | |
| Recent Price: 17.57 Smart Investing & Trading Score: 10 | |
| Day Percent Change: 0% Day Change: -9999 | |
| Week Change: 0% Year-to-date Change: 0.0% | |
| WRE Links: Profile News Message Board | |
| Charts:- Daily , Weekly | |
| Add WRE to Watchlist: View: Get Complete WRE Trend Analysis ➞ | |
 | LC LendingClub Corp |
| Sector: Financials | |
| SubSector: Banks - Regional | |
| MarketCap: 1904.69 Millions | |
| Recent Price: 14.97 Smart Investing & Trading Score: 10 | |
| Day Percent Change: 0.267917% Day Change: 0.18 | |
| Week Change: -10.3593% Year-to-date Change: -7.2% | |
| LC Links: Profile News Message Board | |
| Charts:- Daily , Weekly | |
| Add LC to Watchlist: View: Get Complete LC Trend Analysis ➞ | |
 | PWP Perella Weinberg Partners |
| Sector: Financials | |
| SubSector: Capital Markets | |
| MarketCap: 1900.92 Millions | |
| Recent Price: 21.01 Smart Investing & Trading Score: 30 | |
| Day Percent Change: 1.25301% Day Change: -0.19 | |
| Week Change: -2.82146% Year-to-date Change: -10.2% | |
| PWP Links: Profile News Message Board | |
| Charts:- Daily , Weekly | |
| Add PWP to Watchlist: View: Get Complete PWP Trend Analysis ➞ | |
 | TRUP Trupanion Inc |
| Sector: Financials | |
| SubSector: Insurance - Property & Casualty | |
| MarketCap: 1895.64 Millions | |
| Recent Price: 43.26 Smart Investing & Trading Score: 20 | |
| Day Percent Change: -0.414365% Day Change: -0.02 | |
| Week Change: 2.00424% Year-to-date Change: -10.2% | |
| TRUP Links: Profile News Message Board | |
| Charts:- Daily , Weekly | |
| Add TRUP to Watchlist: View: Get Complete TRUP Trend Analysis ➞ | |
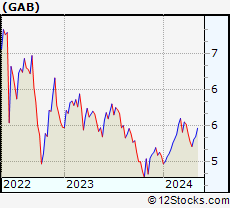 | GAB Gabelli Equity Trust Inc |
| Sector: Financials | |
| SubSector: Closed-End Fund - Equity | |
| MarketCap: 1886.48 Millions | |
| Recent Price: 6.15 Smart Investing & Trading Score: 70 | |
| Day Percent Change: 0% Day Change: -0.05 | |
| Week Change: -0.485437% Year-to-date Change: 14.5% | |
| GAB Links: Profile News Message Board | |
| Charts:- Daily , Weekly | |
| Add GAB to Watchlist: View: Get Complete GAB Trend Analysis ➞ | |
 | HMN Horace Mann Educators Corp |
| Sector: Financials | |
| SubSector: Insurance - Property & Casualty | |
| MarketCap: 1883.4 Millions | |
| Recent Price: 44.21 Smart Investing & Trading Score: 10 | |
| Day Percent Change: -0.495161% Day Change: -0.05 | |
| Week Change: -3.38724% Year-to-date Change: 16.2% | |
| HMN Links: Profile News Message Board | |
| Charts:- Daily , Weekly | |
| Add HMN to Watchlist: View: Get Complete HMN Trend Analysis ➞ | |
 | IBKC IBERIABANK Corporation |
| Sector: Financials | |
| SubSector: Regional - Southeast Banks | |
| MarketCap: 1874.75 Millions | |
| Recent Price: 22.91 Smart Investing & Trading Score: 40 | |
| Day Percent Change: -0.304613% Day Change: -9999 | |
| Week Change: -2.59354% Year-to-date Change: 0.0% | |
| IBKC Links: Profile News Message Board | |
| Charts:- Daily , Weekly | |
| Add IBKC to Watchlist: View: Get Complete IBKC Trend Analysis ➞ | |
 | VBTX Veritex Holdings Inc |
| Sector: Financials | |
| SubSector: Banks - Regional | |
| MarketCap: 1873.39 Millions | |
| Recent Price: 33.07 Smart Investing & Trading Score: 20 | |
| Day Percent Change: 0% Day Change: -0.23 | |
| Week Change: -1.84031% Year-to-date Change: 28.4% | |
| VBTX Links: Profile News Message Board | |
| Charts:- Daily , Weekly | |
| Add VBTX to Watchlist: View: Get Complete VBTX Trend Analysis ➞ | |
 | BOFI BofI Holding, Inc. |
| Sector: Financials | |
| SubSector: Savings & Loans | |
| MarketCap: 1871.86 Millions | |
| Recent Price: 93.70 Smart Investing & Trading Score: 90 | |
| Day Percent Change: 1.00248% Day Change: -9999 | |
| Week Change: 71.7375% Year-to-date Change: 0.0% | |
| BOFI Links: Profile News Message Board | |
| Charts:- Daily , Weekly | |
| Add BOFI to Watchlist: View: Get Complete BOFI Trend Analysis ➞ | |
| For tabular summary view of above stock list: Summary View ➞ 0 - 25 , 25 - 50 , 50 - 75 , 75 - 100 , 100 - 125 , 125 - 150 , 150 - 175 , 175 - 200 , 200 - 225 , 225 - 250 , 250 - 275 , 275 - 300 , 300 - 325 , 325 - 350 , 350 - 375 , 375 - 400 , 400 - 425 , 425 - 450 , 450 - 475 , 475 - 500 , 500 - 525 , 525 - 550 , 550 - 575 , 575 - 600 , 600 - 625 , 625 - 650 , 650 - 675 , 675 - 700 , 700 - 725 , 725 - 750 , 750 - 775 , 775 - 800 , 800 - 825 , 825 - 850 , 850 - 875 , 875 - 900 , 900 - 925 , 925 - 950 , 950 - 975 , 975 - 1000 , 1000 - 1025 , 1025 - 1050 , 1050 - 1075 , 1075 - 1100 , 1100 - 1125 , 1125 - 1150 , 1150 - 1175 , 1175 - 1200 , 1200 - 1225 , 1225 - 1250 , 1250 - 1275 , 1275 - 1300 , 1300 - 1325 , 1325 - 1350 , 1350 - 1375 , 1375 - 1400 , 1400 - 1425 , 1425 - 1450 , 1450 - 1475 , 1475 - 1500 , 1500 - 1525 , 1525 - 1550 | ||
| Click To Change The Sort Order: By Market Cap or Company Size Performance: Year-to-date, Week and Day | |
| Select Chart Type: | ||
|
Best Stocks Today 12Stocks.com |
© 2025 12Stocks.com Terms & Conditions Privacy Contact Us
All Information Provided Only For Education And Not To Be Used For Investing or Trading. See Terms & Conditions


One More Thing ... Get Best Stocks Delivered Daily!
Never Ever Miss A Move With Our Top Ten Stocks Lists
Find Best Stocks In Any Market - Bull or Bear Market
Take A Peek At Our Top Ten Stocks Lists: Daily, Weekly, Year-to-Date & Top Trends
Find Best Stocks In Any Market - Bull or Bear Market
Take A Peek At Our Top Ten Stocks Lists: Daily, Weekly, Year-to-Date & Top Trends
Financial Stocks With Best Up Trends [0-bearish to 100-bullish]: PIMCO California[100], Torchmark [100], PIMCO California[100], Triumph Bancorp[100], Cipher Mining[100], Lufax Holding[100], PIMCO Municipal[100], PIMCO Municipal[100], Front Yard[100], National General[100], Fifth Street[100]
Best Financial Stocks Year-to-Date:
Insight Select[12384.6%], Better Home[523.632%], IREN [363.5%], Global Medical[353.709%], Oxford Lane[287.756%], Robinhood Markets[269.422%], Metalpha Technology[225.664%], Cipher Mining[185.3%], Banco Santander[131.403%], Mr. Cooper[124.245%], Altisource Portfolio[121.195%] Best Financial Stocks This Week:
Colony Starwood[15929900%], Blackhawk Network[91300%], Macquarie Global[81662.9%], Credit Suisse[63241.6%], Pennsylvania Real[23823%], First Republic[22570.9%], Select ome[14000%], CorEnergy Infrastructure[6797.78%], FedNat Holding[5525%], BlackRock Municipal[5340%], BlackRock MuniYield[3379.04%] Best Financial Stocks Daily:
PIMCO California[11.9545%], Torchmark [11.8363%], PIMCO California[11.4754%], BlackRock Muni[10.8108%], Blackrock MuniYield[10.72%], Triumph Bancorp[10.2661%], Cipher Mining[9.36508%], AMBAC [8.24108%], BlackRock MuniYield[8.15348%], Summit [7.79817%], Concord Acquisition[7.63431%]