
 Login Sign Up


| |||||
 |  | ||||

| 12Stocks.com Market Intelligence |
Best Financial Stocks
| In a hurry? Financial Stocks Lists: Performance Trends Table, Stock Charts
Sort Financial stocks: Daily, Weekly, Year-to-Date, Market Cap & Trends. Filter Financial stocks list by size:All Financial Large Mid-Range Small & MicroCap |
| 12Stocks.com Financial Stocks Performances & Trends Daily | |||||||||
|
|  The overall Smart Investing & Trading Score is 33 (0-bearish to 100-bullish) which puts Financial sector in short term bearish to neutral trend. The Smart Investing & Trading Score from previous trading session is 26 and hence an improvement of trend.
| ||||||||
Here are the Smart Investing & Trading Scores of the most requested Financial stocks at 12Stocks.com (click stock name for detailed review):
|


| 12Stocks.com: Investing in Financial sector with Stocks | |
|
The following table helps investors and traders sort through current performance and trends (as measured by Smart Investing & Trading Score) of various
stocks in the Financial sector. Quick View: Move mouse or cursor over stock symbol (ticker) to view short-term Technical chart and over stock name to view long term chart. Click on  to add stock symbol to your watchlist and to add stock symbol to your watchlist and  to view watchlist. Click on any ticker or stock name for detailed market intelligence report for that stock. to view watchlist. Click on any ticker or stock name for detailed market intelligence report for that stock. |
12Stocks.com Performance of Stocks in Financial Sector
| Ticker | Stock Name | Watchlist | Category | Recent Price | Smart Investing & Trading Score | Change % | YTD Change% |
| FIHL | Fidelis Insurance |   | Insurance - | 15.15 | 32 | 1.88% | -15.86% |
| BRT | BRT Apartments | | Mortgage | 14.94 | 28 | 2.89% | -15.97% |
| OLP | One Liberty | | REIT - | 22.45 | 25 | 1.54% | -16.16% |
| OWL | Blue Owl | | Asset Mgmt | 19.35 | 43 | 2.71% | -16.19% |
| AVB | AvalonBay Communities | | REIT | 182.72 | 0 | -0.93% | -16.25% |
| GOOD | Gladstone Commercial | | REIT - | 13.24 | 25 | 1.77% | -16.30% |
| MAC | Macerich | | REIT - Retail | 16.52 | 48 | 2.35% | -16.30% |
| SLG | SL Green | | REIT - Retail | 56.09 | 10 | 0.59% | -16.39% |
| FRT | Federal Realty | | REIT - Retail | 91.54 | 10 | 1.03% | -16.48% |
| RGA | Reinsurance | | Life Insurance | 177.10 | 7 | -0.13% | -16.73% |
| AUB | Atlantic Union | | Regional Banks | 31.23 | 36 | -0.22% | -16.81% |
| EQIX | Equinix . | | REIT - | 778.39 | 18 | 0.86% | -17.02% |
| CHCT | Community Healthcare | | REIT | 15.47 | 27 | 0.85% | -17.41% |
| RMR | RMR | | Real Estatet | 16.13 | 53 | 2.41% | -17.52% |
| PLYM | Plymouth Industrial | | REIT - Industrial | 14.45 | 20 | 0.42% | -17.65% |
| NRDS | NerdWallet | | Credit Services | 10.94 | 95 | 3.80% | -17.74% |
| MMI | Marcus & Millichap | | Real Estatet | 31.22 | 81 | 1.73% | -17.81% |
| FFWM | First Foundation | | Regional Banks | 5.10 | 54 | 6.69% | -17.87% |
| HOPE | Hope Bancorp | | Regional Banks | 9.94 | 17 | 2.37% | -18.15% |
| RLI | RLI | | Insurance | 66.80 | 42 | 1.38% | -18.79% |
| DEI | Douglas Emmett | | REIT - | 14.82 | 26 | -0.60% | -19.20% |
| NODK | NI | | Insurance | 12.66 | 20 | 1.20% | -19.36% |
| CNS | Cohen & Steers | | Asset Mgmt | 73.84 | 50 | 2.26% | -19.46% |
| ARE | Alexandria Real | | REIT - Office | 77.12 | 58 | 1.46% | -19.84% |
| IIPR | Innovative Industrial | | REIT - Industrial | 51.65 | 20 | 0.55% | -20.11% |
| For chart view version of above stock list: Chart View ➞ 0 - 25 , 25 - 50 , 50 - 75 , 75 - 100 , 100 - 125 , 125 - 150 , 150 - 175 , 175 - 200 , 200 - 225 , 225 - 250 , 250 - 275 , 275 - 300 , 300 - 325 , 325 - 350 , 350 - 375 , 375 - 400 , 400 - 425 , 425 - 450 , 450 - 475 , 475 - 500 , 500 - 525 , 525 - 550 , 550 - 575 | ||
 | Click To Change The Sort Order: By Market Cap or Company Size Performance: Year-to-date, Week and Day |  |
|
Get the most comprehensive stock market coverage daily at 12Stocks.com ➞ Best Stocks Today ➞ Best Stocks Weekly ➞ Best Stocks Year-to-Date ➞ Best Stocks Trends ➞  Best Stocks Today 12Stocks.com Best Nasdaq Stocks ➞ Best S&P 500 Stocks ➞ Best Tech Stocks ➞ Best Biotech Stocks ➞ |
| Detailed Overview of Financial Stocks |
| Financial Technical Overview, Leaders & Laggards, Top Financial ETF Funds & Detailed Financial Stocks List, Charts, Trends & More |
| Financial Sector: Technical Analysis, Trends & YTD Performance | |
| Financial sector is composed of stocks
from banks, brokers, insurance, REITs
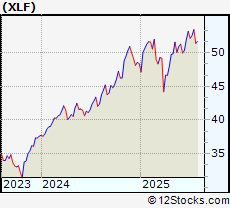
and services subsectors. Financial sector, as represented by XLF, an exchange-traded fund [ETF] that holds basket of Financial stocks (e.g, Bank of America, Goldman Sachs) is up by 7.8% and is currently outperforming the overall market by 0.27% year-to-date. Below is a quick view of Technical charts and trends: |
|
 XLF Weekly Chart |
|
| Long Term Trend: Good | |
| Medium Term Trend: Not Good | |
 XLF Daily Chart |
|
| Short Term Trend: Not Good | |
| Overall Trend Score: 33 | |
| YTD Performance: 7.8% | |
| **Trend Scores & Views Are Only For Educational Purposes And Not For Investing | |
| 12Stocks.com: Top Performing Financial Sector Stocks | ||||||||||||||||||||||||||||||||||||||||||||||||
 The top performing Financial sector stocks year to date are
Now, more recently, over last week, the top performing Financial sector stocks on the move are


|
||||||||||||||||||||||||||||||||||||||||||||||||
| 12Stocks.com: Investing in Financial Sector using Exchange Traded Funds | |
|
The following table shows list of key exchange traded funds (ETF) that
help investors track Financial Index. For detailed view, check out our ETF Funds section of our website. Quick View: Move mouse or cursor over ETF symbol (ticker) to view short-term Technical chart and over ETF name to view long term chart. Click on ticker or stock name for detailed view. Click on to add stock symbol to your watchlist and to view watchlist. |
12Stocks.com List of ETFs that track Financial Index
| Ticker | ETF Name | Watchlist | Recent Price | Smart Investing & Trading Score | Change % | Week % | Year-to-date % |
| XLF | Financial | | 51.91 | 33 | 0.99 | 0.99 | 7.8% |
| IAI | Broker-Dealers & Secs | | 174.97 | 63 | 2.34 | 2.34 | 21.82% |
| KBE | Bank | | 55.98 | 43 | 1.3 | 1.3 | 1.64% |
| FAS | Financial Bull 3X | | 161.82 | 33 | 2.91 | 2.91 | 7.48% |
| FAZ | Financial Bear 3X | | 4.54 | 62 | -2.78 | -2.78 | -27.4% |
| UYG | Financials | | 92.87 | 26 | 1.72 | 1.72 | 9% |
| KIE | Insurance | | 56.42 | 25 | 1.27 | 1.27 | 0.32% |
| 12Stocks.com: Charts, Trends, Fundamental Data and Performances of Financial Stocks | |
|
We now take in-depth look at all Financial stocks including charts, multi-period performances and overall trends (as measured by Smart Investing & Trading Score). One can sort Financial stocks (click link to choose) by Daily, Weekly and by Year-to-Date performances. Also, one can sort by size of the company or by market capitalization. |
| Select Your Default Chart Type: | |||||
| |||||
| Click on stock symbol or name for detailed view. Click on to add stock symbol to your watchlist and to view watchlist. Quick View: Move mouse or cursor over "Daily" to quickly view daily Technical stock chart and over "Weekly" to view weekly Technical stock chart. | |||||

 | FIHL Fidelis Insurance Holdings Limited |
| Sector: Financials | |
| SubSector: Insurance - Diversified | |
| MarketCap: 1590 Millions | |
| Recent Price: 15.15 Smart Investing & Trading Score: 32 | |
| Day Percent Change: 1.88% Day Change: 0.28 | |
| Week Change: 1.88% Year-to-date Change: -15.9% | |
| FIHL Links: Profile News Message Board | |
| Charts:- Daily , Weekly | |
| Add FIHL to Watchlist: View: Get Complete FIHL Trend Analysis ➞ | |
 | BRT BRT Apartments Corp. |
| Sector: Financials | |
| SubSector: Mortgage Investment | |
| MarketCap: 163.239 Millions | |
| Recent Price: 14.94 Smart Investing & Trading Score: 28 | |
| Day Percent Change: 2.89% Day Change: 0.42 | |
| Week Change: 2.89% Year-to-date Change: -16.0% | |
| BRT Links: Profile News Message Board | |
| Charts:- Daily , Weekly | |
| Add BRT to Watchlist: View: Get Complete BRT Trend Analysis ➞ | |
 | OLP One Liberty Properties, Inc. |
| Sector: Financials | |
| SubSector: REIT - Diversified | |
| MarketCap: 378.353 Millions | |
| Recent Price: 22.45 Smart Investing & Trading Score: 25 | |
| Day Percent Change: 1.54% Day Change: 0.34 | |
| Week Change: 1.54% Year-to-date Change: -16.2% | |
| OLP Links: Profile News Message Board | |
| Charts:- Daily , Weekly | |
| Add OLP to Watchlist: View: Get Complete OLP Trend Analysis ➞ | |
 | OWL Blue Owl Capital Inc. |
| Sector: Financials | |
| SubSector: Asset Management | |
| MarketCap: 16240 Millions | |
| Recent Price: 19.35 Smart Investing & Trading Score: 43 | |
| Day Percent Change: 2.71% Day Change: 0.51 | |
| Week Change: 2.71% Year-to-date Change: -16.2% | |
| OWL Links: Profile News Message Board | |
| Charts:- Daily , Weekly | |
| Add OWL to Watchlist: View: Get Complete OWL Trend Analysis ➞ | |
 | AVB AvalonBay Communities, Inc. |
| Sector: Financials | |
| SubSector: REIT - Residential | |
| MarketCap: 19921.9 Millions | |
| Recent Price: 182.72 Smart Investing & Trading Score: 0 | |
| Day Percent Change: -0.93% Day Change: -1.72 | |
| Week Change: -0.93% Year-to-date Change: -16.3% | |
| AVB Links: Profile News Message Board | |
| Charts:- Daily , Weekly | |
| Add AVB to Watchlist: View: Get Complete AVB Trend Analysis ➞ | |
 | GOOD Gladstone Commercial Corporation |
| Sector: Financials | |
| SubSector: REIT - Diversified | |
| MarketCap: 425.253 Millions | |
| Recent Price: 13.24 Smart Investing & Trading Score: 25 | |
| Day Percent Change: 1.77% Day Change: 0.23 | |
| Week Change: 1.77% Year-to-date Change: -16.3% | |
| GOOD Links: Profile News Message Board | |
| Charts:- Daily , Weekly | |
| Add GOOD to Watchlist: View: Get Complete GOOD Trend Analysis ➞ | |
 | MAC The Macerich Company |
| Sector: Financials | |
| SubSector: REIT - Retail | |
| MarketCap: 1172.54 Millions | |
| Recent Price: 16.52 Smart Investing & Trading Score: 48 | |
| Day Percent Change: 2.35% Day Change: 0.38 | |
| Week Change: 2.35% Year-to-date Change: -16.3% | |
| MAC Links: Profile News Message Board | |
| Charts:- Daily , Weekly | |
| Add MAC to Watchlist: View: Get Complete MAC Trend Analysis ➞ | |
 | SLG SL Green Realty Corp. |
| Sector: Financials | |
| SubSector: REIT - Retail | |
| MarketCap: 4048.14 Millions | |
| Recent Price: 56.09 Smart Investing & Trading Score: 10 | |
| Day Percent Change: 0.59% Day Change: 0.33 | |
| Week Change: 0.59% Year-to-date Change: -16.4% | |
| SLG Links: Profile News Message Board | |
| Charts:- Daily , Weekly | |
| Add SLG to Watchlist: View: Get Complete SLG Trend Analysis ➞ | |
 | FRT Federal Realty Investment Trust |
| Sector: Financials | |
| SubSector: REIT - Retail | |
| MarketCap: 5878.64 Millions | |
| Recent Price: 91.54 Smart Investing & Trading Score: 10 | |
| Day Percent Change: 1.03% Day Change: 0.93 | |
| Week Change: 1.03% Year-to-date Change: -16.5% | |
| FRT Links: Profile News Message Board | |
| Charts:- Daily , Weekly | |
| Add FRT to Watchlist: View: Get Complete FRT Trend Analysis ➞ | |
 | RGA Reinsurance Group of America, Incorporated |
| Sector: Financials | |
| SubSector: Life Insurance | |
| MarketCap: 4423.36 Millions | |
| Recent Price: 177.10 Smart Investing & Trading Score: 7 | |
| Day Percent Change: -0.13% Day Change: -0.23 | |
| Week Change: -0.13% Year-to-date Change: -16.7% | |
| RGA Links: Profile News Message Board | |
| Charts:- Daily , Weekly | |
| Add RGA to Watchlist: View: Get Complete RGA Trend Analysis ➞ | |
 | AUB Atlantic Union Bankshares Corporation |
| Sector: Financials | |
| SubSector: Regional - Mid-Atlantic Banks | |
| MarketCap: 1728.79 Millions | |
| Recent Price: 31.23 Smart Investing & Trading Score: 36 | |
| Day Percent Change: -0.22% Day Change: -0.07 | |
| Week Change: -0.22% Year-to-date Change: -16.8% | |
| AUB Links: Profile News Message Board | |
| Charts:- Daily , Weekly | |
| Add AUB to Watchlist: View: Get Complete AUB Trend Analysis ➞ | |
 | EQIX Equinix, Inc. (REIT) |
| Sector: Financials | |
| SubSector: REIT - Diversified | |
| MarketCap: 45855.3 Millions | |
| Recent Price: 778.39 Smart Investing & Trading Score: 18 | |
| Day Percent Change: 0.86% Day Change: 6.64 | |
| Week Change: 0.86% Year-to-date Change: -17.0% | |
| EQIX Links: Profile News Message Board | |
| Charts:- Daily , Weekly | |
| Add EQIX to Watchlist: View: Get Complete EQIX Trend Analysis ➞ | |
 | CHCT Community Healthcare Trust Incorporated |
| Sector: Financials | |
| SubSector: REIT - Healthcare Facilities | |
| MarketCap: 698.614 Millions | |
| Recent Price: 15.47 Smart Investing & Trading Score: 27 | |
| Day Percent Change: 0.85% Day Change: 0.13 | |
| Week Change: 0.85% Year-to-date Change: -17.4% | |
| CHCT Links: Profile News Message Board | |
| Charts:- Daily , Weekly | |
| Add CHCT to Watchlist: View: Get Complete CHCT Trend Analysis ➞ | |
 | RMR The RMR Group Inc. |
| Sector: Financials | |
| SubSector: Real Estate Development | |
| MarketCap: 797.419 Millions | |
| Recent Price: 16.13 Smart Investing & Trading Score: 53 | |
| Day Percent Change: 2.41% Day Change: 0.38 | |
| Week Change: 2.41% Year-to-date Change: -17.5% | |
| RMR Links: Profile News Message Board | |
| Charts:- Daily , Weekly | |
| Add RMR to Watchlist: View: Get Complete RMR Trend Analysis ➞ | |
 | PLYM Plymouth Industrial REIT, Inc. |
| Sector: Financials | |
| SubSector: REIT - Industrial | |
| MarketCap: 153.449 Millions | |
| Recent Price: 14.45 Smart Investing & Trading Score: 20 | |
| Day Percent Change: 0.42% Day Change: 0.06 | |
| Week Change: 0.42% Year-to-date Change: -17.7% | |
| PLYM Links: Profile News Message Board | |
| Charts:- Daily , Weekly | |
| Add PLYM to Watchlist: View: Get Complete PLYM Trend Analysis ➞ | |
 | NRDS NerdWallet, Inc. |
| Sector: Financials | |
| SubSector: Credit Services | |
| MarketCap: 759 Millions | |
| Recent Price: 10.94 Smart Investing & Trading Score: 95 | |
| Day Percent Change: 3.8% Day Change: 0.4 | |
| Week Change: 3.8% Year-to-date Change: -17.7% | |
| NRDS Links: Profile News Message Board | |
| Charts:- Daily , Weekly | |
| Add NRDS to Watchlist: View: Get Complete NRDS Trend Analysis ➞ | |
 | MMI Marcus & Millichap, Inc. |
| Sector: Financials | |
| SubSector: Real Estate Development | |
| MarketCap: 1005.19 Millions | |
| Recent Price: 31.22 Smart Investing & Trading Score: 81 | |
| Day Percent Change: 1.73% Day Change: 0.53 | |
| Week Change: 1.73% Year-to-date Change: -17.8% | |
| MMI Links: Profile News Message Board | |
| Charts:- Daily , Weekly | |
| Add MMI to Watchlist: View: Get Complete MMI Trend Analysis ➞ | |
 | FFWM First Foundation Inc. |
| Sector: Financials | |
| SubSector: Regional - Midwest Banks | |
| MarketCap: 457.17 Millions | |
| Recent Price: 5.10 Smart Investing & Trading Score: 54 | |
| Day Percent Change: 6.69% Day Change: 0.32 | |
| Week Change: 6.69% Year-to-date Change: -17.9% | |
| FFWM Links: Profile News Message Board | |
| Charts:- Daily , Weekly | |
| Add FFWM to Watchlist: View: Get Complete FFWM Trend Analysis ➞ | |
 | HOPE Hope Bancorp, Inc. |
| Sector: Financials | |
| SubSector: Regional - Pacific Banks | |
| MarketCap: 1099.29 Millions | |
| Recent Price: 9.94 Smart Investing & Trading Score: 17 | |
| Day Percent Change: 2.37% Day Change: 0.23 | |
| Week Change: 2.37% Year-to-date Change: -18.2% | |
| HOPE Links: Profile News Message Board | |
| Charts:- Daily , Weekly | |
| Add HOPE to Watchlist: View: Get Complete HOPE Trend Analysis ➞ | |
 | RLI RLI Corp. |
| Sector: Financials | |
| SubSector: Property & Casualty Insurance | |
| MarketCap: 3534.92 Millions | |
| Recent Price: 66.80 Smart Investing & Trading Score: 42 | |
| Day Percent Change: 1.38% Day Change: 0.91 | |
| Week Change: 1.38% Year-to-date Change: -18.8% | |
| RLI Links: Profile News Message Board | |
| Charts:- Daily , Weekly | |
| Add RLI to Watchlist: View: Get Complete RLI Trend Analysis ➞ | |
 | DEI Douglas Emmett, Inc. |
| Sector: Financials | |
| SubSector: REIT - Diversified | |
| MarketCap: 4917.83 Millions | |
| Recent Price: 14.82 Smart Investing & Trading Score: 26 | |
| Day Percent Change: -0.6% Day Change: -0.09 | |
| Week Change: -0.6% Year-to-date Change: -19.2% | |
| DEI Links: Profile News Message Board | |
| Charts:- Daily , Weekly | |
| Add DEI to Watchlist: View: Get Complete DEI Trend Analysis ➞ | |
 | NODK NI Holdings, Inc. |
| Sector: Financials | |
| SubSector: Property & Casualty Insurance | |
| MarketCap: 238.112 Millions | |
| Recent Price: 12.66 Smart Investing & Trading Score: 20 | |
| Day Percent Change: 1.2% Day Change: 0.15 | |
| Week Change: 1.2% Year-to-date Change: -19.4% | |
| NODK Links: Profile News Message Board | |
| Charts:- Daily , Weekly | |
| Add NODK to Watchlist: View: Get Complete NODK Trend Analysis ➞ | |
 | CNS Cohen & Steers, Inc. |
| Sector: Financials | |
| SubSector: Asset Management | |
| MarketCap: 2082.43 Millions | |
| Recent Price: 73.84 Smart Investing & Trading Score: 50 | |
| Day Percent Change: 2.26% Day Change: 1.63 | |
| Week Change: 2.26% Year-to-date Change: -19.5% | |
| CNS Links: Profile News Message Board | |
| Charts:- Daily , Weekly | |
| Add CNS to Watchlist: View: Get Complete CNS Trend Analysis ➞ | |
 | ARE Alexandria Real Estate Equities, Inc. |
| Sector: Financials | |
| SubSector: REIT - Office | |
| MarketCap: 16793.6 Millions | |
| Recent Price: 77.12 Smart Investing & Trading Score: 58 | |
| Day Percent Change: 1.46% Day Change: 1.11 | |
| Week Change: 1.46% Year-to-date Change: -19.8% | |
| ARE Links: Profile News Message Board | |
| Charts:- Daily , Weekly | |
| Add ARE to Watchlist: View: Get Complete ARE Trend Analysis ➞ | |
 | IIPR Innovative Industrial Properties, Inc. |
| Sector: Financials | |
| SubSector: REIT - Industrial | |
| MarketCap: 1193.29 Millions | |
| Recent Price: 51.65 Smart Investing & Trading Score: 20 | |
| Day Percent Change: 0.55% Day Change: 0.28 | |
| Week Change: 0.55% Year-to-date Change: -20.1% | |
| IIPR Links: Profile News Message Board | |
| Charts:- Daily , Weekly | |
| Add IIPR to Watchlist: View: Get Complete IIPR Trend Analysis ➞ | |
| For tabular summary view of above stock list: Summary View ➞ 0 - 25 , 25 - 50 , 50 - 75 , 75 - 100 , 100 - 125 , 125 - 150 , 150 - 175 , 175 - 200 , 200 - 225 , 225 - 250 , 250 - 275 , 275 - 300 , 300 - 325 , 325 - 350 , 350 - 375 , 375 - 400 , 400 - 425 , 425 - 450 , 450 - 475 , 475 - 500 , 500 - 525 , 525 - 550 , 550 - 575 | ||
| Click To Change The Sort Order: By Market Cap or Company Size Performance: Year-to-date, Week and Day | |
| Select Chart Type: | ||
|
Best Stocks Today 12Stocks.com |
© 2025 12Stocks.com Terms & Conditions Privacy Contact Us
All Information Provided Only For Education And Not To Be Used For Investing or Trading. See Terms & Conditions


One More Thing ... Get Best Stocks Delivered Daily!
Never Ever Miss A Move With Our Top Ten Stocks Lists
Find Best Stocks In Any Market - Bull or Bear Market
Take A Peek At Our Top Ten Stocks Lists: Daily, Weekly, Year-to-Date & Top Trends
Find Best Stocks In Any Market - Bull or Bear Market
Take A Peek At Our Top Ten Stocks Lists: Daily, Weekly, Year-to-Date & Top Trends
Financial Stocks With Best Up Trends [0-bearish to 100-bullish]: Uniti [100], LendingTree [100], Mercury General[100], Perella Weinberg[100], Broadstone Net[100], LendingClub [100], TPG RE[100], CareTrust REIT[100], Stewart Information[100], Healthcare Realty[100], VICI Properties[100]
Best Financial Stocks Year-to-Date:
ESSA Bancorp[3207.77%], Easterly Government[108.45%], Mr. Cooper[86.58%], Heritage Insurance[75.29%], Root [65.29%], Industrial Logistics[64.89%], Rocket [58.42%], Diversified Healthcare[49.61%], ProAssurance [49.59%], Uniti [47.09%], SoFi Technologies[41.62%] Best Financial Stocks This Week:
Uniti [64.77%], Industrial Logistics[11.36%], LendingTree [7.32%], eXp World[7.27%], EverQuote [6.89%], Camping World[6.84%], First Foundation[6.69%], Diamond Hill[5.46%], Mercury General[5.36%], Cipher Mining[5.27%], AlTi Global[5.13%] Best Financial Stocks Daily:
Uniti [64.77%], Industrial Logistics[11.36%], LendingTree [7.32%], eXp World[7.27%], EverQuote [6.89%], Camping World[6.84%], First Foundation[6.69%], Diamond Hill[5.46%], Mercury General[5.36%], Cipher Mining[5.27%], AlTi Global[5.13%]