
 Login Sign Up


| |||||
 |  | ||||

| 12Stocks.com Market Intelligence |
Best Financial Stocks
| In a hurry? Financial Stocks Lists: Performance Trends Table, Stock Charts
Sort Financial stocks: Daily, Weekly, Year-to-Date, Market Cap & Trends. Filter Financial stocks list by size:All Financial Large Mid-Range Small & MicroCap |
| 12Stocks.com Financial Stocks Performances & Trends Daily | |||||||||
|
|  The overall Smart Investing & Trading Score is 33 (0-bearish to 100-bullish) which puts Financial sector in short term bearish to neutral trend. The Smart Investing & Trading Score from previous trading session is 26 and hence an improvement of trend.
| ||||||||
Here are the Smart Investing & Trading Scores of the most requested Financial stocks at 12Stocks.com (click stock name for detailed review):
|


| 12Stocks.com: Investing in Financial sector with Stocks | |
|
The following table helps investors and traders sort through current performance and trends (as measured by Smart Investing & Trading Score) of various
stocks in the Financial sector. Quick View: Move mouse or cursor over stock symbol (ticker) to view short-term Technical chart and over stock name to view long term chart. Click on  to add stock symbol to your watchlist and to add stock symbol to your watchlist and  to view watchlist. Click on any ticker or stock name for detailed market intelligence report for that stock. to view watchlist. Click on any ticker or stock name for detailed market intelligence report for that stock. |
12Stocks.com Performance of Stocks in Financial Sector
| Ticker | Stock Name | Watchlist | Category | Recent Price | Smart Investing & Trading Score | Change % | YTD Change% |
| WSR | Whitestone REIT |   | REIT - Retail | 12.12 | 20 | 2.71% | -13.35% |
| NBTB | NBT Bancorp | | Regional Banks | 40.99 | 10 | 1.06% | -13.56% |
| CTO | Consolidated-Tomoka Land | | Real Estatet | 16.66 | 32 | 1.34% | -13.74% |
| APO | Apollo Global | | Investments | 142.02 | 43 | 2.70% | -13.77% |
| TPL | Texas Pacific | | Real Estatet | 952.04 | 22 | 1.84% | -13.82% |
| DRH | DiamondRock Hospitality | | REIT | 7.70 | 53 | 1.72% | -13.84% |
| SAFT | Safety Insurance | | Insurance | 70.04 | 28 | 1.07% | -13.98% |
| FRPH | FRP | | Property Mgmt | 26.32 | 20 | 1.43% | -14.07% |
| WTBA | West Ban | | Regional - Southwest Banks | 18.35 | 25 | 2.17% | -14.28% |
| CBU | Community Bank | | Regional Banks | 52.40 | 17 | 1.83% | -14.34% |
| LAND | Gladstone Land | | REIT - | 9.13 | 20 | 0.22% | -14.36% |
| FFIC | Flushing | | S&L | 12.00 | 55 | 1.69% | -14.52% |
| NBHC | National Bank | | Regional Banks | 36.50 | 36 | 1.22% | -14.64% |
| BFS | Saul Centers | | REIT - Retail | 32.00 | 17 | 0.85% | -14.70% |
| MBI | MBIA | | Insurance | 5.51 | 93 | -1.61% | -14.71% |
| ABR | Arbor Realty | | Mortgage | 11.39 | 56 | 1.70% | -14.78% |
| DOC | Physicians Realty | | REIT | 16.90 | 10 | 0.78% | -14.86% |
| VEL | Velocity | | Mortgage Finance | 16.64 | 23 | 1.77% | -14.93% |
| SIGI | Selective Insurance | | Insurance | 79.09 | 28 | 2.09% | -15.04% |
| AMTB | Amerant Bancorp | | Regional Banks | 18.94 | 36 | 1.77% | -15.16% |
| IRT | Independence Realty | | REIT | 16.70 | 10 | -0.36% | -15.18% |
| PDM | Piedmont Office | | REIT - Office | 7.62 | 95 | 4.10% | -15.26% |
| GCBC | Greene County | | S&L | 23.40 | 46 | 1.43% | -15.30% |
| FMAO | Farmers & Merchants Bancorp | | Regional Banks | 24.64 | 51 | 3.57% | -15.49% |
| KRNY | Kearny | | S&L | 5.89 | 10 | 0.68% | -15.58% |
| For chart view version of above stock list: Chart View ➞ 0 - 25 , 25 - 50 , 50 - 75 , 75 - 100 , 100 - 125 , 125 - 150 , 150 - 175 , 175 - 200 , 200 - 225 , 225 - 250 , 250 - 275 , 275 - 300 , 300 - 325 , 325 - 350 , 350 - 375 , 375 - 400 , 400 - 425 , 425 - 450 , 450 - 475 , 475 - 500 , 500 - 525 , 525 - 550 , 550 - 575 | ||
 | Click To Change The Sort Order: By Market Cap or Company Size Performance: Year-to-date, Week and Day |  |
|
Get the most comprehensive stock market coverage daily at 12Stocks.com ➞ Best Stocks Today ➞ Best Stocks Weekly ➞ Best Stocks Year-to-Date ➞ Best Stocks Trends ➞  Best Stocks Today 12Stocks.com Best Nasdaq Stocks ➞ Best S&P 500 Stocks ➞ Best Tech Stocks ➞ Best Biotech Stocks ➞ |
| Detailed Overview of Financial Stocks |
| Financial Technical Overview, Leaders & Laggards, Top Financial ETF Funds & Detailed Financial Stocks List, Charts, Trends & More |
| Financial Sector: Technical Analysis, Trends & YTD Performance | |
| Financial sector is composed of stocks
from banks, brokers, insurance, REITs
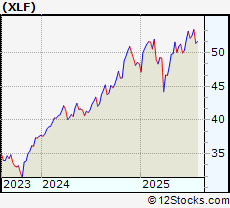
and services subsectors. Financial sector, as represented by XLF, an exchange-traded fund [ETF] that holds basket of Financial stocks (e.g, Bank of America, Goldman Sachs) is up by 7.8% and is currently outperforming the overall market by 0.27% year-to-date. Below is a quick view of Technical charts and trends: |
|
 XLF Weekly Chart |
|
| Long Term Trend: Good | |
| Medium Term Trend: Not Good | |
 XLF Daily Chart |
|
| Short Term Trend: Not Good | |
| Overall Trend Score: 33 | |
| YTD Performance: 7.8% | |
| **Trend Scores & Views Are Only For Educational Purposes And Not For Investing | |
| 12Stocks.com: Top Performing Financial Sector Stocks | ||||||||||||||||||||||||||||||||||||||||||||||||
 The top performing Financial sector stocks year to date are
Now, more recently, over last week, the top performing Financial sector stocks on the move are


|
||||||||||||||||||||||||||||||||||||||||||||||||
| 12Stocks.com: Investing in Financial Sector using Exchange Traded Funds | |
|
The following table shows list of key exchange traded funds (ETF) that
help investors track Financial Index. For detailed view, check out our ETF Funds section of our website. Quick View: Move mouse or cursor over ETF symbol (ticker) to view short-term Technical chart and over ETF name to view long term chart. Click on ticker or stock name for detailed view. Click on to add stock symbol to your watchlist and to view watchlist. |
12Stocks.com List of ETFs that track Financial Index
| Ticker | ETF Name | Watchlist | Recent Price | Smart Investing & Trading Score | Change % | Week % | Year-to-date % |
| XLF | Financial | | 51.91 | 33 | 0.99 | 0.99 | 7.8% |
| IAI | Broker-Dealers & Secs | | 174.97 | 63 | 2.34 | 2.34 | 21.82% |
| KBE | Bank | | 55.98 | 43 | 1.3 | 1.3 | 1.64% |
| FAS | Financial Bull 3X | | 161.82 | 33 | 2.91 | 2.91 | 7.48% |
| FAZ | Financial Bear 3X | | 4.54 | 62 | -2.78 | -2.78 | -27.4% |
| UYG | Financials | | 92.87 | 26 | 1.72 | 1.72 | 9% |
| KIE | Insurance | | 56.42 | 25 | 1.27 | 1.27 | 0.32% |
| 12Stocks.com: Charts, Trends, Fundamental Data and Performances of Financial Stocks | |
|
We now take in-depth look at all Financial stocks including charts, multi-period performances and overall trends (as measured by Smart Investing & Trading Score). One can sort Financial stocks (click link to choose) by Daily, Weekly and by Year-to-Date performances. Also, one can sort by size of the company or by market capitalization. |
| Select Your Default Chart Type: | |||||
| |||||
| Click on stock symbol or name for detailed view. Click on to add stock symbol to your watchlist and to view watchlist. Quick View: Move mouse or cursor over "Daily" to quickly view daily Technical stock chart and over "Weekly" to view weekly Technical stock chart. | |||||

 | WSR Whitestone REIT |
| Sector: Financials | |
| SubSector: REIT - Retail | |
| MarketCap: 316.114 Millions | |
| Recent Price: 12.12 Smart Investing & Trading Score: 20 | |
| Day Percent Change: 2.71% Day Change: 0.32 | |
| Week Change: 2.71% Year-to-date Change: -13.4% | |
| WSR Links: Profile News Message Board | |
| Charts:- Daily , Weekly | |
| Add WSR to Watchlist: View: Get Complete WSR Trend Analysis ➞ | |
 | NBTB NBT Bancorp Inc. |
| Sector: Financials | |
| SubSector: Regional - Northeast Banks | |
| MarketCap: 1451.89 Millions | |
| Recent Price: 40.99 Smart Investing & Trading Score: 10 | |
| Day Percent Change: 1.06% Day Change: 0.43 | |
| Week Change: 1.06% Year-to-date Change: -13.6% | |
| NBTB Links: Profile News Message Board | |
| Charts:- Daily , Weekly | |
| Add NBTB to Watchlist: View: Get Complete NBTB Trend Analysis ➞ | |
 | CTO Consolidated-Tomoka Land Co. |
| Sector: Financials | |
| SubSector: Real Estate Development | |
| MarketCap: 205.119 Millions | |
| Recent Price: 16.66 Smart Investing & Trading Score: 32 | |
| Day Percent Change: 1.34% Day Change: 0.22 | |
| Week Change: 1.34% Year-to-date Change: -13.7% | |
| CTO Links: Profile News Message Board | |
| Charts:- Daily , Weekly | |
| Add CTO to Watchlist: View: Get Complete CTO Trend Analysis ➞ | |
 | APO Apollo Global Management, Inc. |
| Sector: Financials | |
| SubSector: Diversified Investments | |
| MarketCap: 12706 Millions | |
| Recent Price: 142.02 Smart Investing & Trading Score: 43 | |
| Day Percent Change: 2.7% Day Change: 3.73 | |
| Week Change: 2.7% Year-to-date Change: -13.8% | |
| APO Links: Profile News Message Board | |
| Charts:- Daily , Weekly | |
| Add APO to Watchlist: View: Get Complete APO Trend Analysis ➞ | |
 | TPL Texas Pacific Land Trust |
| Sector: Financials | |
| SubSector: Real Estate Development | |
| MarketCap: 3052.29 Millions | |
| Recent Price: 952.04 Smart Investing & Trading Score: 22 | |
| Day Percent Change: 1.84% Day Change: 17.24 | |
| Week Change: 1.84% Year-to-date Change: -13.8% | |
| TPL Links: Profile News Message Board | |
| Charts:- Daily , Weekly | |
| Add TPL to Watchlist: View: Get Complete TPL Trend Analysis ➞ | |
 | DRH DiamondRock Hospitality Company |
| Sector: Financials | |
| SubSector: REIT - Hotel/Motel | |
| MarketCap: 964 Millions | |
| Recent Price: 7.70 Smart Investing & Trading Score: 53 | |
| Day Percent Change: 1.72% Day Change: 0.13 | |
| Week Change: 1.72% Year-to-date Change: -13.8% | |
| DRH Links: Profile News Message Board | |
| Charts:- Daily , Weekly | |
| Add DRH to Watchlist: View: Get Complete DRH Trend Analysis ➞ | |
 | SAFT Safety Insurance Group, Inc. |
| Sector: Financials | |
| SubSector: Property & Casualty Insurance | |
| MarketCap: 1145.12 Millions | |
| Recent Price: 70.04 Smart Investing & Trading Score: 28 | |
| Day Percent Change: 1.07% Day Change: 0.74 | |
| Week Change: 1.07% Year-to-date Change: -14.0% | |
| SAFT Links: Profile News Message Board | |
| Charts:- Daily , Weekly | |
| Add SAFT to Watchlist: View: Get Complete SAFT Trend Analysis ➞ | |
 | FRPH FRP Holdings, Inc. |
| Sector: Financials | |
| SubSector: Property Management | |
| MarketCap: 374.442 Millions | |
| Recent Price: 26.32 Smart Investing & Trading Score: 20 | |
| Day Percent Change: 1.43% Day Change: 0.37 | |
| Week Change: 1.43% Year-to-date Change: -14.1% | |
| FRPH Links: Profile News Message Board | |
| Charts:- Daily , Weekly | |
| Add FRPH to Watchlist: View: Get Complete FRPH Trend Analysis ➞ | |
 | WTBA West Bancorporation, Inc. |
| Sector: Financials | |
| SubSector: Regional - Southwest Banks | |
| MarketCap: 272.965 Millions | |
| Recent Price: 18.35 Smart Investing & Trading Score: 25 | |
| Day Percent Change: 2.17% Day Change: 0.39 | |
| Week Change: 2.17% Year-to-date Change: -14.3% | |
| WTBA Links: Profile News Message Board | |
| Charts:- Daily , Weekly | |
| Add WTBA to Watchlist: View: Get Complete WTBA Trend Analysis ➞ | |
 | CBU Community Bank System, Inc. |
| Sector: Financials | |
| SubSector: Regional - Midwest Banks | |
| MarketCap: 2787.8 Millions | |
| Recent Price: 52.40 Smart Investing & Trading Score: 17 | |
| Day Percent Change: 1.83% Day Change: 0.94 | |
| Week Change: 1.83% Year-to-date Change: -14.3% | |
| CBU Links: Profile News Message Board | |
| Charts:- Daily , Weekly | |
| Add CBU to Watchlist: View: Get Complete CBU Trend Analysis ➞ | |
 | LAND Gladstone Land Corporation |
| Sector: Financials | |
| SubSector: REIT - Diversified | |
| MarketCap: 252.653 Millions | |
| Recent Price: 9.13 Smart Investing & Trading Score: 20 | |
| Day Percent Change: 0.22% Day Change: 0.02 | |
| Week Change: 0.22% Year-to-date Change: -14.4% | |
| LAND Links: Profile News Message Board | |
| Charts:- Daily , Weekly | |
| Add LAND to Watchlist: View: Get Complete LAND Trend Analysis ➞ | |
 | FFIC Flushing Financial Corporation |
| Sector: Financials | |
| SubSector: Savings & Loans | |
| MarketCap: 336.43 Millions | |
| Recent Price: 12.00 Smart Investing & Trading Score: 55 | |
| Day Percent Change: 1.69% Day Change: 0.2 | |
| Week Change: 1.69% Year-to-date Change: -14.5% | |
| FFIC Links: Profile News Message Board | |
| Charts:- Daily , Weekly | |
| Add FFIC to Watchlist: View: Get Complete FFIC Trend Analysis ➞ | |
 | NBHC National Bank Holdings Corporation |
| Sector: Financials | |
| SubSector: Regional - Midwest Banks | |
| MarketCap: 766.87 Millions | |
| Recent Price: 36.50 Smart Investing & Trading Score: 36 | |
| Day Percent Change: 1.22% Day Change: 0.44 | |
| Week Change: 1.22% Year-to-date Change: -14.6% | |
| NBHC Links: Profile News Message Board | |
| Charts:- Daily , Weekly | |
| Add NBHC to Watchlist: View: Get Complete NBHC Trend Analysis ➞ | |
 | BFS Saul Centers, Inc. |
| Sector: Financials | |
| SubSector: REIT - Retail | |
| MarketCap: 689.914 Millions | |
| Recent Price: 32.00 Smart Investing & Trading Score: 17 | |
| Day Percent Change: 0.85% Day Change: 0.27 | |
| Week Change: 0.85% Year-to-date Change: -14.7% | |
| BFS Links: Profile News Message Board | |
| Charts:- Daily , Weekly | |
| Add BFS to Watchlist: View: Get Complete BFS Trend Analysis ➞ | |
 | MBI MBIA Inc. |
| Sector: Financials | |
| SubSector: Property & Casualty Insurance | |
| MarketCap: 539.012 Millions | |
| Recent Price: 5.51 Smart Investing & Trading Score: 93 | |
| Day Percent Change: -1.61% Day Change: -0.09 | |
| Week Change: -1.61% Year-to-date Change: -14.7% | |
| MBI Links: Profile News Message Board | |
| Charts:- Daily , Weekly | |
| Add MBI to Watchlist: View: Get Complete MBI Trend Analysis ➞ | |
 | ABR Arbor Realty Trust, Inc. |
| Sector: Financials | |
| SubSector: Mortgage Investment | |
| MarketCap: 648.939 Millions | |
| Recent Price: 11.39 Smart Investing & Trading Score: 56 | |
| Day Percent Change: 1.7% Day Change: 0.19 | |
| Week Change: 1.7% Year-to-date Change: -14.8% | |
| ABR Links: Profile News Message Board | |
| Charts:- Daily , Weekly | |
| Add ABR to Watchlist: View: Get Complete ABR Trend Analysis ➞ | |
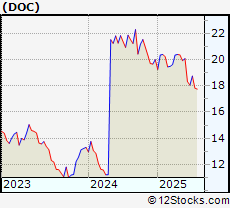 | DOC Physicians Realty Trust |
| Sector: Financials | |
| SubSector: REIT - Healthcare Facilities | |
| MarketCap: 2765.04 Millions | |
| Recent Price: 16.90 Smart Investing & Trading Score: 10 | |
| Day Percent Change: 0.78% Day Change: 0.13 | |
| Week Change: 0.78% Year-to-date Change: -14.9% | |
| DOC Links: Profile News Message Board | |
| Charts:- Daily , Weekly | |
| Add DOC to Watchlist: View: Get Complete DOC Trend Analysis ➞ | |
 | VEL Velocity Financial, Inc. |
| Sector: Financials | |
| SubSector: Mortgage Finance | |
| MarketCap: 12157 Millions | |
| Recent Price: 16.64 Smart Investing & Trading Score: 23 | |
| Day Percent Change: 1.77% Day Change: 0.29 | |
| Week Change: 1.77% Year-to-date Change: -14.9% | |
| VEL Links: Profile News Message Board | |
| Charts:- Daily , Weekly | |
| Add VEL to Watchlist: View: Get Complete VEL Trend Analysis ➞ | |
 | SIGI Selective Insurance Group, Inc. |
| Sector: Financials | |
| SubSector: Property & Casualty Insurance | |
| MarketCap: 3039.12 Millions | |
| Recent Price: 79.09 Smart Investing & Trading Score: 28 | |
| Day Percent Change: 2.09% Day Change: 1.62 | |
| Week Change: 2.09% Year-to-date Change: -15.0% | |
| SIGI Links: Profile News Message Board | |
| Charts:- Daily , Weekly | |
| Add SIGI to Watchlist: View: Get Complete SIGI Trend Analysis ➞ | |
 | AMTB Amerant Bancorp Inc. |
| Sector: Financials | |
| SubSector: Regional - Midwest Banks | |
| MarketCap: 653.87 Millions | |
| Recent Price: 18.94 Smart Investing & Trading Score: 36 | |
| Day Percent Change: 1.77% Day Change: 0.33 | |
| Week Change: 1.77% Year-to-date Change: -15.2% | |
| AMTB Links: Profile News Message Board | |
| Charts:- Daily , Weekly | |
| Add AMTB to Watchlist: View: Get Complete AMTB Trend Analysis ➞ | |
 | IRT Independence Realty Trust, Inc. |
| Sector: Financials | |
| SubSector: REIT - Residential | |
| MarketCap: 980.161 Millions | |
| Recent Price: 16.70 Smart Investing & Trading Score: 10 | |
| Day Percent Change: -0.36% Day Change: -0.06 | |
| Week Change: -0.36% Year-to-date Change: -15.2% | |
| IRT Links: Profile News Message Board | |
| Charts:- Daily , Weekly | |
| Add IRT to Watchlist: View: Get Complete IRT Trend Analysis ➞ | |
 | PDM Piedmont Office Realty Trust, Inc. |
| Sector: Financials | |
| SubSector: REIT - Office | |
| MarketCap: 2097.46 Millions | |
| Recent Price: 7.62 Smart Investing & Trading Score: 95 | |
| Day Percent Change: 4.1% Day Change: 0.3 | |
| Week Change: 4.1% Year-to-date Change: -15.3% | |
| PDM Links: Profile News Message Board | |
| Charts:- Daily , Weekly | |
| Add PDM to Watchlist: View: Get Complete PDM Trend Analysis ➞ | |
 | GCBC Greene County Bancorp, Inc. |
| Sector: Financials | |
| SubSector: Savings & Loans | |
| MarketCap: 314.83 Millions | |
| Recent Price: 23.40 Smart Investing & Trading Score: 46 | |
| Day Percent Change: 1.43% Day Change: 0.33 | |
| Week Change: 1.43% Year-to-date Change: -15.3% | |
| GCBC Links: Profile News Message Board | |
| Charts:- Daily , Weekly | |
| Add GCBC to Watchlist: View: Get Complete GCBC Trend Analysis ➞ | |
 | FMAO Farmers & Merchants Bancorp, Inc. |
| Sector: Financials | |
| SubSector: Regional - Midwest Banks | |
| MarketCap: 280.27 Millions | |
| Recent Price: 24.64 Smart Investing & Trading Score: 51 | |
| Day Percent Change: 3.57% Day Change: 0.85 | |
| Week Change: 3.57% Year-to-date Change: -15.5% | |
| FMAO Links: Profile News Message Board | |
| Charts:- Daily , Weekly | |
| Add FMAO to Watchlist: View: Get Complete FMAO Trend Analysis ➞ | |
 | KRNY Kearny Financial Corp. |
| Sector: Financials | |
| SubSector: Savings & Loans | |
| MarketCap: 781.73 Millions | |
| Recent Price: 5.89 Smart Investing & Trading Score: 10 | |
| Day Percent Change: 0.68% Day Change: 0.04 | |
| Week Change: 0.68% Year-to-date Change: -15.6% | |
| KRNY Links: Profile News Message Board | |
| Charts:- Daily , Weekly | |
| Add KRNY to Watchlist: View: Get Complete KRNY Trend Analysis ➞ | |
| For tabular summary view of above stock list: Summary View ➞ 0 - 25 , 25 - 50 , 50 - 75 , 75 - 100 , 100 - 125 , 125 - 150 , 150 - 175 , 175 - 200 , 200 - 225 , 225 - 250 , 250 - 275 , 275 - 300 , 300 - 325 , 325 - 350 , 350 - 375 , 375 - 400 , 400 - 425 , 425 - 450 , 450 - 475 , 475 - 500 , 500 - 525 , 525 - 550 , 550 - 575 | ||
| Click To Change The Sort Order: By Market Cap or Company Size Performance: Year-to-date, Week and Day | |
| Select Chart Type: | ||
|
Best Stocks Today 12Stocks.com |
© 2025 12Stocks.com Terms & Conditions Privacy Contact Us
All Information Provided Only For Education And Not To Be Used For Investing or Trading. See Terms & Conditions


One More Thing ... Get Best Stocks Delivered Daily!
Never Ever Miss A Move With Our Top Ten Stocks Lists
Find Best Stocks In Any Market - Bull or Bear Market
Take A Peek At Our Top Ten Stocks Lists: Daily, Weekly, Year-to-Date & Top Trends
Find Best Stocks In Any Market - Bull or Bear Market
Take A Peek At Our Top Ten Stocks Lists: Daily, Weekly, Year-to-Date & Top Trends
Financial Stocks With Best Up Trends [0-bearish to 100-bullish]: Uniti [100], LendingTree [100], Mercury General[100], Perella Weinberg[100], Broadstone Net[100], LendingClub [100], TPG RE[100], CareTrust REIT[100], Stewart Information[100], Healthcare Realty[100], VICI Properties[100]
Best Financial Stocks Year-to-Date:
ESSA Bancorp[3207.77%], Easterly Government[108.45%], Mr. Cooper[86.58%], Heritage Insurance[75.29%], Root [65.29%], Industrial Logistics[64.89%], Rocket [58.42%], Diversified Healthcare[49.61%], ProAssurance [49.59%], Uniti [47.09%], SoFi Technologies[41.62%] Best Financial Stocks This Week:
Uniti [64.77%], Industrial Logistics[11.36%], LendingTree [7.32%], eXp World[7.27%], EverQuote [6.89%], Camping World[6.84%], First Foundation[6.69%], Diamond Hill[5.46%], Mercury General[5.36%], Cipher Mining[5.27%], AlTi Global[5.13%] Best Financial Stocks Daily:
Uniti [64.77%], Industrial Logistics[11.36%], LendingTree [7.32%], eXp World[7.27%], EverQuote [6.89%], Camping World[6.84%], First Foundation[6.69%], Diamond Hill[5.46%], Mercury General[5.36%], Cipher Mining[5.27%], AlTi Global[5.13%]