
 Login Sign Up


| |||||
 |  | ||||

| 12Stocks.com Market Intelligence |
Best Financial Stocks
| In a hurry? Financial Stocks Lists: Performance Trends Table, Stock Charts
Sort Financial stocks: Daily, Weekly, Year-to-Date, Market Cap & Trends. Filter Financial stocks list by size:All Financial Large Mid-Range Small & MicroCap |
| 12Stocks.com Financial Stocks Performances & Trends Daily | |||||||||
|
|  The overall Smart Investing & Trading Score is 33 (0-bearish to 100-bullish) which puts Financial sector in short term bearish to neutral trend. The Smart Investing & Trading Score from previous trading session is 26 and hence an improvement of trend.
| ||||||||
Here are the Smart Investing & Trading Scores of the most requested Financial stocks at 12Stocks.com (click stock name for detailed review):
|


| 12Stocks.com: Investing in Financial sector with Stocks | |
|
The following table helps investors and traders sort through current performance and trends (as measured by Smart Investing & Trading Score) of various
stocks in the Financial sector. Quick View: Move mouse or cursor over stock symbol (ticker) to view short-term Technical chart and over stock name to view long term chart. Click on  to add stock symbol to your watchlist and to add stock symbol to your watchlist and  to view watchlist. Click on any ticker or stock name for detailed market intelligence report for that stock. to view watchlist. Click on any ticker or stock name for detailed market intelligence report for that stock. |
12Stocks.com Performance of Stocks in Financial Sector
| Ticker | Stock Name | Watchlist | Category | Recent Price | Smart Investing & Trading Score | Change % | Weekly Change% |
| TCBI | Texas Capital |   | Regional - Southwest Banks | 81.31 | 31 | 0.48% | 0.48% |
| AFL | Aflac | | Insurance | 98.56 | 18 | 0.48% | 0.48% |
| BANF | BancFirst | | Regional - Southwest Banks | 122.87 | 23 | 0.47% | 0.47% |
| PFG | Pripal | | Life Insurance | 75.88 | 0 | 0.46% | 0.46% |
| NTRS | Northern Trust | | Asset Mgmt | 127.65 | 46 | 0.46% | 0.46% |
| HCI | HCI | | Insurance | 139.49 | 28 | 0.45% | 0.45% |
| SAFE | Safehold | | REIT - | 14.15 | 25 | 0.43% | 0.43% |
| SYBT | Stock Yards | | Regional Banks | 73.90 | 30 | 0.43% | 0.43% |
| PLYM | Plymouth Industrial | | REIT - Industrial | 14.45 | 20 | 0.42% | 0.42% |
| TRST | TrustCo Bank | | Regional Banks | 33.19 | 48 | 0.42% | 0.42% |
| BAC | Bank of America | | Banks | 45.85 | 26 | 0.42% | 0.42% |
| PVBC | Provident Bancorp | | Banks | 12.19 | 43 | 0.41% | 0.41% |
| PB | Prosperity Bancshares | | Regional - Southwest Banks | 66.19 | 25 | 0.41% | 0.41% |
| DLR | Digital Realty | | REIT - Office | 172.91 | 26 | 0.41% | 0.41% |
| AMT | American Tower | | REIT - | 212.98 | 25 | 0.41% | 0.41% |
| CCNE | CNB | | Regional Banks | 22.57 | 26 | 0.40% | 0.40% |
| QCRH | QCR | | Regional - Southwest Banks | 70.29 | 36 | 0.40% | 0.40% |
| PEBO | Peoples Bancorp | | Regional Banks | 28.27 | 10 | 0.39% | 0.39% |
| LKFN | Lakeland | | Regional Banks | 61.84 | 36 | 0.39% | 0.39% |
| NAVI | Navient | | Credit Services | 12.71 | 35 | 0.39% | 0.39% |
| MLP | Maui Land | | Real Estatet | 16.47 | 68 | 0.37% | 0.37% |
| SKWD | Skyward Specialty | | Insurance - Property & Casualty | 49.57 | 25 | 0.36% | 0.36% |
| GSBC | Great Southern | | Regional - Southwest Banks | 56.17 | 23 | 0.32% | 0.32% |
| UNM | Unum | | Insurance | 69.95 | 0 | 0.32% | 0.32% |
| OZK | Bank OZK | | Regional Banks | 47.97 | 36 | 0.31% | 0.31% |
| For chart view version of above stock list: Chart View ➞ 0 - 25 , 25 - 50 , 50 - 75 , 75 - 100 , 100 - 125 , 125 - 150 , 150 - 175 , 175 - 200 , 200 - 225 , 225 - 250 , 250 - 275 , 275 - 300 , 300 - 325 , 325 - 350 , 350 - 375 , 375 - 400 , 400 - 425 , 425 - 450 , 450 - 475 , 475 - 500 , 500 - 525 , 525 - 550 , 550 - 575 | ||
 | Click To Change The Sort Order: By Market Cap or Company Size Performance: Year-to-date, Week and Day |  |
|
Get the most comprehensive stock market coverage daily at 12Stocks.com ➞ Best Stocks Today ➞ Best Stocks Weekly ➞ Best Stocks Year-to-Date ➞ Best Stocks Trends ➞  Best Stocks Today 12Stocks.com Best Nasdaq Stocks ➞ Best S&P 500 Stocks ➞ Best Tech Stocks ➞ Best Biotech Stocks ➞ |
| Detailed Overview of Financial Stocks |
| Financial Technical Overview, Leaders & Laggards, Top Financial ETF Funds & Detailed Financial Stocks List, Charts, Trends & More |
| Financial Sector: Technical Analysis, Trends & YTD Performance | |
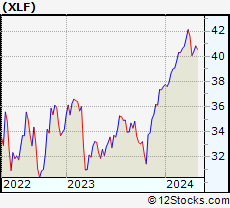
| Financial sector is composed of stocks
from banks, brokers, insurance, REITs
and services subsectors. Financial sector, as represented by XLF, an exchange-traded fund [ETF] that holds basket of Financial stocks (e.g, Bank of America, Goldman Sachs) is up by 7.8% and is currently outperforming the overall market by 0.27% year-to-date. Below is a quick view of Technical charts and trends: |
|
 XLF Weekly Chart |
|
| Long Term Trend: Good | |
| Medium Term Trend: Not Good | |
 XLF Daily Chart |
|
| Short Term Trend: Not Good | |
| Overall Trend Score: 33 | |
| YTD Performance: 7.8% | |
| **Trend Scores & Views Are Only For Educational Purposes And Not For Investing | |
| 12Stocks.com: Top Performing Financial Sector Stocks | ||||||||||||||||||||||||||||||||||||||||||||||||
 The top performing Financial sector stocks year to date are
Now, more recently, over last week, the top performing Financial sector stocks on the move are


|
||||||||||||||||||||||||||||||||||||||||||||||||
| 12Stocks.com: Investing in Financial Sector using Exchange Traded Funds | |
|
The following table shows list of key exchange traded funds (ETF) that
help investors track Financial Index. For detailed view, check out our ETF Funds section of our website. Quick View: Move mouse or cursor over ETF symbol (ticker) to view short-term Technical chart and over ETF name to view long term chart. Click on ticker or stock name for detailed view. Click on to add stock symbol to your watchlist and to view watchlist. |
12Stocks.com List of ETFs that track Financial Index
| Ticker | ETF Name | Watchlist | Recent Price | Smart Investing & Trading Score | Change % | Week % | Year-to-date % |
| XLF | Financial | | 51.91 | 33 | 0.99 | 0.99 | 7.8% |
| IAI | Broker-Dealers & Secs | | 174.97 | 63 | 2.34 | 2.34 | 21.82% |
| KBE | Bank | | 55.98 | 43 | 1.3 | 1.3 | 1.64% |
| FAS | Financial Bull 3X | | 161.82 | 33 | 2.91 | 2.91 | 7.48% |
| FAZ | Financial Bear 3X | | 4.54 | 62 | -2.78 | -2.78 | -27.4% |
| UYG | Financials | | 92.87 | 26 | 1.72 | 1.72 | 9% |
| KIE | Insurance | | 56.42 | 25 | 1.27 | 1.27 | 0.32% |
| 12Stocks.com: Charts, Trends, Fundamental Data and Performances of Financial Stocks | |
|
We now take in-depth look at all Financial stocks including charts, multi-period performances and overall trends (as measured by Smart Investing & Trading Score). One can sort Financial stocks (click link to choose) by Daily, Weekly and by Year-to-Date performances. Also, one can sort by size of the company or by market capitalization. |
| Select Your Default Chart Type: | |||||
| |||||
| Click on stock symbol or name for detailed view. Click on to add stock symbol to your watchlist and to view watchlist. Quick View: Move mouse or cursor over "Daily" to quickly view daily Technical stock chart and over "Weekly" to view weekly Technical stock chart. | |||||

 | TCBI Texas Capital Bancshares, Inc. |
| Sector: Financials | |
| SubSector: Regional - Southwest Banks | |
| MarketCap: 1202.75 Millions | |
| Recent Price: 81.31 Smart Investing & Trading Score: 31 | |
| Day Percent Change: 0.48% Day Change: 0.39 | |
| Week Change: 0.48% Year-to-date Change: 4.0% | |
| TCBI Links: Profile News Message Board | |
| Charts:- Daily , Weekly | |
| Add TCBI to Watchlist: View: Get Complete TCBI Trend Analysis ➞ | |
 | AFL Aflac Incorporated |
| Sector: Financials | |
| SubSector: Accident & Health Insurance | |
| MarketCap: 22706 Millions | |
| Recent Price: 98.56 Smart Investing & Trading Score: 18 | |
| Day Percent Change: 0.48% Day Change: 0.47 | |
| Week Change: 0.48% Year-to-date Change: -4.2% | |
| AFL Links: Profile News Message Board | |
| Charts:- Daily , Weekly | |
| Add AFL to Watchlist: View: Get Complete AFL Trend Analysis ➞ | |
 | BANF BancFirst Corporation |
| Sector: Financials | |
| SubSector: Regional - Southwest Banks | |
| MarketCap: 1068.65 Millions | |
| Recent Price: 122.87 Smart Investing & Trading Score: 23 | |
| Day Percent Change: 0.47% Day Change: 0.57 | |
| Week Change: 0.47% Year-to-date Change: 5.3% | |
| BANF Links: Profile News Message Board | |
| Charts:- Daily , Weekly | |
| Add BANF to Watchlist: View: Get Complete BANF Trend Analysis ➞ | |
 | PFG Principal Financial Group, Inc. |
| Sector: Financials | |
| SubSector: Life Insurance | |
| MarketCap: 8178.86 Millions | |
| Recent Price: 75.88 Smart Investing & Trading Score: 0 | |
| Day Percent Change: 0.46% Day Change: 0.35 | |
| Week Change: 0.46% Year-to-date Change: -1.1% | |
| PFG Links: Profile News Message Board | |
| Charts:- Daily , Weekly | |
| Add PFG to Watchlist: View: Get Complete PFG Trend Analysis ➞ | |
 | NTRS Northern Trust Corporation |
| Sector: Financials | |
| SubSector: Asset Management | |
| MarketCap: 15316.8 Millions | |
| Recent Price: 127.65 Smart Investing & Trading Score: 46 | |
| Day Percent Change: 0.46% Day Change: 0.59 | |
| Week Change: 0.46% Year-to-date Change: 25.5% | |
| NTRS Links: Profile News Message Board | |
| Charts:- Daily , Weekly | |
| Add NTRS to Watchlist: View: Get Complete NTRS Trend Analysis ➞ | |
 | HCI HCI Group, Inc. |
| Sector: Financials | |
| SubSector: Property & Casualty Insurance | |
| MarketCap: 297.412 Millions | |
| Recent Price: 139.49 Smart Investing & Trading Score: 28 | |
| Day Percent Change: 0.45% Day Change: 0.63 | |
| Week Change: 0.45% Year-to-date Change: 20.1% | |
| HCI Links: Profile News Message Board | |
| Charts:- Daily , Weekly | |
| Add HCI to Watchlist: View: Get Complete HCI Trend Analysis ➞ | |
 | SAFE Safehold Inc. |
| Sector: Financials | |
| SubSector: REIT - Diversified | |
| MarketCap: 2994.63 Millions | |
| Recent Price: 14.15 Smart Investing & Trading Score: 25 | |
| Day Percent Change: 0.43% Day Change: 0.06 | |
| Week Change: 0.43% Year-to-date Change: -22.7% | |
| SAFE Links: Profile News Message Board | |
| Charts:- Daily , Weekly | |
| Add SAFE to Watchlist: View: Get Complete SAFE Trend Analysis ➞ | |
 | SYBT Stock Yards Bancorp, Inc. |
| Sector: Financials | |
| SubSector: Regional - Southeast Banks | |
| MarketCap: 629.235 Millions | |
| Recent Price: 73.90 Smart Investing & Trading Score: 30 | |
| Day Percent Change: 0.43% Day Change: 0.32 | |
| Week Change: 0.43% Year-to-date Change: 3.7% | |
| SYBT Links: Profile News Message Board | |
| Charts:- Daily , Weekly | |
| Add SYBT to Watchlist: View: Get Complete SYBT Trend Analysis ➞ | |
 | PLYM Plymouth Industrial REIT, Inc. |
| Sector: Financials | |
| SubSector: REIT - Industrial | |
| MarketCap: 153.449 Millions | |
| Recent Price: 14.45 Smart Investing & Trading Score: 20 | |
| Day Percent Change: 0.42% Day Change: 0.06 | |
| Week Change: 0.42% Year-to-date Change: -17.7% | |
| PLYM Links: Profile News Message Board | |
| Charts:- Daily , Weekly | |
| Add PLYM to Watchlist: View: Get Complete PLYM Trend Analysis ➞ | |
 | TRST TrustCo Bank Corp NY |
| Sector: Financials | |
| SubSector: Regional - Northeast Banks | |
| MarketCap: 543.999 Millions | |
| Recent Price: 33.19 Smart Investing & Trading Score: 48 | |
| Day Percent Change: 0.42% Day Change: 0.14 | |
| Week Change: 0.42% Year-to-date Change: 0.8% | |
| TRST Links: Profile News Message Board | |
| Charts:- Daily , Weekly | |
| Add TRST to Watchlist: View: Get Complete TRST Trend Analysis ➞ | |
 | BAC Bank of America Corporation |
| Sector: Financials | |
| SubSector: Money Center Banks | |
| MarketCap: 189690 Millions | |
| Recent Price: 45.85 Smart Investing & Trading Score: 26 | |
| Day Percent Change: 0.42% Day Change: 0.19 | |
| Week Change: 0.42% Year-to-date Change: 5.0% | |
| BAC Links: Profile News Message Board | |
| Charts:- Daily , Weekly | |
| Add BAC to Watchlist: View: Get Complete BAC Trend Analysis ➞ | |
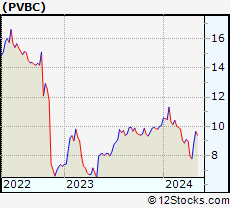 | PVBC Provident Bancorp, Inc. |
| Sector: Financials | |
| SubSector: Money Center Banks | |
| MarketCap: 168.599 Millions | |
| Recent Price: 12.19 Smart Investing & Trading Score: 43 | |
| Day Percent Change: 0.41% Day Change: 0.05 | |
| Week Change: 0.41% Year-to-date Change: 6.9% | |
| PVBC Links: Profile News Message Board | |
| Charts:- Daily , Weekly | |
| Add PVBC to Watchlist: View: Get Complete PVBC Trend Analysis ➞ | |
 | PB Prosperity Bancshares, Inc. |
| Sector: Financials | |
| SubSector: Regional - Southwest Banks | |
| MarketCap: 4682.25 Millions | |
| Recent Price: 66.19 Smart Investing & Trading Score: 25 | |
| Day Percent Change: 0.41% Day Change: 0.27 | |
| Week Change: 0.41% Year-to-date Change: -11.4% | |
| PB Links: Profile News Message Board | |
| Charts:- Daily , Weekly | |
| Add PB to Watchlist: View: Get Complete PB Trend Analysis ➞ | |
 | DLR Digital Realty Trust, Inc. |
| Sector: Financials | |
| SubSector: REIT - Office | |
| MarketCap: 27038.6 Millions | |
| Recent Price: 172.91 Smart Investing & Trading Score: 26 | |
| Day Percent Change: 0.41% Day Change: 0.7 | |
| Week Change: 0.41% Year-to-date Change: -1.7% | |
| DLR Links: Profile News Message Board | |
| Charts:- Daily , Weekly | |
| Add DLR to Watchlist: View: Get Complete DLR Trend Analysis ➞ | |
 | AMT American Tower Corporation (REIT) |
| Sector: Financials | |
| SubSector: REIT - Diversified | |
| MarketCap: 92527 Millions | |
| Recent Price: 212.98 Smart Investing & Trading Score: 25 | |
| Day Percent Change: 0.41% Day Change: 0.88 | |
| Week Change: 0.41% Year-to-date Change: 17.1% | |
| AMT Links: Profile News Message Board | |
| Charts:- Daily , Weekly | |
| Add AMT to Watchlist: View: Get Complete AMT Trend Analysis ➞ | |
 | CCNE CNB Financial Corporation |
| Sector: Financials | |
| SubSector: Regional - Northeast Banks | |
| MarketCap: 286.599 Millions | |
| Recent Price: 22.57 Smart Investing & Trading Score: 26 | |
| Day Percent Change: 0.4% Day Change: 0.09 | |
| Week Change: 0.4% Year-to-date Change: -8.6% | |
| CCNE Links: Profile News Message Board | |
| Charts:- Daily , Weekly | |
| Add CCNE to Watchlist: View: Get Complete CCNE Trend Analysis ➞ | |
 | QCRH QCR Holdings, Inc. |
| Sector: Financials | |
| SubSector: Regional - Southwest Banks | |
| MarketCap: 465.765 Millions | |
| Recent Price: 70.29 Smart Investing & Trading Score: 36 | |
| Day Percent Change: 0.4% Day Change: 0.28 | |
| Week Change: 0.4% Year-to-date Change: -12.8% | |
| QCRH Links: Profile News Message Board | |
| Charts:- Daily , Weekly | |
| Add QCRH to Watchlist: View: Get Complete QCRH Trend Analysis ➞ | |
 | PEBO Peoples Bancorp Inc. |
| Sector: Financials | |
| SubSector: Regional - Midwest Banks | |
| MarketCap: 449.77 Millions | |
| Recent Price: 28.27 Smart Investing & Trading Score: 10 | |
| Day Percent Change: 0.39% Day Change: 0.11 | |
| Week Change: 0.39% Year-to-date Change: -9.7% | |
| PEBO Links: Profile News Message Board | |
| Charts:- Daily , Weekly | |
| Add PEBO to Watchlist: View: Get Complete PEBO Trend Analysis ➞ | |
 | LKFN Lakeland Financial Corporation |
| Sector: Financials | |
| SubSector: Regional - Midwest Banks | |
| MarketCap: 903.27 Millions | |
| Recent Price: 61.84 Smart Investing & Trading Score: 36 | |
| Day Percent Change: 0.39% Day Change: 0.24 | |
| Week Change: 0.39% Year-to-date Change: -8.6% | |
| LKFN Links: Profile News Message Board | |
| Charts:- Daily , Weekly | |
| Add LKFN to Watchlist: View: Get Complete LKFN Trend Analysis ➞ | |
 | NAVI Navient Corporation |
| Sector: Financials | |
| SubSector: Credit Services | |
| MarketCap: 1362.48 Millions | |
| Recent Price: 12.71 Smart Investing & Trading Score: 35 | |
| Day Percent Change: 0.39% Day Change: 0.05 | |
| Week Change: 0.39% Year-to-date Change: -3.2% | |
| NAVI Links: Profile News Message Board | |
| Charts:- Daily , Weekly | |
| Add NAVI to Watchlist: View: Get Complete NAVI Trend Analysis ➞ | |
 | MLP Maui Land & Pineapple Company, Inc. |
| Sector: Financials | |
| SubSector: Real Estate Development | |
| MarketCap: 186.619 Millions | |
| Recent Price: 16.47 Smart Investing & Trading Score: 68 | |
| Day Percent Change: 0.37% Day Change: 0.06 | |
| Week Change: 0.37% Year-to-date Change: -25.1% | |
| MLP Links: Profile News Message Board | |
| Charts:- Daily , Weekly | |
| Add MLP to Watchlist: View: Get Complete MLP Trend Analysis ➞ | |
 | SKWD Skyward Specialty Insurance Group, Inc. |
| Sector: Financials | |
| SubSector: Insurance - Property & Casualty | |
| MarketCap: 936 Millions | |
| Recent Price: 49.57 Smart Investing & Trading Score: 25 | |
| Day Percent Change: 0.36% Day Change: 0.18 | |
| Week Change: 0.36% Year-to-date Change: -1.9% | |
| SKWD Links: Profile News Message Board | |
| Charts:- Daily , Weekly | |
| Add SKWD to Watchlist: View: Get Complete SKWD Trend Analysis ➞ | |
 | GSBC Great Southern Bancorp, Inc. |
| Sector: Financials | |
| SubSector: Regional - Southwest Banks | |
| MarketCap: 524.765 Millions | |
| Recent Price: 56.17 Smart Investing & Trading Score: 23 | |
| Day Percent Change: 0.32% Day Change: 0.18 | |
| Week Change: 0.32% Year-to-date Change: -5.2% | |
| GSBC Links: Profile News Message Board | |
| Charts:- Daily , Weekly | |
| Add GSBC to Watchlist: View: Get Complete GSBC Trend Analysis ➞ | |
 | UNM Unum Group |
| Sector: Financials | |
| SubSector: Accident & Health Insurance | |
| MarketCap: 2760.9 Millions | |
| Recent Price: 69.95 Smart Investing & Trading Score: 0 | |
| Day Percent Change: 0.32% Day Change: 0.22 | |
| Week Change: 0.32% Year-to-date Change: -3.2% | |
| UNM Links: Profile News Message Board | |
| Charts:- Daily , Weekly | |
| Add UNM to Watchlist: View: Get Complete UNM Trend Analysis ➞ | |
 | OZK Bank OZK |
| Sector: Financials | |
| SubSector: Regional - Southeast Banks | |
| MarketCap: 2518.35 Millions | |
| Recent Price: 47.97 Smart Investing & Trading Score: 36 | |
| Day Percent Change: 0.31% Day Change: 0.15 | |
| Week Change: 0.31% Year-to-date Change: 10.1% | |
| OZK Links: Profile News Message Board | |
| Charts:- Daily , Weekly | |
| Add OZK to Watchlist: View: Get Complete OZK Trend Analysis ➞ | |
| For tabular summary view of above stock list: Summary View ➞ 0 - 25 , 25 - 50 , 50 - 75 , 75 - 100 , 100 - 125 , 125 - 150 , 150 - 175 , 175 - 200 , 200 - 225 , 225 - 250 , 250 - 275 , 275 - 300 , 300 - 325 , 325 - 350 , 350 - 375 , 375 - 400 , 400 - 425 , 425 - 450 , 450 - 475 , 475 - 500 , 500 - 525 , 525 - 550 , 550 - 575 | ||
| Click To Change The Sort Order: By Market Cap or Company Size Performance: Year-to-date, Week and Day | |
| Select Chart Type: | ||
|
Best Stocks Today 12Stocks.com |
© 2025 12Stocks.com Terms & Conditions Privacy Contact Us
All Information Provided Only For Education And Not To Be Used For Investing or Trading. See Terms & Conditions


One More Thing ... Get Best Stocks Delivered Daily!
Never Ever Miss A Move With Our Top Ten Stocks Lists
Find Best Stocks In Any Market - Bull or Bear Market
Take A Peek At Our Top Ten Stocks Lists: Daily, Weekly, Year-to-Date & Top Trends
Find Best Stocks In Any Market - Bull or Bear Market
Take A Peek At Our Top Ten Stocks Lists: Daily, Weekly, Year-to-Date & Top Trends
Financial Stocks With Best Up Trends [0-bearish to 100-bullish]: Uniti [100], LendingTree [100], Mercury General[100], Perella Weinberg[100], Broadstone Net[100], LendingClub [100], TPG RE[100], CareTrust REIT[100], Stewart Information[100], Healthcare Realty[100], VICI Properties[100]
Best Financial Stocks Year-to-Date:
ESSA Bancorp[3207.77%], Easterly Government[108.45%], Mr. Cooper[86.58%], Heritage Insurance[75.29%], Root [65.29%], Industrial Logistics[64.89%], Rocket [58.42%], Diversified Healthcare[49.61%], ProAssurance [49.59%], Uniti [47.09%], SoFi Technologies[41.62%] Best Financial Stocks This Week:
Uniti [64.77%], Industrial Logistics[11.36%], LendingTree [7.32%], eXp World[7.27%], EverQuote [6.89%], Camping World[6.84%], First Foundation[6.69%], Diamond Hill[5.46%], Mercury General[5.36%], Cipher Mining[5.27%], AlTi Global[5.13%] Best Financial Stocks Daily:
Uniti [64.77%], Industrial Logistics[11.36%], LendingTree [7.32%], eXp World[7.27%], EverQuote [6.89%], Camping World[6.84%], First Foundation[6.69%], Diamond Hill[5.46%], Mercury General[5.36%], Cipher Mining[5.27%], AlTi Global[5.13%]