
 Login Sign Up


| |||||
 |  | ||||

| 12Stocks.com Market Intelligence |
Best Financial Stocks
| In a hurry? Financial Stocks Lists: Performance Trends Table, Stock Charts
Sort Financial stocks: Daily, Weekly, Year-to-Date, Market Cap & Trends. Filter Financial stocks list by size:All Financial Large Mid-Range Small & MicroCap |
| 12Stocks.com Financial Stocks Performances & Trends Daily | |||||||||
|
|  The overall Smart Investing & Trading Score is 20 (0-bearish to 100-bullish) which puts Financial sector in short term bearish trend. The Smart Investing & Trading Score from previous trading session is 30 and a deterioration of trend continues.
| ||||||||
Here are the Smart Investing & Trading Scores of the most requested Financial stocks at 12Stocks.com (click stock name for detailed review):
|


| 12Stocks.com: Investing in Financial sector with Stocks | |
|
The following table helps investors and traders sort through current performance and trends (as measured by Smart Investing & Trading Score) of various
stocks in the Financial sector. Quick View: Move mouse or cursor over stock symbol (ticker) to view short-term Technical chart and over stock name to view long term chart. Click on  to add stock symbol to your watchlist and to add stock symbol to your watchlist and  to view watchlist. Click on any ticker or stock name for detailed market intelligence report for that stock. to view watchlist. Click on any ticker or stock name for detailed market intelligence report for that stock. |
12Stocks.com Performance of Stocks in Financial Sector
| Ticker | Stock Name | Watchlist | Category | Recent Price | Trend Score | Change % | YTD Change% |
| NMRK | Newmark |   | Real Estate Services | 18.17 | 30 | -1.73% | 45.56% |
| BBUC | Brookfield Business | | Asset Mgmt | 33.73 | 49 | -0.56% | 38.46% |
| WSFS | WSFS | | Banks - Regional | 53.66 | 10 | 0.34% | 4.23% |
| PSB | PS Business | | REIT - | 480.66 | 80 | 0.42% | 0.00% |
| FHB | First Hawaiian | | Banks - Regional | 24.46 | 10 | -0.37% | -2.39% |
| BFR | BBVA Banco | | Foreign Banks | 91.35 | 80 | -0.71% | 0.00% |
| BHFAM | Brighthouse | | Insurance - Life | 12.10 | 38 | -0.30% | -13.47% |
| CBU | Community | | Banks - Regional | 57.88 | 20 | -0.60% | -3.66% |
| GSHD | Goosehead Insurance | | Insurance | 72.08 | 10 | 1.11% | -27.61% |
| NMIH | NMI | | Insurance - Specialty | 37.25 | 0 | -0.72% | 1.78% |
| WSBC | Wesbanco | | Banks - Regional | 32.23 | 60 | 0.69% | 3.45% |
| APLE | Apple Hospitality | | REIT - Hotel & Motel | 12.07 | 70 | 0.00% | -16.70% |
| OUT | Outfront Media | | REIT - Specialty | 18.27 | 30 | 1.11% | 5.40% |
| SFNC | Simmons First | | Banks - Regional | 19.23 | 30 | -0.85% | -9.45% |
| ENVA | Enova | | Credit Services | 114.32 | 10 | 1.88% | 18.91% |
| CSQ | Calamos Strategic | | Closed-End Fund - Debt | 19.35 | 90 | 0.31% | 14.28% |
| WD | Walker & Dunlop | | Mortgage Finance | 84.38 | 70 | -0.18% | -10.07% |
| SRC | Spirit Realty | | REIT - | 79.70 | 100 | 1.07% | 0.00% |
| JOE | St. Joe | | Real Estate - | 48.82 | 10 | -1.53% | 10.00% |
| CIFR | Cipher Mining | | Capital Markets | 13.78 | 100 | 9.37% | 185.30% |
| TOWN | Townebank Portsmouth | | Banks - Regional | 34.31 | 0 | 0.26% | 4.86% |
| TCB | TCF | | Banks | 16.86 | 20 | 0.00% | 0.00% |
| BKU | BankUnited | | Banks - Regional | 38.06 | 40 | 0.34% | 3.07% |
| BUR | Burford Capital | | Asset Mgmt | 11.93 | 10 | 0.08% | -7.01% |
| ESGR | Enstar | | Insurance | 337.91 | 90 | 0.46% | 4.16% |
| For chart view version of above stock list: Chart View ➞ 0 - 25 , 25 - 50 , 50 - 75 , 75 - 100 , 100 - 125 , 125 - 150 , 150 - 175 , 175 - 200 , 200 - 225 , 225 - 250 , 250 - 275 , 275 - 300 , 300 - 325 , 325 - 350 , 350 - 375 , 375 - 400 , 400 - 425 , 425 - 450 , 450 - 475 , 475 - 500 , 500 - 525 , 525 - 550 , 550 - 575 , 575 - 600 , 600 - 625 , 625 - 650 , 650 - 675 , 675 - 700 , 700 - 725 , 725 - 750 , 750 - 775 , 775 - 800 , 800 - 825 , 825 - 850 , 850 - 875 , 875 - 900 , 900 - 925 , 925 - 950 , 950 - 975 , 975 - 1000 , 1000 - 1025 , 1025 - 1050 , 1050 - 1075 , 1075 - 1100 , 1100 - 1125 , 1125 - 1150 , 1150 - 1175 , 1175 - 1200 , 1200 - 1225 , 1225 - 1250 , 1250 - 1275 , 1275 - 1300 , 1300 - 1325 , 1325 - 1350 , 1350 - 1375 , 1375 - 1400 , 1400 - 1425 , 1425 - 1450 , 1450 - 1475 , 1475 - 1500 , 1500 - 1525 , 1525 - 1550 | ||
 | Click To Change The Sort Order: By Market Cap or Company Size Performance: Year-to-date, Week and Day |  |
|
Get the most comprehensive stock market coverage daily at 12Stocks.com ➞ Best Stocks Today ➞ Best Stocks Weekly ➞ Best Stocks Year-to-Date ➞ Best Stocks Trends ➞  Best Stocks Today 12Stocks.com Best Nasdaq Stocks ➞ Best S&P 500 Stocks ➞ Best Tech Stocks ➞ Best Biotech Stocks ➞ |
| Detailed Overview of Financial Stocks |
| Financial Technical Overview, Leaders & Laggards, Top Financial ETF Funds & Detailed Financial Stocks List, Charts, Trends & More |
| Financial Sector: Technical Analysis, Trends & YTD Performance | |
| Financial sector is composed of stocks
from banks, brokers, insurance, REITs
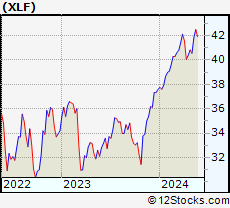
and services subsectors. Financial sector, as represented by XLF, an exchange-traded fund [ETF] that holds basket of Financial stocks (e.g, Bank of America, Goldman Sachs) is up by 11.4442% and is currently underperforming the overall market by -3.3137% year-to-date. Below is a quick view of Technical charts and trends: |
|
 XLF Weekly Chart |
|
| Long Term Trend: Good | |
| Medium Term Trend: Not Good | |
 XLF Daily Chart |
|
| Short Term Trend: Not Good | |
| Overall Trend Score: 20 | |
| YTD Performance: 11.4442% | |
| **Trend Scores & Views Are Only For Educational Purposes And Not For Investing | |
| 12Stocks.com: Top Performing Financial Sector Stocks | |||||||||||||||||||||||||||||||||||||||||||||||
 The top performing Financial sector stocks year to date are
Now, more recently, over last week, the top performing Financial sector stocks on the move are


|
|||||||||||||||||||||||||||||||||||||||||||||||
| 12Stocks.com: Investing in Financial Sector using Exchange Traded Funds | |
|
The following table shows list of key exchange traded funds (ETF) that
help investors track Financial Index. For detailed view, check out our ETF Funds section of our website. Quick View: Move mouse or cursor over ETF symbol (ticker) to view short-term Technical chart and over ETF name to view long term chart. Click on ticker or stock name for detailed view. Click on to add stock symbol to your watchlist and to view watchlist. |
12Stocks.com List of ETFs that track Financial Index
| Ticker | ETF Name | Watchlist | Recent Price | Smart Investing & Trading Score | Change % | Week % | Year-to-date % |
| CHIX | China Financials | | 10.57 | 20 | 0 | 0 | 0% |
| 12Stocks.com: Charts, Trends, Fundamental Data and Performances of Financial Stocks | |
|
We now take in-depth look at all Financial stocks including charts, multi-period performances and overall trends (as measured by Smart Investing & Trading Score). One can sort Financial stocks (click link to choose) by Daily, Weekly and by Year-to-Date performances. Also, one can sort by size of the company or by market capitalization. |
| Select Your Default Chart Type: | |||||
| |||||
| Click on stock symbol or name for detailed view. Click on to add stock symbol to your watchlist and to view watchlist. Quick View: Move mouse or cursor over "Daily" to quickly view daily Technical stock chart and over "Weekly" to view weekly Technical stock chart. | |||||

 | NMRK Newmark Group Inc |
| Sector: Financials | |
| SubSector: Real Estate Services | |
| MarketCap: 3279.69 Millions | |
| Recent Price: 18.17 Smart Investing & Trading Score: 30 | |
| Day Percent Change: -1.73067% Day Change: -0.05 | |
| Week Change: -3.50505% Year-to-date Change: 45.6% | |
| NMRK Links: Profile News Message Board | |
| Charts:- Daily , Weekly | |
| Add NMRK to Watchlist: View: Get Complete NMRK Trend Analysis ➞ | |
 | BBUC Brookfield Business Corp |
| Sector: Financials | |
| SubSector: Asset Management | |
| MarketCap: 3271.5 Millions | |
| Recent Price: 33.73 Smart Investing & Trading Score: 49 | |
| Day Percent Change: -0.56% Day Change: -0.19 | |
| Week Change: 10.18% Year-to-date Change: 38.5% | |
| BBUC Links: Profile News Message Board | |
| Charts:- Daily , Weekly | |
| Add BBUC to Watchlist: View: Get Complete BBUC Trend Analysis ➞ | |
 | WSFS WSFS Financial Corp |
| Sector: Financials | |
| SubSector: Banks - Regional | |
| MarketCap: 3262.44 Millions | |
| Recent Price: 53.66 Smart Investing & Trading Score: 10 | |
| Day Percent Change: 0.336574% Day Change: -0.08 | |
| Week Change: -1.95505% Year-to-date Change: 4.2% | |
| WSFS Links: Profile News Message Board | |
| Charts:- Daily , Weekly | |
| Add WSFS to Watchlist: View: Get Complete WSFS Trend Analysis ➞ | |
 | PSB PS Business Parks, Inc. |
| Sector: Financials | |
| SubSector: REIT - Diversified | |
| MarketCap: 3222.43 Millions | |
| Recent Price: 480.66 Smart Investing & Trading Score: 80 | |
| Day Percent Change: 0.415735% Day Change: -9999 | |
| Week Change: 156.434% Year-to-date Change: 0.0% | |
| PSB Links: Profile News Message Board | |
| Charts:- Daily , Weekly | |
| Add PSB to Watchlist: View: Get Complete PSB Trend Analysis ➞ | |
 | FHB First Hawaiian INC |
| Sector: Financials | |
| SubSector: Banks - Regional | |
| MarketCap: 3206.67 Millions | |
| Recent Price: 24.46 Smart Investing & Trading Score: 10 | |
| Day Percent Change: -0.366599% Day Change: -0.1 | |
| Week Change: -2.74354% Year-to-date Change: -2.4% | |
| FHB Links: Profile News Message Board | |
| Charts:- Daily , Weekly | |
| Add FHB to Watchlist: View: Get Complete FHB Trend Analysis ➞ | |
 | BFR BBVA Banco Frances S.A. |
| Sector: Financials | |
| SubSector: Foreign Regional Banks | |
| MarketCap: 3181.33 Millions | |
| Recent Price: 91.35 Smart Investing & Trading Score: 80 | |
| Day Percent Change: -0.706522% Day Change: -9999 | |
| Week Change: 51.367% Year-to-date Change: 0.0% | |
| BFR Links: Profile News Message Board | |
| Charts:- Daily , Weekly | |
| Add BFR to Watchlist: View: Get Complete BFR Trend Analysis ➞ | |
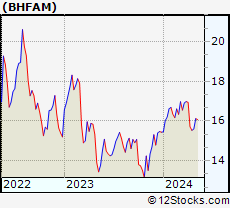 | BHFAM Brighthouse Financial, Inc. |
| Sector: Financials | |
| SubSector: Insurance - Life | |
| MarketCap: 3170 Millions | |
| Recent Price: 12.10 Smart Investing & Trading Score: 38 | |
| Day Percent Change: -0.3% Day Change: -0.04 | |
| Week Change: 4.03% Year-to-date Change: -13.5% | |
| BHFAM Links: Profile News Message Board | |
| Charts:- Daily , Weekly | |
| Add BHFAM to Watchlist: View: Get Complete BHFAM Trend Analysis ➞ | |
 | CBU Community Financial System Inc |
| Sector: Financials | |
| SubSector: Banks - Regional | |
| MarketCap: 3167.2 Millions | |
| Recent Price: 57.88 Smart Investing & Trading Score: 20 | |
| Day Percent Change: -0.601065% Day Change: 0.06 | |
| Week Change: -3.43677% Year-to-date Change: -3.7% | |
| CBU Links: Profile News Message Board | |
| Charts:- Daily , Weekly | |
| Add CBU to Watchlist: View: Get Complete CBU Trend Analysis ➞ | |
 | GSHD Goosehead Insurance Inc |
| Sector: Financials | |
| SubSector: Insurance Brokers | |
| MarketCap: 3124.45 Millions | |
| Recent Price: 72.08 Smart Investing & Trading Score: 10 | |
| Day Percent Change: 1.10815% Day Change: -1.93 | |
| Week Change: -6.34096% Year-to-date Change: -27.6% | |
| GSHD Links: Profile News Message Board | |
| Charts:- Daily , Weekly | |
| Add GSHD to Watchlist: View: Get Complete GSHD Trend Analysis ➞ | |
 | NMIH NMI Holdings Inc |
| Sector: Financials | |
| SubSector: Insurance - Specialty | |
| MarketCap: 3101.41 Millions | |
| Recent Price: 37.25 Smart Investing & Trading Score: 0 | |
| Day Percent Change: -0.719616% Day Change: -0.07 | |
| Week Change: -5.91058% Year-to-date Change: 1.8% | |
| NMIH Links: Profile News Message Board | |
| Charts:- Daily , Weekly | |
| Add NMIH to Watchlist: View: Get Complete NMIH Trend Analysis ➞ | |
 | WSBC Wesbanco, Inc |
| Sector: Financials | |
| SubSector: Banks - Regional | |
| MarketCap: 3098.55 Millions | |
| Recent Price: 32.23 Smart Investing & Trading Score: 60 | |
| Day Percent Change: 0.687285% Day Change: 0.01 | |
| Week Change: -0.370943% Year-to-date Change: 3.5% | |
| WSBC Links: Profile News Message Board | |
| Charts:- Daily , Weekly | |
| Add WSBC to Watchlist: View: Get Complete WSBC Trend Analysis ➞ | |
 | APLE Apple Hospitality REIT Inc |
| Sector: Financials | |
| SubSector: REIT - Hotel & Motel | |
| MarketCap: 3090.35 Millions | |
| Recent Price: 12.07 Smart Investing & Trading Score: 70 | |
| Day Percent Change: 0% Day Change: -0.01 | |
| Week Change: -0.821693% Year-to-date Change: -16.7% | |
| APLE Links: Profile News Message Board | |
| Charts:- Daily , Weekly | |
| Add APLE to Watchlist: View: Get Complete APLE Trend Analysis ➞ | |
 | OUT Outfront Media Inc |
| Sector: Financials | |
| SubSector: REIT - Specialty | |
| MarketCap: 3046.83 Millions | |
| Recent Price: 18.27 Smart Investing & Trading Score: 30 | |
| Day Percent Change: 1.10681% Day Change: -0.12 | |
| Week Change: -0.0547046% Year-to-date Change: 5.4% | |
| OUT Links: Profile News Message Board | |
| Charts:- Daily , Weekly | |
| Add OUT to Watchlist: View: Get Complete OUT Trend Analysis ➞ | |
 | SFNC Simmons First National Corp |
| Sector: Financials | |
| SubSector: Banks - Regional | |
| MarketCap: 3021.36 Millions | |
| Recent Price: 19.23 Smart Investing & Trading Score: 30 | |
| Day Percent Change: -0.850954% Day Change: -0.04 | |
| Week Change: -2.11303% Year-to-date Change: -9.4% | |
| SFNC Links: Profile News Message Board | |
| Charts:- Daily , Weekly | |
| Add SFNC to Watchlist: View: Get Complete SFNC Trend Analysis ➞ | |
 | ENVA Enova International Inc |
| Sector: Financials | |
| SubSector: Credit Services | |
| MarketCap: 3005.77 Millions | |
| Recent Price: 114.32 Smart Investing & Trading Score: 10 | |
| Day Percent Change: 1.8804% Day Change: 0.05 | |
| Week Change: -7.65751% Year-to-date Change: 18.9% | |
| ENVA Links: Profile News Message Board | |
| Charts:- Daily , Weekly | |
| Add ENVA to Watchlist: View: Get Complete ENVA Trend Analysis ➞ | |
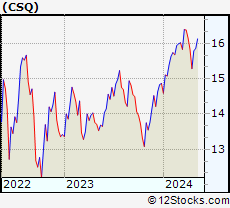 | CSQ Calamos Strategic Total Return Fund |
| Sector: Financials | |
| SubSector: Closed-End Fund - Debt | |
| MarketCap: 2984.48 Millions | |
| Recent Price: 19.35 Smart Investing & Trading Score: 90 | |
| Day Percent Change: 0.311042% Day Change: -0.05 | |
| Week Change: -0.462963% Year-to-date Change: 14.3% | |
| CSQ Links: Profile News Message Board | |
| Charts:- Daily , Weekly | |
| Add CSQ to Watchlist: View: Get Complete CSQ Trend Analysis ➞ | |
 | WD Walker & Dunlop Inc |
| Sector: Financials | |
| SubSector: Mortgage Finance | |
| MarketCap: 2984.45 Millions | |
| Recent Price: 84.38 Smart Investing & Trading Score: 70 | |
| Day Percent Change: -0.177452% Day Change: -2.04 | |
| Week Change: 1.00551% Year-to-date Change: -10.1% | |
| WD Links: Profile News Message Board | |
| Charts:- Daily , Weekly | |
| Add WD to Watchlist: View: Get Complete WD Trend Analysis ➞ | |
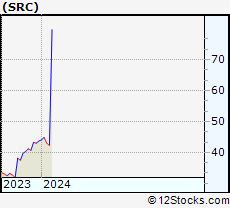 | SRC Spirit Realty Capital, Inc. |
| Sector: Financials | |
| SubSector: REIT - Diversified | |
| MarketCap: 2984.13 Millions | |
| Recent Price: 79.70 Smart Investing & Trading Score: 100 | |
| Day Percent Change: 1.06518% Day Change: -9999 | |
| Week Change: 85.4351% Year-to-date Change: 0.0% | |
| SRC Links: Profile News Message Board | |
| Charts:- Daily , Weekly | |
| Add SRC to Watchlist: View: Get Complete SRC Trend Analysis ➞ | |
 | JOE St. Joe Co |
| Sector: Financials | |
| SubSector: Real Estate - Diversified | |
| MarketCap: 2961.43 Millions | |
| Recent Price: 48.82 Smart Investing & Trading Score: 10 | |
| Day Percent Change: -1.53288% Day Change: -0.16 | |
| Week Change: -0.407997% Year-to-date Change: 10.0% | |
| JOE Links: Profile News Message Board | |
| Charts:- Daily , Weekly | |
| Add JOE to Watchlist: View: Get Complete JOE Trend Analysis ➞ | |
 | CIFR Cipher Mining Inc |
| Sector: Financials | |
| SubSector: Capital Markets | |
| MarketCap: 2957.49 Millions | |
| Recent Price: 13.78 Smart Investing & Trading Score: 100 | |
| Day Percent Change: 9.36508% Day Change: -0.05 | |
| Week Change: -2.54597% Year-to-date Change: 185.3% | |
| CIFR Links: Profile News Message Board | |
| Charts:- Daily , Weekly | |
| Add CIFR to Watchlist: View: Get Complete CIFR Trend Analysis ➞ | |
 | TOWN Townebank Portsmouth VA |
| Sector: Financials | |
| SubSector: Banks - Regional | |
| MarketCap: 2944.04 Millions | |
| Recent Price: 34.31 Smart Investing & Trading Score: 0 | |
| Day Percent Change: 0.263004% Day Change: 0.05 | |
| Week Change: -4.00112% Year-to-date Change: 4.9% | |
| TOWN Links: Profile News Message Board | |
| Charts:- Daily , Weekly | |
| Add TOWN to Watchlist: View: Get Complete TOWN Trend Analysis ➞ | |
 | TCB TCF Financial Corporation |
| Sector: Financials | |
| SubSector: Money Center Banks | |
| MarketCap: 2943.43 Millions | |
| Recent Price: 16.86 Smart Investing & Trading Score: 20 | |
| Day Percent Change: 0% Day Change: -9999 | |
| Week Change: 0% Year-to-date Change: 0.0% | |
| TCB Links: Profile News Message Board | |
| Charts:- Daily , Weekly | |
| Add TCB to Watchlist: View: Get Complete TCB Trend Analysis ➞ | |
 | BKU BankUnited Inc |
| Sector: Financials | |
| SubSector: Banks - Regional | |
| MarketCap: 2931.79 Millions | |
| Recent Price: 38.06 Smart Investing & Trading Score: 40 | |
| Day Percent Change: 0.342737% Day Change: -0.44 | |
| Week Change: -0.807923% Year-to-date Change: 3.1% | |
| BKU Links: Profile News Message Board | |
| Charts:- Daily , Weekly | |
| Add BKU to Watchlist: View: Get Complete BKU Trend Analysis ➞ | |
 | BUR Burford Capital Limited |
| Sector: Financials | |
| SubSector: Asset Management | |
| MarketCap: 2916.74 Millions | |
| Recent Price: 11.93 Smart Investing & Trading Score: 10 | |
| Day Percent Change: 0.0838926% Day Change: -0.22 | |
| Week Change: -3.24412% Year-to-date Change: -7.0% | |
| BUR Links: Profile News Message Board | |
| Charts:- Daily , Weekly | |
| Add BUR to Watchlist: View: Get Complete BUR Trend Analysis ➞ | |
 | ESGR Enstar Group Limited |
| Sector: Financials | |
| SubSector: Property & Casualty Insurance | |
| MarketCap: 2886.02 Millions | |
| Recent Price: 337.91 Smart Investing & Trading Score: 90 | |
| Day Percent Change: 0.460816% Day Change: -9999 | |
| Week Change: 0.541522% Year-to-date Change: 4.2% | |
| ESGR Links: Profile News Message Board | |
| Charts:- Daily , Weekly | |
| Add ESGR to Watchlist: View: Get Complete ESGR Trend Analysis ➞ | |
| For tabular summary view of above stock list: Summary View ➞ 0 - 25 , 25 - 50 , 50 - 75 , 75 - 100 , 100 - 125 , 125 - 150 , 150 - 175 , 175 - 200 , 200 - 225 , 225 - 250 , 250 - 275 , 275 - 300 , 300 - 325 , 325 - 350 , 350 - 375 , 375 - 400 , 400 - 425 , 425 - 450 , 450 - 475 , 475 - 500 , 500 - 525 , 525 - 550 , 550 - 575 , 575 - 600 , 600 - 625 , 625 - 650 , 650 - 675 , 675 - 700 , 700 - 725 , 725 - 750 , 750 - 775 , 775 - 800 , 800 - 825 , 825 - 850 , 850 - 875 , 875 - 900 , 900 - 925 , 925 - 950 , 950 - 975 , 975 - 1000 , 1000 - 1025 , 1025 - 1050 , 1050 - 1075 , 1075 - 1100 , 1100 - 1125 , 1125 - 1150 , 1150 - 1175 , 1175 - 1200 , 1200 - 1225 , 1225 - 1250 , 1250 - 1275 , 1275 - 1300 , 1300 - 1325 , 1325 - 1350 , 1350 - 1375 , 1375 - 1400 , 1400 - 1425 , 1425 - 1450 , 1450 - 1475 , 1475 - 1500 , 1500 - 1525 , 1525 - 1550 | ||
| Click To Change The Sort Order: By Market Cap or Company Size Performance: Year-to-date, Week and Day | |
| Select Chart Type: | ||
|
Best Stocks Today 12Stocks.com |
© 2025 12Stocks.com Terms & Conditions Privacy Contact Us
All Information Provided Only For Education And Not To Be Used For Investing or Trading. See Terms & Conditions


One More Thing ... Get Best Stocks Delivered Daily!
Never Ever Miss A Move With Our Top Ten Stocks Lists
Find Best Stocks In Any Market - Bull or Bear Market
Take A Peek At Our Top Ten Stocks Lists: Daily, Weekly, Year-to-Date & Top Trends
Find Best Stocks In Any Market - Bull or Bear Market
Take A Peek At Our Top Ten Stocks Lists: Daily, Weekly, Year-to-Date & Top Trends
Financial Stocks With Best Up Trends [0-bearish to 100-bullish]: PIMCO California[100], Torchmark [100], PIMCO California[100], Triumph Bancorp[100], Cipher Mining[100], Lufax Holding[100], PIMCO Municipal[100], PIMCO Municipal[100], Front Yard[100], National General[100], Fifth Street[100]
Best Financial Stocks Year-to-Date:
Insight Select[12384.6%], Better Home[523.632%], IREN [363.5%], Global Medical[353.709%], Oxford Lane[287.756%], Robinhood Markets[269.422%], Metalpha Technology[225.664%], Cipher Mining[185.3%], Banco Santander[131.403%], Mr. Cooper[124.245%], Altisource Portfolio[121.195%] Best Financial Stocks This Week:
Colony Starwood[15929900%], Blackhawk Network[91300%], Macquarie Global[81662.9%], Credit Suisse[63241.6%], Pennsylvania Real[23823%], First Republic[22570.9%], Select ome[14000%], CorEnergy Infrastructure[6797.78%], FedNat Holding[5525%], BlackRock Municipal[5340%], BlackRock MuniYield[3379.04%] Best Financial Stocks Daily:
PIMCO California[11.9545%], Torchmark [11.8363%], PIMCO California[11.4754%], BlackRock Muni[10.8108%], Blackrock MuniYield[10.72%], Triumph Bancorp[10.2661%], Cipher Mining[9.36508%], AMBAC [8.24108%], BlackRock MuniYield[8.15348%], Summit [7.79817%], Concord Acquisition[7.63431%]