
 Login Sign Up


| |||||
 |  | ||||

| 12Stocks.com Market Intelligence |
Best Financial Stocks
| In a hurry? Financial Stocks Lists: Performance Trends Table, Stock Charts
Sort Financial stocks: Daily, Weekly, Year-to-Date, Market Cap & Trends. Filter Financial stocks list by size:All Financial Large Mid-Range Small & MicroCap |
| 12Stocks.com Financial Stocks Performances & Trends Daily | |||||||||
|
|  The overall Smart Investing & Trading Score is 33 (0-bearish to 100-bullish) which puts Financial sector in short term bearish to neutral trend. The Smart Investing & Trading Score from previous trading session is 26 and hence an improvement of trend.
| ||||||||
Here are the Smart Investing & Trading Scores of the most requested Financial stocks at 12Stocks.com (click stock name for detailed review):
|


| 12Stocks.com: Investing in Financial sector with Stocks | |
|
The following table helps investors and traders sort through current performance and trends (as measured by Smart Investing & Trading Score) of various
stocks in the Financial sector. Quick View: Move mouse or cursor over stock symbol (ticker) to view short-term Technical chart and over stock name to view long term chart. Click on  to add stock symbol to your watchlist and to add stock symbol to your watchlist and  to view watchlist. Click on any ticker or stock name for detailed market intelligence report for that stock. to view watchlist. Click on any ticker or stock name for detailed market intelligence report for that stock. |
12Stocks.com Performance of Stocks in Financial Sector
| Ticker | Stock Name | Watchlist | Category | Recent Price | Smart Investing & Trading Score | Change % | Weekly Change% |
| APLE | Apple Hospitality |   | REIT | 11.64 | 40 | 0.95% | 0.95% |
| AIV | Apartment | | REIT | 8.47 | 61 | 0.95% | 0.95% |
| AMP | Ameriprise | | Asset Mgmt | 506.28 | 30 | 0.95% | 0.95% |
| JOE | St. Joe | | Real Estatet | 50.33 | 51 | 0.94% | 0.94% |
| FNB | F.N.B | | Regional Banks | 15.00 | 36 | 0.94% | 0.94% |
| FMBH | First Mid | | Regional Banks | 37.81 | 53 | 0.93% | 0.93% |
| PRK | Park National | | Regional Banks | 160.03 | 10 | 0.93% | 0.93% |
| FHB | First Hawaiian | | Regional Banks | 23.95 | 23 | 0.93% | 0.93% |
| MBWM | Mercantile Bank | | Regional Banks | 44.85 | 43 | 0.92% | 0.92% |
| GDOT | Green Dot | | Credit Services | 9.97 | 48 | 0.91% | 0.91% |
| TRMK | Trustmark | | Regional Banks | 36.89 | 43 | 0.90% | 0.90% |
| SSB | South State | | Regional Banks | 93.59 | 43 | 0.89% | 0.89% |
| MITT | AG Mortgage | | Mortgage | 7.03 | 26 | 0.86% | 0.86% |
| MKL | Markel | | Insurance | 1946.42 | 13 | 0.86% | 0.86% |
| EQIX | Equinix . | | REIT - | 778.39 | 18 | 0.86% | 0.86% |
| CHCT | Community Healthcare | | REIT | 15.47 | 27 | 0.85% | 0.85% |
| BFS | Saul Centers | | REIT - Retail | 32.00 | 17 | 0.85% | 0.85% |
| SNV | Synovus | | Regional Banks | 46.94 | 17 | 0.84% | 0.84% |
| WSBF | Waterstone | | S&L | 13.32 | 58 | 0.83% | 0.83% |
| CBL | CBL & Associates Properties | | REIT - Retail | 26.78 | 63 | 0.83% | 0.83% |
| V | Visa | | Credit Services | 342.15 | 0 | 0.83% | 0.83% |
| BHLB | Berkshire Hills | | S&L | 24.54 | 17 | 0.82% | 0.82% |
| AMH | American Homes | | REIT | 35.48 | 35 | 0.82% | 0.82% |
| VOYA | Voya | | Asset Mgmt | 67.86 | 36 | 0.82% | 0.82% |
| PGC | Peapack-Gladstone | | Regional Banks | 24.95 | 10 | 0.81% | 0.81% |
| For chart view version of above stock list: Chart View ➞ 0 - 25 , 25 - 50 , 50 - 75 , 75 - 100 , 100 - 125 , 125 - 150 , 150 - 175 , 175 - 200 , 200 - 225 , 225 - 250 , 250 - 275 , 275 - 300 , 300 - 325 , 325 - 350 , 350 - 375 , 375 - 400 , 400 - 425 , 425 - 450 , 450 - 475 , 475 - 500 , 500 - 525 , 525 - 550 , 550 - 575 | ||
 | Click To Change The Sort Order: By Market Cap or Company Size Performance: Year-to-date, Week and Day |  |
|
Get the most comprehensive stock market coverage daily at 12Stocks.com ➞ Best Stocks Today ➞ Best Stocks Weekly ➞ Best Stocks Year-to-Date ➞ Best Stocks Trends ➞  Best Stocks Today 12Stocks.com Best Nasdaq Stocks ➞ Best S&P 500 Stocks ➞ Best Tech Stocks ➞ Best Biotech Stocks ➞ |
| Detailed Overview of Financial Stocks |
| Financial Technical Overview, Leaders & Laggards, Top Financial ETF Funds & Detailed Financial Stocks List, Charts, Trends & More |
| Financial Sector: Technical Analysis, Trends & YTD Performance | |
| Financial sector is composed of stocks
from banks, brokers, insurance, REITs
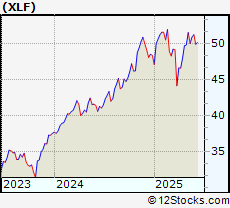
and services subsectors. Financial sector, as represented by XLF, an exchange-traded fund [ETF] that holds basket of Financial stocks (e.g, Bank of America, Goldman Sachs) is up by 7.8% and is currently outperforming the overall market by 0.27% year-to-date. Below is a quick view of Technical charts and trends: |
|
 XLF Weekly Chart |
|
| Long Term Trend: Good | |
| Medium Term Trend: Not Good | |
 XLF Daily Chart |
|
| Short Term Trend: Not Good | |
| Overall Trend Score: 33 | |
| YTD Performance: 7.8% | |
| **Trend Scores & Views Are Only For Educational Purposes And Not For Investing | |
| 12Stocks.com: Top Performing Financial Sector Stocks | ||||||||||||||||||||||||||||||||||||||||||||||||
 The top performing Financial sector stocks year to date are
Now, more recently, over last week, the top performing Financial sector stocks on the move are


|
||||||||||||||||||||||||||||||||||||||||||||||||
| 12Stocks.com: Investing in Financial Sector using Exchange Traded Funds | |
|
The following table shows list of key exchange traded funds (ETF) that
help investors track Financial Index. For detailed view, check out our ETF Funds section of our website. Quick View: Move mouse or cursor over ETF symbol (ticker) to view short-term Technical chart and over ETF name to view long term chart. Click on ticker or stock name for detailed view. Click on to add stock symbol to your watchlist and to view watchlist. |
12Stocks.com List of ETFs that track Financial Index
| Ticker | ETF Name | Watchlist | Recent Price | Smart Investing & Trading Score | Change % | Week % | Year-to-date % |
| XLF | Financial | | 51.91 | 33 | 0.99 | 0.99 | 7.8% |
| IAI | Broker-Dealers & Secs | | 174.97 | 63 | 2.34 | 2.34 | 21.82% |
| KBE | Bank | | 55.98 | 43 | 1.3 | 1.3 | 1.64% |
| FAS | Financial Bull 3X | | 161.82 | 33 | 2.91 | 2.91 | 7.48% |
| FAZ | Financial Bear 3X | | 4.54 | 62 | -2.78 | -2.78 | -27.4% |
| UYG | Financials | | 92.87 | 26 | 1.72 | 1.72 | 9% |
| KIE | Insurance | | 56.42 | 25 | 1.27 | 1.27 | 0.32% |
| 12Stocks.com: Charts, Trends, Fundamental Data and Performances of Financial Stocks | |
|
We now take in-depth look at all Financial stocks including charts, multi-period performances and overall trends (as measured by Smart Investing & Trading Score). One can sort Financial stocks (click link to choose) by Daily, Weekly and by Year-to-Date performances. Also, one can sort by size of the company or by market capitalization. |
| Select Your Default Chart Type: | |||||
| |||||
| Click on stock symbol or name for detailed view. Click on to add stock symbol to your watchlist and to view watchlist. Quick View: Move mouse or cursor over "Daily" to quickly view daily Technical stock chart and over "Weekly" to view weekly Technical stock chart. | |||||

 | APLE Apple Hospitality REIT, Inc. |
| Sector: Financials | |
| SubSector: REIT - Hotel/Motel | |
| MarketCap: 1515.74 Millions | |
| Recent Price: 11.64 Smart Investing & Trading Score: 40 | |
| Day Percent Change: 0.95% Day Change: 0.11 | |
| Week Change: 0.95% Year-to-date Change: -22.9% | |
| APLE Links: Profile News Message Board | |
| Charts:- Daily , Weekly | |
| Add APLE to Watchlist: View: Get Complete APLE Trend Analysis ➞ | |
 | AIV Apartment Investment and Management Company |
| Sector: Financials | |
| SubSector: REIT - Residential | |
| MarketCap: 4485.11 Millions | |
| Recent Price: 8.47 Smart Investing & Trading Score: 61 | |
| Day Percent Change: 0.95% Day Change: 0.08 | |
| Week Change: 0.95% Year-to-date Change: -0.2% | |
| AIV Links: Profile News Message Board | |
| Charts:- Daily , Weekly | |
| Add AIV to Watchlist: View: Get Complete AIV Trend Analysis ➞ | |
 | AMP Ameriprise Financial, Inc. |
| Sector: Financials | |
| SubSector: Asset Management | |
| MarketCap: 13270.5 Millions | |
| Recent Price: 506.28 Smart Investing & Trading Score: 30 | |
| Day Percent Change: 0.95% Day Change: 4.76 | |
| Week Change: 0.95% Year-to-date Change: -4.7% | |
| AMP Links: Profile News Message Board | |
| Charts:- Daily , Weekly | |
| Add AMP to Watchlist: View: Get Complete AMP Trend Analysis ➞ | |
 | JOE The St. Joe Company |
| Sector: Financials | |
| SubSector: Real Estate Development | |
| MarketCap: 1029.39 Millions | |
| Recent Price: 50.33 Smart Investing & Trading Score: 51 | |
| Day Percent Change: 0.94% Day Change: 0.47 | |
| Week Change: 0.94% Year-to-date Change: 12.4% | |
| JOE Links: Profile News Message Board | |
| Charts:- Daily , Weekly | |
| Add JOE to Watchlist: View: Get Complete JOE Trend Analysis ➞ | |
 | FNB F.N.B. Corporation |
| Sector: Financials | |
| SubSector: Regional - Southeast Banks | |
| MarketCap: 2445.55 Millions | |
| Recent Price: 15.00 Smart Investing & Trading Score: 36 | |
| Day Percent Change: 0.94% Day Change: 0.14 | |
| Week Change: 0.94% Year-to-date Change: 2.3% | |
| FNB Links: Profile News Message Board | |
| Charts:- Daily , Weekly | |
| Add FNB to Watchlist: View: Get Complete FNB Trend Analysis ➞ | |
 | FMBH First Mid Bancshares, Inc. |
| Sector: Financials | |
| SubSector: Regional - Midwest Banks | |
| MarketCap: 373.27 Millions | |
| Recent Price: 37.81 Smart Investing & Trading Score: 53 | |
| Day Percent Change: 0.93% Day Change: 0.35 | |
| Week Change: 0.93% Year-to-date Change: 3.3% | |
| FMBH Links: Profile News Message Board | |
| Charts:- Daily , Weekly | |
| Add FMBH to Watchlist: View: Get Complete FMBH Trend Analysis ➞ | |
 | PRK Park National Corporation |
| Sector: Financials | |
| SubSector: Regional - Midwest Banks | |
| MarketCap: 1416.6 Millions | |
| Recent Price: 160.03 Smart Investing & Trading Score: 10 | |
| Day Percent Change: 0.93% Day Change: 1.47 | |
| Week Change: 0.93% Year-to-date Change: -6.1% | |
| PRK Links: Profile News Message Board | |
| Charts:- Daily , Weekly | |
| Add PRK to Watchlist: View: Get Complete PRK Trend Analysis ➞ | |
 | FHB First Hawaiian, Inc. |
| Sector: Financials | |
| SubSector: Regional - Pacific Banks | |
| MarketCap: 2398.99 Millions | |
| Recent Price: 23.95 Smart Investing & Trading Score: 23 | |
| Day Percent Change: 0.93% Day Change: 0.22 | |
| Week Change: 0.93% Year-to-date Change: -6.8% | |
| FHB Links: Profile News Message Board | |
| Charts:- Daily , Weekly | |
| Add FHB to Watchlist: View: Get Complete FHB Trend Analysis ➞ | |
 | MBWM Mercantile Bank Corporation |
| Sector: Financials | |
| SubSector: Regional - Midwest Banks | |
| MarketCap: 372.77 Millions | |
| Recent Price: 44.85 Smart Investing & Trading Score: 43 | |
| Day Percent Change: 0.92% Day Change: 0.41 | |
| Week Change: 0.92% Year-to-date Change: 1.6% | |
| MBWM Links: Profile News Message Board | |
| Charts:- Daily , Weekly | |
| Add MBWM to Watchlist: View: Get Complete MBWM Trend Analysis ➞ | |
 | GDOT Green Dot Corporation |
| Sector: Financials | |
| SubSector: Credit Services | |
| MarketCap: 1320.08 Millions | |
| Recent Price: 9.97 Smart Investing & Trading Score: 48 | |
| Day Percent Change: 0.91% Day Change: 0.09 | |
| Week Change: 0.91% Year-to-date Change: -6.3% | |
| GDOT Links: Profile News Message Board | |
| Charts:- Daily , Weekly | |
| Add GDOT to Watchlist: View: Get Complete GDOT Trend Analysis ➞ | |
 | TRMK Trustmark Corporation |
| Sector: Financials | |
| SubSector: Regional - Southeast Banks | |
| MarketCap: 1630.15 Millions | |
| Recent Price: 36.89 Smart Investing & Trading Score: 43 | |
| Day Percent Change: 0.9% Day Change: 0.33 | |
| Week Change: 0.9% Year-to-date Change: 5.0% | |
| TRMK Links: Profile News Message Board | |
| Charts:- Daily , Weekly | |
| Add TRMK to Watchlist: View: Get Complete TRMK Trend Analysis ➞ | |
 | SSB South State Corporation |
| Sector: Financials | |
| SubSector: Regional - Mid-Atlantic Banks | |
| MarketCap: 2113.49 Millions | |
| Recent Price: 93.59 Smart Investing & Trading Score: 43 | |
| Day Percent Change: 0.89% Day Change: 0.83 | |
| Week Change: 0.89% Year-to-date Change: -5.5% | |
| SSB Links: Profile News Message Board | |
| Charts:- Daily , Weekly | |
| Add SSB to Watchlist: View: Get Complete SSB Trend Analysis ➞ | |
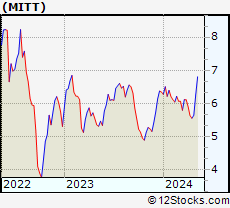 | MITT AG Mortgage Investment Trust, Inc. |
| Sector: Financials | |
| SubSector: Mortgage Investment | |
| MarketCap: 197.839 Millions | |
| Recent Price: 7.03 Smart Investing & Trading Score: 26 | |
| Day Percent Change: 0.86% Day Change: 0.06 | |
| Week Change: 0.86% Year-to-date Change: 8.6% | |
| MITT Links: Profile News Message Board | |
| Charts:- Daily , Weekly | |
| Add MITT to Watchlist: View: Get Complete MITT Trend Analysis ➞ | |
 | MKL Markel Corporation |
| Sector: Financials | |
| SubSector: Property & Casualty Insurance | |
| MarketCap: 12405.9 Millions | |
| Recent Price: 1946.42 Smart Investing & Trading Score: 13 | |
| Day Percent Change: 0.86% Day Change: 16.55 | |
| Week Change: 0.86% Year-to-date Change: 12.8% | |
| MKL Links: Profile News Message Board | |
| Charts:- Daily , Weekly | |
| Add MKL to Watchlist: View: Get Complete MKL Trend Analysis ➞ | |
 | EQIX Equinix, Inc. (REIT) |
| Sector: Financials | |
| SubSector: REIT - Diversified | |
| MarketCap: 45855.3 Millions | |
| Recent Price: 778.39 Smart Investing & Trading Score: 18 | |
| Day Percent Change: 0.86% Day Change: 6.64 | |
| Week Change: 0.86% Year-to-date Change: -17.0% | |
| EQIX Links: Profile News Message Board | |
| Charts:- Daily , Weekly | |
| Add EQIX to Watchlist: View: Get Complete EQIX Trend Analysis ➞ | |
 | CHCT Community Healthcare Trust Incorporated |
| Sector: Financials | |
| SubSector: REIT - Healthcare Facilities | |
| MarketCap: 698.614 Millions | |
| Recent Price: 15.47 Smart Investing & Trading Score: 27 | |
| Day Percent Change: 0.85% Day Change: 0.13 | |
| Week Change: 0.85% Year-to-date Change: -17.4% | |
| CHCT Links: Profile News Message Board | |
| Charts:- Daily , Weekly | |
| Add CHCT to Watchlist: View: Get Complete CHCT Trend Analysis ➞ | |
 | BFS Saul Centers, Inc. |
| Sector: Financials | |
| SubSector: REIT - Retail | |
| MarketCap: 689.914 Millions | |
| Recent Price: 32.00 Smart Investing & Trading Score: 17 | |
| Day Percent Change: 0.85% Day Change: 0.27 | |
| Week Change: 0.85% Year-to-date Change: -14.7% | |
| BFS Links: Profile News Message Board | |
| Charts:- Daily , Weekly | |
| Add BFS to Watchlist: View: Get Complete BFS Trend Analysis ➞ | |
 | SNV Synovus Financial Corp. |
| Sector: Financials | |
| SubSector: Regional - Mid-Atlantic Banks | |
| MarketCap: 2697.29 Millions | |
| Recent Price: 46.94 Smart Investing & Trading Score: 17 | |
| Day Percent Change: 0.84% Day Change: 0.39 | |
| Week Change: 0.84% Year-to-date Change: -7.6% | |
| SNV Links: Profile News Message Board | |
| Charts:- Daily , Weekly | |
| Add SNV to Watchlist: View: Get Complete SNV Trend Analysis ➞ | |
 | WSBF Waterstone Financial, Inc. |
| Sector: Financials | |
| SubSector: Savings & Loans | |
| MarketCap: 371.93 Millions | |
| Recent Price: 13.32 Smart Investing & Trading Score: 58 | |
| Day Percent Change: 0.83% Day Change: 0.11 | |
| Week Change: 0.83% Year-to-date Change: 1.5% | |
| WSBF Links: Profile News Message Board | |
| Charts:- Daily , Weekly | |
| Add WSBF to Watchlist: View: Get Complete WSBF Trend Analysis ➞ | |
 | CBL CBL & Associates Properties, Inc. |
| Sector: Financials | |
| SubSector: REIT - Retail | |
| MarketCap: 690 Millions | |
| Recent Price: 26.78 Smart Investing & Trading Score: 63 | |
| Day Percent Change: 0.83% Day Change: 0.22 | |
| Week Change: 0.83% Year-to-date Change: -5.0% | |
| CBL Links: Profile News Message Board | |
| Charts:- Daily , Weekly | |
| Add CBL to Watchlist: View: Get Complete CBL Trend Analysis ➞ | |
 | V Visa Inc. |
| Sector: Financials | |
| SubSector: Credit Services | |
| MarketCap: 340798 Millions | |
| Recent Price: 342.15 Smart Investing & Trading Score: 0 | |
| Day Percent Change: 0.83% Day Change: 2.8 | |
| Week Change: 0.83% Year-to-date Change: 8.4% | |
| V Links: Profile News Message Board | |
| Charts:- Daily , Weekly | |
| Add V to Watchlist: View: Get Complete V Trend Analysis ➞ | |
 | BHLB Berkshire Hills Bancorp, Inc. |
| Sector: Financials | |
| SubSector: Savings & Loans | |
| MarketCap: 686.33 Millions | |
| Recent Price: 24.54 Smart Investing & Trading Score: 17 | |
| Day Percent Change: 0.82% Day Change: 0.2 | |
| Week Change: 0.82% Year-to-date Change: -13.2% | |
| BHLB Links: Profile News Message Board | |
| Charts:- Daily , Weekly | |
| Add BHLB to Watchlist: View: Get Complete BHLB Trend Analysis ➞ | |
 | AMH American Homes 4 Rent |
| Sector: Financials | |
| SubSector: REIT - Residential | |
| MarketCap: 6135.31 Millions | |
| Recent Price: 35.48 Smart Investing & Trading Score: 35 | |
| Day Percent Change: 0.82% Day Change: 0.29 | |
| Week Change: 0.82% Year-to-date Change: -4.4% | |
| AMH Links: Profile News Message Board | |
| Charts:- Daily , Weekly | |
| Add AMH to Watchlist: View: Get Complete AMH Trend Analysis ➞ | |
 | VOYA Voya Financial, Inc. |
| Sector: Financials | |
| SubSector: Asset Management | |
| MarketCap: 4771.23 Millions | |
| Recent Price: 67.86 Smart Investing & Trading Score: 36 | |
| Day Percent Change: 0.82% Day Change: 0.55 | |
| Week Change: 0.82% Year-to-date Change: -0.8% | |
| VOYA Links: Profile News Message Board | |
| Charts:- Daily , Weekly | |
| Add VOYA to Watchlist: View: Get Complete VOYA Trend Analysis ➞ | |
 | PGC Peapack-Gladstone Financial Corporation |
| Sector: Financials | |
| SubSector: Regional - Northeast Banks | |
| MarketCap: 284.399 Millions | |
| Recent Price: 24.95 Smart Investing & Trading Score: 10 | |
| Day Percent Change: 0.81% Day Change: 0.2 | |
| Week Change: 0.81% Year-to-date Change: -22.0% | |
| PGC Links: Profile News Message Board | |
| Charts:- Daily , Weekly | |
| Add PGC to Watchlist: View: Get Complete PGC Trend Analysis ➞ | |
| For tabular summary view of above stock list: Summary View ➞ 0 - 25 , 25 - 50 , 50 - 75 , 75 - 100 , 100 - 125 , 125 - 150 , 150 - 175 , 175 - 200 , 200 - 225 , 225 - 250 , 250 - 275 , 275 - 300 , 300 - 325 , 325 - 350 , 350 - 375 , 375 - 400 , 400 - 425 , 425 - 450 , 450 - 475 , 475 - 500 , 500 - 525 , 525 - 550 , 550 - 575 | ||
| Click To Change The Sort Order: By Market Cap or Company Size Performance: Year-to-date, Week and Day | |
| Select Chart Type: | ||
|
Best Stocks Today 12Stocks.com |
© 2025 12Stocks.com Terms & Conditions Privacy Contact Us
All Information Provided Only For Education And Not To Be Used For Investing or Trading. See Terms & Conditions


One More Thing ... Get Best Stocks Delivered Daily!
Never Ever Miss A Move With Our Top Ten Stocks Lists
Find Best Stocks In Any Market - Bull or Bear Market
Take A Peek At Our Top Ten Stocks Lists: Daily, Weekly, Year-to-Date & Top Trends
Find Best Stocks In Any Market - Bull or Bear Market
Take A Peek At Our Top Ten Stocks Lists: Daily, Weekly, Year-to-Date & Top Trends
Financial Stocks With Best Up Trends [0-bearish to 100-bullish]: Uniti [100], LendingTree [100], Mercury General[100], Perella Weinberg[100], Broadstone Net[100], LendingClub [100], TPG RE[100], CareTrust REIT[100], Stewart Information[100], Healthcare Realty[100], VICI Properties[100]
Best Financial Stocks Year-to-Date:
ESSA Bancorp[3207.77%], Easterly Government[108.45%], Mr. Cooper[86.58%], Heritage Insurance[75.29%], Root [65.29%], Industrial Logistics[64.89%], Rocket [58.42%], Diversified Healthcare[49.61%], ProAssurance [49.59%], Uniti [47.09%], SoFi Technologies[41.62%] Best Financial Stocks This Week:
Uniti [64.77%], Industrial Logistics[11.36%], LendingTree [7.32%], eXp World[7.27%], EverQuote [6.89%], Camping World[6.84%], First Foundation[6.69%], Diamond Hill[5.46%], Mercury General[5.36%], Cipher Mining[5.27%], AlTi Global[5.13%] Best Financial Stocks Daily:
Uniti [64.77%], Industrial Logistics[11.36%], LendingTree [7.32%], eXp World[7.27%], EverQuote [6.89%], Camping World[6.84%], First Foundation[6.69%], Diamond Hill[5.46%], Mercury General[5.36%], Cipher Mining[5.27%], AlTi Global[5.13%]