
 Login Sign Up


| |||||
 |  | ||||

| 12Stocks.com Market Intelligence |
Best Financial Stocks
| In a hurry? Financial Stocks Lists: Performance Trends Table, Stock Charts
Sort Financial stocks: Daily, Weekly, Year-to-Date, Market Cap & Trends. Filter Financial stocks list by size:All Financial Large Mid-Range Small & MicroCap |
| 12Stocks.com Financial Stocks Performances & Trends Daily | |||||||||
|
|  The overall Smart Investing & Trading Score is 33 (0-bearish to 100-bullish) which puts Financial sector in short term bearish to neutral trend. The Smart Investing & Trading Score from previous trading session is 26 and hence an improvement of trend.
| ||||||||
Here are the Smart Investing & Trading Scores of the most requested Financial stocks at 12Stocks.com (click stock name for detailed review):
|


| 12Stocks.com: Investing in Financial sector with Stocks | |
|
The following table helps investors and traders sort through current performance and trends (as measured by Smart Investing & Trading Score) of various
stocks in the Financial sector. Quick View: Move mouse or cursor over stock symbol (ticker) to view short-term Technical chart and over stock name to view long term chart. Click on  to add stock symbol to your watchlist and to add stock symbol to your watchlist and  to view watchlist. Click on any ticker or stock name for detailed market intelligence report for that stock. to view watchlist. Click on any ticker or stock name for detailed market intelligence report for that stock. |
12Stocks.com Performance of Stocks in Financial Sector
| Ticker | Stock Name | Watchlist | Category | Recent Price | Smart Investing & Trading Score | Change % | YTD Change% |
| PSA | Public Storage |   | REIT - Industrial | 280.58 | 17 | 0.61% | -5.36% |
| SSB | South State | | Regional Banks | 93.59 | 43 | 0.89% | -5.45% |
| REXR | Rexford Industrial | | REIT - Industrial | 36.15 | 36 | 0.64% | -5.46% |
| BOKF | BOK | | Regional - Southwest Banks | 100.13 | 36 | 1.58% | -5.46% |
| TMP | Tompkins | | Regional Banks | 63.51 | 40 | 1.13% | -5.54% |
| TCBK | TriCo Bancshares | | Regional Banks | 40.95 | 53 | 1.71% | -5.55% |
| MMC | Marsh & McLennan | | Insurance | 199.08 | 18 | 0.66% | -5.61% |
| KRC | Kilroy Realty | | REIT - Office | 37.54 | 88 | 2.71% | -5.66% |
| FNLC | First Bancorp | | Regional Banks | 25.06 | 46 | 1.13% | -5.73% |
| UFCS | United Fire | | Insurance | 26.66 | 35 | 2.11% | -5.76% |
| CWK | Cushman & Wakefield | | Property Mgmt | 12.32 | 88 | 3.27% | -5.81% |
| ARR | ARMOUR Residential | | Mortgage | 16.80 | 93 | 2.56% | -5.83% |
| CFR | Cullen/Frost Bankers | | Regional - Southwest Banks | 125.53 | 7 | 1.07% | -5.84% |
| AGO | Assured Guaranty | | Insurance | 84.34 | 77 | 0.60% | -5.93% |
| USB | U.S. Bancorp | | Regional Banks | 44.42 | 36 | 1.09% | -6.02% |
| PRK | Park National | | Regional Banks | 160.03 | 10 | 0.93% | -6.06% |
| BANR | Banner | | Regional Banks | 62.18 | 43 | 1.80% | -6.23% |
| BANC | Banc of California | | Regional Banks | 14.38 | 43 | 1.55% | -6.29% |
| GDOT | Green Dot | | Credit Services | 9.97 | 48 | 0.91% | -6.30% |
| MOFG | MidWestOne | | Regional - Southwest Banks | 27.04 | 10 | 1.16% | -6.40% |
| AROW | Arrow | | Regional Banks | 26.57 | 61 | 1.57% | -6.48% |
| TRNO | Terreno Realty | | REIT - Industrial | 54.87 | 0 | 1.11% | -6.50% |
| NFBK | Northfield Bancorp | | Regional Banks | 10.74 | 32 | 3.27% | -6.55% |
| MPB | Mid Penn | | Regional Banks | 26.76 | 23 | -1.29% | -6.60% |
| MFA | MFA | | Mortgage | 9.19 | 35 | 0.66% | -6.63% |
| For chart view version of above stock list: Chart View ➞ 0 - 25 , 25 - 50 , 50 - 75 , 75 - 100 , 100 - 125 , 125 - 150 , 150 - 175 , 175 - 200 , 200 - 225 , 225 - 250 , 250 - 275 , 275 - 300 , 300 - 325 , 325 - 350 , 350 - 375 , 375 - 400 , 400 - 425 , 425 - 450 , 450 - 475 , 475 - 500 , 500 - 525 , 525 - 550 , 550 - 575 | ||
 | Click To Change The Sort Order: By Market Cap or Company Size Performance: Year-to-date, Week and Day |  |
|
Get the most comprehensive stock market coverage daily at 12Stocks.com ➞ Best Stocks Today ➞ Best Stocks Weekly ➞ Best Stocks Year-to-Date ➞ Best Stocks Trends ➞  Best Stocks Today 12Stocks.com Best Nasdaq Stocks ➞ Best S&P 500 Stocks ➞ Best Tech Stocks ➞ Best Biotech Stocks ➞ |
| Detailed Overview of Financial Stocks |
| Financial Technical Overview, Leaders & Laggards, Top Financial ETF Funds & Detailed Financial Stocks List, Charts, Trends & More |
| Financial Sector: Technical Analysis, Trends & YTD Performance | |
| Financial sector is composed of stocks
from banks, brokers, insurance, REITs
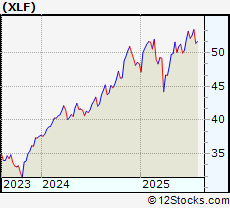
and services subsectors. Financial sector, as represented by XLF, an exchange-traded fund [ETF] that holds basket of Financial stocks (e.g, Bank of America, Goldman Sachs) is up by 7.8% and is currently outperforming the overall market by 0.27% year-to-date. Below is a quick view of Technical charts and trends: |
|
 XLF Weekly Chart |
|
| Long Term Trend: Good | |
| Medium Term Trend: Not Good | |
 XLF Daily Chart |
|
| Short Term Trend: Not Good | |
| Overall Trend Score: 33 | |
| YTD Performance: 7.8% | |
| **Trend Scores & Views Are Only For Educational Purposes And Not For Investing | |
| 12Stocks.com: Top Performing Financial Sector Stocks | ||||||||||||||||||||||||||||||||||||||||||||||||
 The top performing Financial sector stocks year to date are
Now, more recently, over last week, the top performing Financial sector stocks on the move are


|
||||||||||||||||||||||||||||||||||||||||||||||||
| 12Stocks.com: Investing in Financial Sector using Exchange Traded Funds | |
|
The following table shows list of key exchange traded funds (ETF) that
help investors track Financial Index. For detailed view, check out our ETF Funds section of our website. Quick View: Move mouse or cursor over ETF symbol (ticker) to view short-term Technical chart and over ETF name to view long term chart. Click on ticker or stock name for detailed view. Click on to add stock symbol to your watchlist and to view watchlist. |
12Stocks.com List of ETFs that track Financial Index
| Ticker | ETF Name | Watchlist | Recent Price | Smart Investing & Trading Score | Change % | Week % | Year-to-date % |
| XLF | Financial | | 51.91 | 33 | 0.99 | 0.99 | 7.8% |
| IAI | Broker-Dealers & Secs | | 174.97 | 63 | 2.34 | 2.34 | 21.82% |
| KBE | Bank | | 55.98 | 43 | 1.3 | 1.3 | 1.64% |
| FAS | Financial Bull 3X | | 161.82 | 33 | 2.91 | 2.91 | 7.48% |
| FAZ | Financial Bear 3X | | 4.54 | 62 | -2.78 | -2.78 | -27.4% |
| UYG | Financials | | 92.87 | 26 | 1.72 | 1.72 | 9% |
| KIE | Insurance | | 56.42 | 25 | 1.27 | 1.27 | 0.32% |
| 12Stocks.com: Charts, Trends, Fundamental Data and Performances of Financial Stocks | |
|
We now take in-depth look at all Financial stocks including charts, multi-period performances and overall trends (as measured by Smart Investing & Trading Score). One can sort Financial stocks (click link to choose) by Daily, Weekly and by Year-to-Date performances. Also, one can sort by size of the company or by market capitalization. |
| Select Your Default Chart Type: | |||||
| |||||
| Click on stock symbol or name for detailed view. Click on to add stock symbol to your watchlist and to view watchlist. Quick View: Move mouse or cursor over "Daily" to quickly view daily Technical stock chart and over "Weekly" to view weekly Technical stock chart. | |||||

 | PSA Public Storage |
| Sector: Financials | |
| SubSector: REIT - Industrial | |
| MarketCap: 32733.9 Millions | |
| Recent Price: 280.58 Smart Investing & Trading Score: 17 | |
| Day Percent Change: 0.61% Day Change: 1.69 | |
| Week Change: 0.61% Year-to-date Change: -5.4% | |
| PSA Links: Profile News Message Board | |
| Charts:- Daily , Weekly | |
| Add PSA to Watchlist: View: Get Complete PSA Trend Analysis ➞ | |
 | SSB South State Corporation |
| Sector: Financials | |
| SubSector: Regional - Mid-Atlantic Banks | |
| MarketCap: 2113.49 Millions | |
| Recent Price: 93.59 Smart Investing & Trading Score: 43 | |
| Day Percent Change: 0.89% Day Change: 0.83 | |
| Week Change: 0.89% Year-to-date Change: -5.5% | |
| SSB Links: Profile News Message Board | |
| Charts:- Daily , Weekly | |
| Add SSB to Watchlist: View: Get Complete SSB Trend Analysis ➞ | |
 | REXR Rexford Industrial Realty, Inc. |
| Sector: Financials | |
| SubSector: REIT - Industrial | |
| MarketCap: 4185.99 Millions | |
| Recent Price: 36.15 Smart Investing & Trading Score: 36 | |
| Day Percent Change: 0.64% Day Change: 0.23 | |
| Week Change: 0.64% Year-to-date Change: -5.5% | |
| REXR Links: Profile News Message Board | |
| Charts:- Daily , Weekly | |
| Add REXR to Watchlist: View: Get Complete REXR Trend Analysis ➞ | |
 | BOKF BOK Financial Corporation |
| Sector: Financials | |
| SubSector: Regional - Southwest Banks | |
| MarketCap: 2945.35 Millions | |
| Recent Price: 100.13 Smart Investing & Trading Score: 36 | |
| Day Percent Change: 1.58% Day Change: 1.56 | |
| Week Change: 1.58% Year-to-date Change: -5.5% | |
| BOKF Links: Profile News Message Board | |
| Charts:- Daily , Weekly | |
| Add BOKF to Watchlist: View: Get Complete BOKF Trend Analysis ➞ | |
 | TMP Tompkins Financial Corporation |
| Sector: Financials | |
| SubSector: Regional - Northeast Banks | |
| MarketCap: 1144.79 Millions | |
| Recent Price: 63.51 Smart Investing & Trading Score: 40 | |
| Day Percent Change: 1.13% Day Change: 0.71 | |
| Week Change: 1.13% Year-to-date Change: -5.5% | |
| TMP Links: Profile News Message Board | |
| Charts:- Daily , Weekly | |
| Add TMP to Watchlist: View: Get Complete TMP Trend Analysis ➞ | |
 | TCBK TriCo Bancshares |
| Sector: Financials | |
| SubSector: Regional - Pacific Banks | |
| MarketCap: 875.129 Millions | |
| Recent Price: 40.95 Smart Investing & Trading Score: 53 | |
| Day Percent Change: 1.71% Day Change: 0.69 | |
| Week Change: 1.71% Year-to-date Change: -5.6% | |
| TCBK Links: Profile News Message Board | |
| Charts:- Daily , Weekly | |
| Add TCBK to Watchlist: View: Get Complete TCBK Trend Analysis ➞ | |
 | MMC Marsh & McLennan Companies, Inc. |
| Sector: Financials | |
| SubSector: Insurance Brokers | |
| MarketCap: 42821.8 Millions | |
| Recent Price: 199.08 Smart Investing & Trading Score: 18 | |
| Day Percent Change: 0.66% Day Change: 1.3 | |
| Week Change: 0.66% Year-to-date Change: -5.6% | |
| MMC Links: Profile News Message Board | |
| Charts:- Daily , Weekly | |
| Add MMC to Watchlist: View: Get Complete MMC Trend Analysis ➞ | |
 | KRC Kilroy Realty Corporation |
| Sector: Financials | |
| SubSector: REIT - Office | |
| MarketCap: 6390.46 Millions | |
| Recent Price: 37.54 Smart Investing & Trading Score: 88 | |
| Day Percent Change: 2.71% Day Change: 0.99 | |
| Week Change: 2.71% Year-to-date Change: -5.7% | |
| KRC Links: Profile News Message Board | |
| Charts:- Daily , Weekly | |
| Add KRC to Watchlist: View: Get Complete KRC Trend Analysis ➞ | |
 | FNLC The First Bancorp, Inc. |
| Sector: Financials | |
| SubSector: Regional - Northeast Banks | |
| MarketCap: 264.799 Millions | |
| Recent Price: 25.06 Smart Investing & Trading Score: 46 | |
| Day Percent Change: 1.13% Day Change: 0.28 | |
| Week Change: 1.13% Year-to-date Change: -5.7% | |
| FNLC Links: Profile News Message Board | |
| Charts:- Daily , Weekly | |
| Add FNLC to Watchlist: View: Get Complete FNLC Trend Analysis ➞ | |
 | UFCS United Fire Group, Inc. |
| Sector: Financials | |
| SubSector: Property & Casualty Insurance | |
| MarketCap: 862.812 Millions | |
| Recent Price: 26.66 Smart Investing & Trading Score: 35 | |
| Day Percent Change: 2.11% Day Change: 0.55 | |
| Week Change: 2.11% Year-to-date Change: -5.8% | |
| UFCS Links: Profile News Message Board | |
| Charts:- Daily , Weekly | |
| Add UFCS to Watchlist: View: Get Complete UFCS Trend Analysis ➞ | |
 | CWK Cushman & Wakefield plc |
| Sector: Financials | |
| SubSector: Property Management | |
| MarketCap: 2651.62 Millions | |
| Recent Price: 12.32 Smart Investing & Trading Score: 88 | |
| Day Percent Change: 3.27% Day Change: 0.39 | |
| Week Change: 3.27% Year-to-date Change: -5.8% | |
| CWK Links: Profile News Message Board | |
| Charts:- Daily , Weekly | |
| Add CWK to Watchlist: View: Get Complete CWK Trend Analysis ➞ | |
 | ARR ARMOUR Residential REIT, Inc. |
| Sector: Financials | |
| SubSector: Mortgage Investment | |
| MarketCap: 578.739 Millions | |
| Recent Price: 16.80 Smart Investing & Trading Score: 93 | |
| Day Percent Change: 2.56% Day Change: 0.42 | |
| Week Change: 2.56% Year-to-date Change: -5.8% | |
| ARR Links: Profile News Message Board | |
| Charts:- Daily , Weekly | |
| Add ARR to Watchlist: View: Get Complete ARR Trend Analysis ➞ | |
 | CFR Cullen/Frost Bankers, Inc. |
| Sector: Financials | |
| SubSector: Regional - Southwest Banks | |
| MarketCap: 3536.75 Millions | |
| Recent Price: 125.53 Smart Investing & Trading Score: 7 | |
| Day Percent Change: 1.07% Day Change: 1.33 | |
| Week Change: 1.07% Year-to-date Change: -5.8% | |
| CFR Links: Profile News Message Board | |
| Charts:- Daily , Weekly | |
| Add CFR to Watchlist: View: Get Complete CFR Trend Analysis ➞ | |
 | AGO Assured Guaranty Ltd. |
| Sector: Financials | |
| SubSector: Surety & Title Insurance | |
| MarketCap: 2133.18 Millions | |
| Recent Price: 84.34 Smart Investing & Trading Score: 77 | |
| Day Percent Change: 0.6% Day Change: 0.5 | |
| Week Change: 0.6% Year-to-date Change: -5.9% | |
| AGO Links: Profile News Message Board | |
| Charts:- Daily , Weekly | |
| Add AGO to Watchlist: View: Get Complete AGO Trend Analysis ➞ | |
 | USB U.S. Bancorp |
| Sector: Financials | |
| SubSector: Regional - Midwest Banks | |
| MarketCap: 56757.8 Millions | |
| Recent Price: 44.42 Smart Investing & Trading Score: 36 | |
| Day Percent Change: 1.09% Day Change: 0.48 | |
| Week Change: 1.09% Year-to-date Change: -6.0% | |
| USB Links: Profile News Message Board | |
| Charts:- Daily , Weekly | |
| Add USB to Watchlist: View: Get Complete USB Trend Analysis ➞ | |
 | PRK Park National Corporation |
| Sector: Financials | |
| SubSector: Regional - Midwest Banks | |
| MarketCap: 1416.6 Millions | |
| Recent Price: 160.03 Smart Investing & Trading Score: 10 | |
| Day Percent Change: 0.93% Day Change: 1.47 | |
| Week Change: 0.93% Year-to-date Change: -6.1% | |
| PRK Links: Profile News Message Board | |
| Charts:- Daily , Weekly | |
| Add PRK to Watchlist: View: Get Complete PRK Trend Analysis ➞ | |
 | BANR Banner Corporation |
| Sector: Financials | |
| SubSector: Regional - Mid-Atlantic Banks | |
| MarketCap: 1187.09 Millions | |
| Recent Price: 62.18 Smart Investing & Trading Score: 43 | |
| Day Percent Change: 1.8% Day Change: 1.1 | |
| Week Change: 1.8% Year-to-date Change: -6.2% | |
| BANR Links: Profile News Message Board | |
| Charts:- Daily , Weekly | |
| Add BANR to Watchlist: View: Get Complete BANR Trend Analysis ➞ | |
 | BANC Banc of California, Inc. |
| Sector: Financials | |
| SubSector: Regional - Pacific Banks | |
| MarketCap: 459.929 Millions | |
| Recent Price: 14.38 Smart Investing & Trading Score: 43 | |
| Day Percent Change: 1.55% Day Change: 0.22 | |
| Week Change: 1.55% Year-to-date Change: -6.3% | |
| BANC Links: Profile News Message Board | |
| Charts:- Daily , Weekly | |
| Add BANC to Watchlist: View: Get Complete BANC Trend Analysis ➞ | |
 | GDOT Green Dot Corporation |
| Sector: Financials | |
| SubSector: Credit Services | |
| MarketCap: 1320.08 Millions | |
| Recent Price: 9.97 Smart Investing & Trading Score: 48 | |
| Day Percent Change: 0.91% Day Change: 0.09 | |
| Week Change: 0.91% Year-to-date Change: -6.3% | |
| GDOT Links: Profile News Message Board | |
| Charts:- Daily , Weekly | |
| Add GDOT to Watchlist: View: Get Complete GDOT Trend Analysis ➞ | |
 | MOFG MidWestOne Financial Group, Inc. |
| Sector: Financials | |
| SubSector: Regional - Southwest Banks | |
| MarketCap: 345.265 Millions | |
| Recent Price: 27.04 Smart Investing & Trading Score: 10 | |
| Day Percent Change: 1.16% Day Change: 0.31 | |
| Week Change: 1.16% Year-to-date Change: -6.4% | |
| MOFG Links: Profile News Message Board | |
| Charts:- Daily , Weekly | |
| Add MOFG to Watchlist: View: Get Complete MOFG Trend Analysis ➞ | |
 | AROW Arrow Financial Corporation |
| Sector: Financials | |
| SubSector: Regional - Northeast Banks | |
| MarketCap: 413.999 Millions | |
| Recent Price: 26.57 Smart Investing & Trading Score: 61 | |
| Day Percent Change: 1.57% Day Change: 0.41 | |
| Week Change: 1.57% Year-to-date Change: -6.5% | |
| AROW Links: Profile News Message Board | |
| Charts:- Daily , Weekly | |
| Add AROW to Watchlist: View: Get Complete AROW Trend Analysis ➞ | |
 | TRNO Terreno Realty Corporation |
| Sector: Financials | |
| SubSector: REIT - Industrial | |
| MarketCap: 3359.69 Millions | |
| Recent Price: 54.87 Smart Investing & Trading Score: 0 | |
| Day Percent Change: 1.11% Day Change: 0.6 | |
| Week Change: 1.11% Year-to-date Change: -6.5% | |
| TRNO Links: Profile News Message Board | |
| Charts:- Daily , Weekly | |
| Add TRNO to Watchlist: View: Get Complete TRNO Trend Analysis ➞ | |
 | NFBK Northfield Bancorp, Inc. (Staten Island, NY) |
| Sector: Financials | |
| SubSector: Regional - Northeast Banks | |
| MarketCap: 540.699 Millions | |
| Recent Price: 10.74 Smart Investing & Trading Score: 32 | |
| Day Percent Change: 3.27% Day Change: 0.34 | |
| Week Change: 3.27% Year-to-date Change: -6.6% | |
| NFBK Links: Profile News Message Board | |
| Charts:- Daily , Weekly | |
| Add NFBK to Watchlist: View: Get Complete NFBK Trend Analysis ➞ | |
 | MPB Mid Penn Bancorp, Inc. |
| Sector: Financials | |
| SubSector: Regional - Northeast Banks | |
| MarketCap: 187.699 Millions | |
| Recent Price: 26.76 Smart Investing & Trading Score: 23 | |
| Day Percent Change: -1.29% Day Change: -0.35 | |
| Week Change: -1.29% Year-to-date Change: -6.6% | |
| MPB Links: Profile News Message Board | |
| Charts:- Daily , Weekly | |
| Add MPB to Watchlist: View: Get Complete MPB Trend Analysis ➞ | |
 | MFA MFA Financial, Inc. |
| Sector: Financials | |
| SubSector: Mortgage Investment | |
| MarketCap: 1869.69 Millions | |
| Recent Price: 9.19 Smart Investing & Trading Score: 35 | |
| Day Percent Change: 0.66% Day Change: 0.06 | |
| Week Change: 0.66% Year-to-date Change: -6.6% | |
| MFA Links: Profile News Message Board | |
| Charts:- Daily , Weekly | |
| Add MFA to Watchlist: View: Get Complete MFA Trend Analysis ➞ | |
| For tabular summary view of above stock list: Summary View ➞ 0 - 25 , 25 - 50 , 50 - 75 , 75 - 100 , 100 - 125 , 125 - 150 , 150 - 175 , 175 - 200 , 200 - 225 , 225 - 250 , 250 - 275 , 275 - 300 , 300 - 325 , 325 - 350 , 350 - 375 , 375 - 400 , 400 - 425 , 425 - 450 , 450 - 475 , 475 - 500 , 500 - 525 , 525 - 550 , 550 - 575 | ||
| Click To Change The Sort Order: By Market Cap or Company Size Performance: Year-to-date, Week and Day | |
| Select Chart Type: | ||
|
Best Stocks Today 12Stocks.com |
© 2025 12Stocks.com Terms & Conditions Privacy Contact Us
All Information Provided Only For Education And Not To Be Used For Investing or Trading. See Terms & Conditions


One More Thing ... Get Best Stocks Delivered Daily!
Never Ever Miss A Move With Our Top Ten Stocks Lists
Find Best Stocks In Any Market - Bull or Bear Market
Take A Peek At Our Top Ten Stocks Lists: Daily, Weekly, Year-to-Date & Top Trends
Find Best Stocks In Any Market - Bull or Bear Market
Take A Peek At Our Top Ten Stocks Lists: Daily, Weekly, Year-to-Date & Top Trends
Financial Stocks With Best Up Trends [0-bearish to 100-bullish]: Uniti [100], LendingTree [100], Mercury General[100], Perella Weinberg[100], Broadstone Net[100], LendingClub [100], TPG RE[100], CareTrust REIT[100], Stewart Information[100], Healthcare Realty[100], VICI Properties[100]
Best Financial Stocks Year-to-Date:
ESSA Bancorp[3207.77%], Easterly Government[108.45%], Mr. Cooper[86.58%], Heritage Insurance[75.29%], Root [65.29%], Industrial Logistics[64.89%], Rocket [58.42%], Diversified Healthcare[49.61%], ProAssurance [49.59%], Uniti [47.09%], SoFi Technologies[41.62%] Best Financial Stocks This Week:
Uniti [64.77%], Industrial Logistics[11.36%], LendingTree [7.32%], eXp World[7.27%], EverQuote [6.89%], Camping World[6.84%], First Foundation[6.69%], Diamond Hill[5.46%], Mercury General[5.36%], Cipher Mining[5.27%], AlTi Global[5.13%] Best Financial Stocks Daily:
Uniti [64.77%], Industrial Logistics[11.36%], LendingTree [7.32%], eXp World[7.27%], EverQuote [6.89%], Camping World[6.84%], First Foundation[6.69%], Diamond Hill[5.46%], Mercury General[5.36%], Cipher Mining[5.27%], AlTi Global[5.13%]