
 Login Sign Up


| |||||
 |  | ||||

| 12Stocks.com Market Intelligence |
Best Financial Stocks
| In a hurry? Financial Stocks Lists: Performance Trends Table, Stock Charts
Sort Financial stocks: Daily, Weekly, Year-to-Date, Market Cap & Trends. Filter Financial stocks list by size:All Financial Large Mid-Range Small & MicroCap |
| 12Stocks.com Financial Stocks Performances & Trends Daily | |||||||||
|
|  The overall Smart Investing & Trading Score is 20 (0-bearish to 100-bullish) which puts Financial sector in short term bearish trend. The Smart Investing & Trading Score from previous trading session is 30 and a deterioration of trend continues.
| ||||||||
Here are the Smart Investing & Trading Scores of the most requested Financial stocks at 12Stocks.com (click stock name for detailed review):
|


| 12Stocks.com: Investing in Financial sector with Stocks | |
|
The following table helps investors and traders sort through current performance and trends (as measured by Smart Investing & Trading Score) of various
stocks in the Financial sector. Quick View: Move mouse or cursor over stock symbol (ticker) to view short-term Technical chart and over stock name to view long term chart. Click on  to add stock symbol to your watchlist and to add stock symbol to your watchlist and  to view watchlist. Click on any ticker or stock name for detailed market intelligence report for that stock. to view watchlist. Click on any ticker or stock name for detailed market intelligence report for that stock. |
12Stocks.com Performance of Stocks in Financial Sector
| Ticker | Stock Name | Watchlist | Category | Recent Price | Trend Score | Change % | YTD Change% |
| CBSH | Commerce Bancshares |   | Banks - Regional | 58.88 | 0 | -0.79% | -3.78% |
| COLB | Columbia Banking | | Banks - Regional | 25.92 | 70 | -0.15% | -0.68% |
| LNC | Loln National | | Insurance - Life | 40.35 | 50 | 0.60% | 32.16% |
| BKI | Black Knight | | Asset Mgmt | 75.76 | 30 | 0.00% | 0.00% |
| PSLV | Sprott Physical | | Asset Mgmt | 15.76 | 70 | -1.13% | 59.84% |
| ETFC | E*TRADE | | Brokerage | 175.54 | 60 | 0.48% | 0.00% |
| AXS | Axis Capital | | Insurance - Specialty | 93.84 | 0 | -0.38% | 6.52% |
| PDI | PIMCO Dynamic | | Closed-End Fund - Debt | 19.84 | 60 | 0.00% | 17.63% |
| CTRE | CareTrust REIT | | REIT | 35.07 | 90 | -0.48% | 35.27% |
| AGNCM | AGNC | | Mortgage | 24.83 | 20 | 0.38% | 3.25% |
| STWD | Starwood Property | | REIT - Mortgage | 19.45 | 10 | -0.10% | 7.15% |
| PNFP | Pinnacle | | Banks - Regional | 92.27 | 10 | -1.11% | -18.15% |
| Y | Alleghany | | Insurance | 282.86 | 30 | 1.00% | 0.00% |
| CLNS | Colony NorthStar | | REIT - | 6.41 | 20 | 0.00% | 0.00% |
| VOYA | Voya | | Financial Conglomerates | 74.74 | 40 | 0.67% | 10.33% |
| OMF | OneMain | | Credit Services | 56.39 | 20 | 1.04% | 15.31% |
| ACGLO | Arch Capital | | Insurance | 21.93 | 70 | 0.55% | 4.60% |
| STEP | StepStone | | Asset Mgmt | 64.67 | 70 | 0.97% | 11.92% |
| BOKF | BOK | | Banks - Regional | 111.55 | 70 | 0.19% | 5.61% |
| SNV | Synovus | | Banks - Regional | 48.15 | 10 | -1.07% | -3.72% |
| FR | First Industrial | | REIT - Industrial | 51.50 | 30 | -1.09% | 5.92% |
| IREN | IREN | | Capital Markets | 47.03 | 48 | 0.62% | 363.50% |
| STAG | STAG Industrial | | REIT - Industrial | 35.90 | 90 | 0.39% | 11.52% |
| MKTX | MarketAxess | | Capital Markets | 169.54 | 0 | -0.76% | -24.19% |
| OAK | Oaktree Capital | | Asset Mgmt | 3.29 | 30 | 1.23% | 0.00% |
| For chart view version of above stock list: Chart View ➞ 0 - 25 , 25 - 50 , 50 - 75 , 75 - 100 , 100 - 125 , 125 - 150 , 150 - 175 , 175 - 200 , 200 - 225 , 225 - 250 , 250 - 275 , 275 - 300 , 300 - 325 , 325 - 350 , 350 - 375 , 375 - 400 , 400 - 425 , 425 - 450 , 450 - 475 , 475 - 500 , 500 - 525 , 525 - 550 , 550 - 575 , 575 - 600 , 600 - 625 , 625 - 650 , 650 - 675 , 675 - 700 , 700 - 725 , 725 - 750 , 750 - 775 , 775 - 800 , 800 - 825 , 825 - 850 , 850 - 875 , 875 - 900 , 900 - 925 , 925 - 950 , 950 - 975 , 975 - 1000 , 1000 - 1025 , 1025 - 1050 , 1050 - 1075 , 1075 - 1100 , 1100 - 1125 , 1125 - 1150 , 1150 - 1175 , 1175 - 1200 , 1200 - 1225 , 1225 - 1250 , 1250 - 1275 , 1275 - 1300 , 1300 - 1325 , 1325 - 1350 , 1350 - 1375 , 1375 - 1400 , 1400 - 1425 , 1425 - 1450 , 1450 - 1475 , 1475 - 1500 , 1500 - 1525 , 1525 - 1550 | ||
 | Click To Change The Sort Order: By Market Cap or Company Size Performance: Year-to-date, Week and Day |  |
|
Get the most comprehensive stock market coverage daily at 12Stocks.com ➞ Best Stocks Today ➞ Best Stocks Weekly ➞ Best Stocks Year-to-Date ➞ Best Stocks Trends ➞  Best Stocks Today 12Stocks.com Best Nasdaq Stocks ➞ Best S&P 500 Stocks ➞ Best Tech Stocks ➞ Best Biotech Stocks ➞ |
| Detailed Overview of Financial Stocks |
| Financial Technical Overview, Leaders & Laggards, Top Financial ETF Funds & Detailed Financial Stocks List, Charts, Trends & More |
| Financial Sector: Technical Analysis, Trends & YTD Performance | |
| Financial sector is composed of stocks
from banks, brokers, insurance, REITs
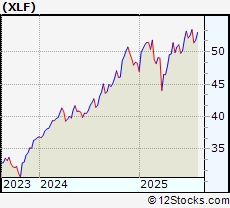
and services subsectors. Financial sector, as represented by XLF, an exchange-traded fund [ETF] that holds basket of Financial stocks (e.g, Bank of America, Goldman Sachs) is up by 11.4442% and is currently underperforming the overall market by -3.3137% year-to-date. Below is a quick view of Technical charts and trends: |
|
 XLF Weekly Chart |
|
| Long Term Trend: Good | |
| Medium Term Trend: Not Good | |
 XLF Daily Chart |
|
| Short Term Trend: Not Good | |
| Overall Trend Score: 20 | |
| YTD Performance: 11.4442% | |
| **Trend Scores & Views Are Only For Educational Purposes And Not For Investing | |
| 12Stocks.com: Top Performing Financial Sector Stocks | |||||||||||||||||||||||||||||||||||||||||||||||
 The top performing Financial sector stocks year to date are
Now, more recently, over last week, the top performing Financial sector stocks on the move are


|
|||||||||||||||||||||||||||||||||||||||||||||||
| 12Stocks.com: Investing in Financial Sector using Exchange Traded Funds | |
|
The following table shows list of key exchange traded funds (ETF) that
help investors track Financial Index. For detailed view, check out our ETF Funds section of our website. Quick View: Move mouse or cursor over ETF symbol (ticker) to view short-term Technical chart and over ETF name to view long term chart. Click on ticker or stock name for detailed view. Click on to add stock symbol to your watchlist and to view watchlist. |
12Stocks.com List of ETFs that track Financial Index
| Ticker | ETF Name | Watchlist | Recent Price | Smart Investing & Trading Score | Change % | Week % | Year-to-date % |
| CHIX | China Financials | | 10.57 | 20 | 0 | 0 | 0% |
| 12Stocks.com: Charts, Trends, Fundamental Data and Performances of Financial Stocks | |
|
We now take in-depth look at all Financial stocks including charts, multi-period performances and overall trends (as measured by Smart Investing & Trading Score). One can sort Financial stocks (click link to choose) by Daily, Weekly and by Year-to-Date performances. Also, one can sort by size of the company or by market capitalization. |
| Select Your Default Chart Type: | |||||
| |||||
| Click on stock symbol or name for detailed view. Click on to add stock symbol to your watchlist and to view watchlist. Quick View: Move mouse or cursor over "Daily" to quickly view daily Technical stock chart and over "Weekly" to view weekly Technical stock chart. | |||||

 | CBSH Commerce Bancshares, Inc |
| Sector: Financials | |
| SubSector: Banks - Regional | |
| MarketCap: 8083.73 Millions | |
| Recent Price: 58.88 Smart Investing & Trading Score: 0 | |
| Day Percent Change: -0.791912% Day Change: -0.47 | |
| Week Change: -0.20339% Year-to-date Change: -3.8% | |
| CBSH Links: Profile News Message Board | |
| Charts:- Daily , Weekly | |
| Add CBSH to Watchlist: View: Get Complete CBSH Trend Analysis ➞ | |
 | COLB Columbia Banking System, Inc |
| Sector: Financials | |
| SubSector: Banks - Regional | |
| MarketCap: 8047.71 Millions | |
| Recent Price: 25.92 Smart Investing & Trading Score: 70 | |
| Day Percent Change: -0.154083% Day Change: 0.02 | |
| Week Change: -0.879541% Year-to-date Change: -0.7% | |
| COLB Links: Profile News Message Board | |
| Charts:- Daily , Weekly | |
| Add COLB to Watchlist: View: Get Complete COLB Trend Analysis ➞ | |
 | LNC Lincoln National Corp |
| Sector: Financials | |
| SubSector: Insurance - Life | |
| MarketCap: 7983.23 Millions | |
| Recent Price: 40.35 Smart Investing & Trading Score: 50 | |
| Day Percent Change: 0.598355% Day Change: 0.33 | |
| Week Change: -1.00589% Year-to-date Change: 32.2% | |
| LNC Links: Profile News Message Board | |
| Charts:- Daily , Weekly | |
| Add LNC to Watchlist: View: Get Complete LNC Trend Analysis ➞ | |
 | BKI Black Knight, Inc. |
| Sector: Financials | |
| SubSector: Asset Management | |
| MarketCap: 7947.63 Millions | |
| Recent Price: 75.76 Smart Investing & Trading Score: 30 | |
| Day Percent Change: 0% Day Change: -9999 | |
| Week Change: 0% Year-to-date Change: 0.0% | |
| BKI Links: Profile News Message Board | |
| Charts:- Daily , Weekly | |
| Add BKI to Watchlist: View: Get Complete BKI Trend Analysis ➞ | |
 | PSLV Sprott Physical Silver Trust |
| Sector: Financials | |
| SubSector: Asset Management | |
| MarketCap: 7808.02 Millions | |
| Recent Price: 15.76 Smart Investing & Trading Score: 70 | |
| Day Percent Change: -1.12923% Day Change: -0.46 | |
| Week Change: 7.35695% Year-to-date Change: 59.8% | |
| PSLV Links: Profile News Message Board | |
| Charts:- Daily , Weekly | |
| Add PSLV to Watchlist: View: Get Complete PSLV Trend Analysis ➞ | |
 | ETFC E*TRADE Financial Corporation |
| Sector: Financials | |
| SubSector: Investment Brokerage - National | |
| MarketCap: 7673.65 Millions | |
| Recent Price: 175.54 Smart Investing & Trading Score: 60 | |
| Day Percent Change: 0.475073% Day Change: -9999 | |
| Week Change: 15.4792% Year-to-date Change: 0.0% | |
| ETFC Links: Profile News Message Board | |
| Charts:- Daily , Weekly | |
| Add ETFC to Watchlist: View: Get Complete ETFC Trend Analysis ➞ | |
 | AXS Axis Capital Holdings Ltd |
| Sector: Financials | |
| SubSector: Insurance - Specialty | |
| MarketCap: 7616.49 Millions | |
| Recent Price: 93.84 Smart Investing & Trading Score: 0 | |
| Day Percent Change: -0.382166% Day Change: -0.13 | |
| Week Change: -2.82696% Year-to-date Change: 6.5% | |
| AXS Links: Profile News Message Board | |
| Charts:- Daily , Weekly | |
| Add AXS to Watchlist: View: Get Complete AXS Trend Analysis ➞ | |
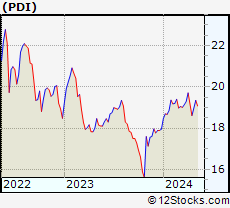 | PDI PIMCO Dynamic Income Fund |
| Sector: Financials | |
| SubSector: Closed-End Fund - Debt | |
| MarketCap: 7581.8 Millions | |
| Recent Price: 19.84 Smart Investing & Trading Score: 60 | |
| Day Percent Change: 0% Day Change: 0.07 | |
| Week Change: 0.506586% Year-to-date Change: 17.6% | |
| PDI Links: Profile News Message Board | |
| Charts:- Daily , Weekly | |
| Add PDI to Watchlist: View: Get Complete PDI Trend Analysis ➞ | |
 | CTRE CareTrust REIT Inc |
| Sector: Financials | |
| SubSector: REIT - Healthcare Facilities | |
| MarketCap: 7578.81 Millions | |
| Recent Price: 35.07 Smart Investing & Trading Score: 90 | |
| Day Percent Change: -0.482406% Day Change: 0.23 | |
| Week Change: 2.30455% Year-to-date Change: 35.3% | |
| CTRE Links: Profile News Message Board | |
| Charts:- Daily , Weekly | |
| Add CTRE to Watchlist: View: Get Complete CTRE Trend Analysis ➞ | |
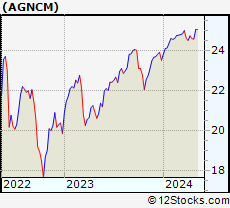 | AGNCM AGNC Investment Corp. |
| Sector: Financials | |
| SubSector: Mortgage Investment | |
| MarketCap: 7568.89 Millions | |
| Recent Price: 24.83 Smart Investing & Trading Score: 20 | |
| Day Percent Change: 0.383185% Day Change: -0.06 | |
| Week Change: -1.05657% Year-to-date Change: 3.3% | |
| AGNCM Links: Profile News Message Board | |
| Charts:- Daily , Weekly | |
| Add AGNCM to Watchlist: View: Get Complete AGNCM Trend Analysis ➞ | |
 | STWD Starwood Property Trust Inc |
| Sector: Financials | |
| SubSector: REIT - Mortgage | |
| MarketCap: 7563.06 Millions | |
| Recent Price: 19.45 Smart Investing & Trading Score: 10 | |
| Day Percent Change: -0.102722% Day Change: 0 | |
| Week Change: -2.60391% Year-to-date Change: 7.2% | |
| STWD Links: Profile News Message Board | |
| Charts:- Daily , Weekly | |
| Add STWD to Watchlist: View: Get Complete STWD Trend Analysis ➞ | |
 | PNFP Pinnacle Financial Partners Inc |
| Sector: Financials | |
| SubSector: Banks - Regional | |
| MarketCap: 7552.4 Millions | |
| Recent Price: 92.27 Smart Investing & Trading Score: 10 | |
| Day Percent Change: -1.11456% Day Change: -1.12 | |
| Week Change: -2.96561% Year-to-date Change: -18.1% | |
| PNFP Links: Profile News Message Board | |
| Charts:- Daily , Weekly | |
| Add PNFP to Watchlist: View: Get Complete PNFP Trend Analysis ➞ | |
 | Y Alleghany Corporation |
| Sector: Financials | |
| SubSector: Property & Casualty Insurance | |
| MarketCap: 7431.92 Millions | |
| Recent Price: 282.86 Smart Investing & Trading Score: 30 | |
| Day Percent Change: 1.00339% Day Change: -9999 | |
| Week Change: -66.6356% Year-to-date Change: 0.0% | |
| Y Links: Profile News Message Board | |
| Charts:- Daily , Weekly | |
| Add Y to Watchlist: View: Get Complete Y Trend Analysis ➞ | |
 | CLNS Colony NorthStar, Inc. |
| Sector: Financials | |
| SubSector: REIT - Diversified | |
| MarketCap: 7408.91 Millions | |
| Recent Price: 6.41 Smart Investing & Trading Score: 20 | |
| Day Percent Change: 0% Day Change: -9999 | |
| Week Change: 0% Year-to-date Change: 0.0% | |
| CLNS Links: Profile News Message Board | |
| Charts:- Daily , Weekly | |
| Add CLNS to Watchlist: View: Get Complete CLNS Trend Analysis ➞ | |
 | VOYA Voya Financial Inc |
| Sector: Financials | |
| SubSector: Financial Conglomerates | |
| MarketCap: 7375.96 Millions | |
| Recent Price: 74.74 Smart Investing & Trading Score: 40 | |
| Day Percent Change: 0.673491% Day Change: 0.56 | |
| Week Change: -1.17678% Year-to-date Change: 10.3% | |
| VOYA Links: Profile News Message Board | |
| Charts:- Daily , Weekly | |
| Add VOYA to Watchlist: View: Get Complete VOYA Trend Analysis ➞ | |
 | OMF OneMain Holdings Inc |
| Sector: Financials | |
| SubSector: Credit Services | |
| MarketCap: 7310.53 Millions | |
| Recent Price: 56.39 Smart Investing & Trading Score: 20 | |
| Day Percent Change: 1.03924% Day Change: 0.69 | |
| Week Change: -6.21986% Year-to-date Change: 15.3% | |
| OMF Links: Profile News Message Board | |
| Charts:- Daily , Weekly | |
| Add OMF to Watchlist: View: Get Complete OMF Trend Analysis ➞ | |
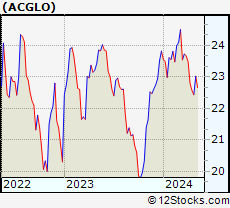 | ACGLO Arch Capital Group Ltd. |
| Sector: Financials | |
| SubSector: Insurance Brokers | |
| MarketCap: 7204.57 Millions | |
| Recent Price: 21.93 Smart Investing & Trading Score: 70 | |
| Day Percent Change: 0.550206% Day Change: -0.04 | |
| Week Change: 0.873965% Year-to-date Change: 4.6% | |
| ACGLO Links: Profile News Message Board | |
| Charts:- Daily , Weekly | |
| Add ACGLO to Watchlist: View: Get Complete ACGLO Trend Analysis ➞ | |
 | STEP StepStone Group Inc |
| Sector: Financials | |
| SubSector: Asset Management | |
| MarketCap: 7189.68 Millions | |
| Recent Price: 64.67 Smart Investing & Trading Score: 70 | |
| Day Percent Change: 0.967994% Day Change: 0.14 | |
| Week Change: -0.858501% Year-to-date Change: 11.9% | |
| STEP Links: Profile News Message Board | |
| Charts:- Daily , Weekly | |
| Add STEP to Watchlist: View: Get Complete STEP Trend Analysis ➞ | |
 | BOKF BOK Financial Corp |
| Sector: Financials | |
| SubSector: Banks - Regional | |
| MarketCap: 7176.6 Millions | |
| Recent Price: 111.55 Smart Investing & Trading Score: 70 | |
| Day Percent Change: 0.188611% Day Change: 0.38 | |
| Week Change: -0.419568% Year-to-date Change: 5.6% | |
| BOKF Links: Profile News Message Board | |
| Charts:- Daily , Weekly | |
| Add BOKF to Watchlist: View: Get Complete BOKF Trend Analysis ➞ | |
 | SNV Synovus Financial Corp |
| Sector: Financials | |
| SubSector: Banks - Regional | |
| MarketCap: 7145.64 Millions | |
| Recent Price: 48.15 Smart Investing & Trading Score: 10 | |
| Day Percent Change: -1.06842% Day Change: -0.48 | |
| Week Change: -2.90381% Year-to-date Change: -3.7% | |
| SNV Links: Profile News Message Board | |
| Charts:- Daily , Weekly | |
| Add SNV to Watchlist: View: Get Complete SNV Trend Analysis ➞ | |
 | FR First Industrial Realty Trust, Inc |
| Sector: Financials | |
| SubSector: REIT - Industrial | |
| MarketCap: 7132.63 Millions | |
| Recent Price: 51.50 Smart Investing & Trading Score: 30 | |
| Day Percent Change: -1.09468% Day Change: -0.54 | |
| Week Change: 0.723646% Year-to-date Change: 5.9% | |
| FR Links: Profile News Message Board | |
| Charts:- Daily , Weekly | |
| Add FR to Watchlist: View: Get Complete FR Trend Analysis ➞ | |
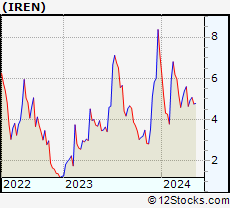 | IREN IREN Ltd |
| Sector: Financials | |
| SubSector: Capital Markets | |
| MarketCap: 7088.72 Millions | |
| Recent Price: 47.03 Smart Investing & Trading Score: 48 | |
| Day Percent Change: 0.62% Day Change: 0.29 | |
| Week Change: 13.16% Year-to-date Change: 363.5% | |
| IREN Links: Profile News Message Board | |
| Charts:- Daily , Weekly | |
| Add IREN to Watchlist: View: Get Complete IREN Trend Analysis ➞ | |
 | STAG STAG Industrial Inc |
| Sector: Financials | |
| SubSector: REIT - Industrial | |
| MarketCap: 7045.42 Millions | |
| Recent Price: 35.90 Smart Investing & Trading Score: 90 | |
| Day Percent Change: 0.391499% Day Change: 0.05 | |
| Week Change: 3.63741% Year-to-date Change: 11.5% | |
| STAG Links: Profile News Message Board | |
| Charts:- Daily , Weekly | |
| Add STAG to Watchlist: View: Get Complete STAG Trend Analysis ➞ | |
 | MKTX MarketAxess Holdings Inc |
| Sector: Financials | |
| SubSector: Capital Markets | |
| MarketCap: 7005.71 Millions | |
| Recent Price: 169.54 Smart Investing & Trading Score: 0 | |
| Day Percent Change: -0.760946% Day Change: -0.21 | |
| Week Change: -5.30608% Year-to-date Change: -24.2% | |
| MKTX Links: Profile News Message Board | |
| Charts:- Daily , Weekly | |
| Add MKTX to Watchlist: View: Get Complete MKTX Trend Analysis ➞ | |
 | OAK Oaktree Capital Group, LLC |
| Sector: Financials | |
| SubSector: Asset Management | |
| MarketCap: 6915.5 Millions | |
| Recent Price: 3.29 Smart Investing & Trading Score: 30 | |
| Day Percent Change: 1.23077% Day Change: -9999 | |
| Week Change: -50.3021% Year-to-date Change: 0.0% | |
| OAK Links: Profile News Message Board | |
| Charts:- Daily , Weekly | |
| Add OAK to Watchlist: View: Get Complete OAK Trend Analysis ➞ | |
| For tabular summary view of above stock list: Summary View ➞ 0 - 25 , 25 - 50 , 50 - 75 , 75 - 100 , 100 - 125 , 125 - 150 , 150 - 175 , 175 - 200 , 200 - 225 , 225 - 250 , 250 - 275 , 275 - 300 , 300 - 325 , 325 - 350 , 350 - 375 , 375 - 400 , 400 - 425 , 425 - 450 , 450 - 475 , 475 - 500 , 500 - 525 , 525 - 550 , 550 - 575 , 575 - 600 , 600 - 625 , 625 - 650 , 650 - 675 , 675 - 700 , 700 - 725 , 725 - 750 , 750 - 775 , 775 - 800 , 800 - 825 , 825 - 850 , 850 - 875 , 875 - 900 , 900 - 925 , 925 - 950 , 950 - 975 , 975 - 1000 , 1000 - 1025 , 1025 - 1050 , 1050 - 1075 , 1075 - 1100 , 1100 - 1125 , 1125 - 1150 , 1150 - 1175 , 1175 - 1200 , 1200 - 1225 , 1225 - 1250 , 1250 - 1275 , 1275 - 1300 , 1300 - 1325 , 1325 - 1350 , 1350 - 1375 , 1375 - 1400 , 1400 - 1425 , 1425 - 1450 , 1450 - 1475 , 1475 - 1500 , 1500 - 1525 , 1525 - 1550 | ||
| Click To Change The Sort Order: By Market Cap or Company Size Performance: Year-to-date, Week and Day | |
| Select Chart Type: | ||
|
Best Stocks Today 12Stocks.com |
© 2025 12Stocks.com Terms & Conditions Privacy Contact Us
All Information Provided Only For Education And Not To Be Used For Investing or Trading. See Terms & Conditions


One More Thing ... Get Best Stocks Delivered Daily!
Never Ever Miss A Move With Our Top Ten Stocks Lists
Find Best Stocks In Any Market - Bull or Bear Market
Take A Peek At Our Top Ten Stocks Lists: Daily, Weekly, Year-to-Date & Top Trends
Find Best Stocks In Any Market - Bull or Bear Market
Take A Peek At Our Top Ten Stocks Lists: Daily, Weekly, Year-to-Date & Top Trends
Financial Stocks With Best Up Trends [0-bearish to 100-bullish]: PIMCO California[100], Torchmark [100], PIMCO California[100], Triumph Bancorp[100], Cipher Mining[100], Lufax Holding[100], PIMCO Municipal[100], PIMCO Municipal[100], Front Yard[100], National General[100], Fifth Street[100]
Best Financial Stocks Year-to-Date:
Insight Select[12384.6%], Better Home[523.632%], IREN [363.5%], Global Medical[353.709%], Oxford Lane[287.756%], Robinhood Markets[269.422%], Metalpha Technology[225.664%], Cipher Mining[185.3%], Banco Santander[131.403%], Mr. Cooper[124.245%], Altisource Portfolio[121.195%] Best Financial Stocks This Week:
Colony Starwood[15929900%], Blackhawk Network[91300%], Macquarie Global[81662.9%], Credit Suisse[63241.6%], Pennsylvania Real[23823%], First Republic[22570.9%], Select ome[14000%], CorEnergy Infrastructure[6797.78%], FedNat Holding[5525%], BlackRock Municipal[5340%], BlackRock MuniYield[3379.04%] Best Financial Stocks Daily:
PIMCO California[11.9545%], Torchmark [11.8363%], PIMCO California[11.4754%], BlackRock Muni[10.8108%], Blackrock MuniYield[10.72%], Triumph Bancorp[10.2661%], Cipher Mining[9.36508%], AMBAC [8.24108%], BlackRock MuniYield[8.15348%], Summit [7.79817%], Concord Acquisition[7.63431%]