
 Login Sign Up


| |||||
 |  | ||||

| 12Stocks.com Market Intelligence |
Best Financial Stocks
| In a hurry? Financial Stocks Lists: Performance Trends Table, Stock Charts
Sort Financial stocks: Daily, Weekly, Year-to-Date, Market Cap & Trends. Filter Financial stocks list by size:All Financial Large Mid-Range Small & MicroCap |
| 12Stocks.com Financial Stocks Performances & Trends Daily | |||||||||
|
|  The overall Smart Investing & Trading Score is 33 (0-bearish to 100-bullish) which puts Financial sector in short term bearish to neutral trend. The Smart Investing & Trading Score from previous trading session is 26 and hence an improvement of trend.
| ||||||||
Here are the Smart Investing & Trading Scores of the most requested Financial stocks at 12Stocks.com (click stock name for detailed review):
|


| 12Stocks.com: Investing in Financial sector with Stocks | |
|
The following table helps investors and traders sort through current performance and trends (as measured by Smart Investing & Trading Score) of various
stocks in the Financial sector. Quick View: Move mouse or cursor over stock symbol (ticker) to view short-term Technical chart and over stock name to view long term chart. Click on  to add stock symbol to your watchlist and to add stock symbol to your watchlist and  to view watchlist. Click on any ticker or stock name for detailed market intelligence report for that stock. to view watchlist. Click on any ticker or stock name for detailed market intelligence report for that stock. |
12Stocks.com Performance of Stocks in Financial Sector
| Ticker | Stock Name | Watchlist | Category | Recent Price | Smart Investing & Trading Score | Change % | YTD Change% |
| COR | CoreSite Realty |   | REIT - Office | 293.64 | 75 | 1.83% | 30.99% |
| FCFS | FirstCash | | Credit Services | 134.75 | 95 | 2.80% | 30.49% |
| CUBI | Customers Bancorp | | Regional Banks | 62.90 | 50 | 1.13% | 29.21% |
| BWFG | Bankwell | | Regional Banks | 39.93 | 100 | 2.15% | 29.00% |
| EVER | EverQuote | | Regional Banks | 25.76 | 88 | 6.89% | 28.86% |
| CBOE | Cboe Global | | Investments | 250.87 | 100 | 1.24% | 28.78% |
| COIN | Coinbase Global | | Financial Data & Stock Exchanges | 318.17 | 26 | 1.11% | 28.14% |
| PAGS | PagSeguro Digital | | Credit Services | 8.01 | 47 | 3.35% | 27.96% |
| GS | Goldman Sachs | | Brokerage | 726.03 | 83 | 2.32% | 27.42% |
| PKST | Peakstone Realty | | REIT - | 13.85 | 83 | 1.54% | 27.41% |
| NTB | Bank of N.T. Butterfield & Son | | Foreign Banks | 45.96 | 78 | 2.77% | 27.20% |
| PGRE | Paramount | | Property Mgmt | 6.28 | 68 | 3.46% | 27.13% |
| ICE | Intercontinental Exchange | | Investments | 188.45 | 95 | 2.09% | 26.82% |
| EPR | EPR Properties | | REIT - Retail | 54.92 | 10 | -0.16% | 26.20% |
| BEN | Franklin Resources | | Asset Mgmt | 25.13 | 90 | 4.93% | 25.94% |
| NDAQ | Nasdaq | | Investments | 96.91 | 90 | 1.83% | 25.77% |
| NTRS | Northern Trust | | Asset Mgmt | 127.65 | 46 | 0.46% | 25.52% |
| GL | Globe Life | | Life Insurance | 139.34 | 68 | 1.53% | 25.47% |
| PLMR | Palomar | | Insurance | 131.53 | 35 | 1.47% | 24.57% |
| CME | CME | | Brokerage | 287.10 | 77 | 2.26% | 24.24% |
| JPM | JPMorgan Chase | | Banks | 294.26 | 60 | 1.69% | 24.15% |
| BPOP | Popular | | Foreign Banks | 115.06 | 76 | 1.65% | 23.28% |
| LNC | Loln National | | Life Insurance | 37.92 | 95 | 2.85% | 23.08% |
| CTRE | CareTrust REIT | | REIT | 32.90 | 100 | 2.84% | 23.05% |
| WPC | W. P. | | REIT - | 66.08 | 100 | 1.69% | 23.04% |
| For chart view version of above stock list: Chart View ➞ 0 - 25 , 25 - 50 , 50 - 75 , 75 - 100 , 100 - 125 , 125 - 150 , 150 - 175 , 175 - 200 , 200 - 225 , 225 - 250 , 250 - 275 , 275 - 300 , 300 - 325 , 325 - 350 , 350 - 375 , 375 - 400 , 400 - 425 , 425 - 450 , 450 - 475 , 475 - 500 , 500 - 525 , 525 - 550 , 550 - 575 | ||
 | Click To Change The Sort Order: By Market Cap or Company Size Performance: Year-to-date, Week and Day |  |
|
Get the most comprehensive stock market coverage daily at 12Stocks.com ➞ Best Stocks Today ➞ Best Stocks Weekly ➞ Best Stocks Year-to-Date ➞ Best Stocks Trends ➞  Best Stocks Today 12Stocks.com Best Nasdaq Stocks ➞ Best S&P 500 Stocks ➞ Best Tech Stocks ➞ Best Biotech Stocks ➞ |
| Detailed Overview of Financial Stocks |
| Financial Technical Overview, Leaders & Laggards, Top Financial ETF Funds & Detailed Financial Stocks List, Charts, Trends & More |
| Financial Sector: Technical Analysis, Trends & YTD Performance | |
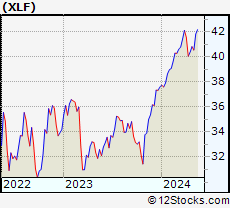
| Financial sector is composed of stocks
from banks, brokers, insurance, REITs
and services subsectors. Financial sector, as represented by XLF, an exchange-traded fund [ETF] that holds basket of Financial stocks (e.g, Bank of America, Goldman Sachs) is up by 7.8% and is currently outperforming the overall market by 0.27% year-to-date. Below is a quick view of Technical charts and trends: |
|
 XLF Weekly Chart |
|
| Long Term Trend: Good | |
| Medium Term Trend: Not Good | |
 XLF Daily Chart |
|
| Short Term Trend: Not Good | |
| Overall Trend Score: 33 | |
| YTD Performance: 7.8% | |
| **Trend Scores & Views Are Only For Educational Purposes And Not For Investing | |
| 12Stocks.com: Top Performing Financial Sector Stocks | ||||||||||||||||||||||||||||||||||||||||||||||||
 The top performing Financial sector stocks year to date are
Now, more recently, over last week, the top performing Financial sector stocks on the move are


|
||||||||||||||||||||||||||||||||||||||||||||||||
| 12Stocks.com: Investing in Financial Sector using Exchange Traded Funds | |
|
The following table shows list of key exchange traded funds (ETF) that
help investors track Financial Index. For detailed view, check out our ETF Funds section of our website. Quick View: Move mouse or cursor over ETF symbol (ticker) to view short-term Technical chart and over ETF name to view long term chart. Click on ticker or stock name for detailed view. Click on to add stock symbol to your watchlist and to view watchlist. |
12Stocks.com List of ETFs that track Financial Index
| Ticker | ETF Name | Watchlist | Recent Price | Smart Investing & Trading Score | Change % | Week % | Year-to-date % |
| XLF | Financial | | 51.91 | 33 | 0.99 | 0.99 | 7.8% |
| IAI | Broker-Dealers & Secs | | 174.97 | 63 | 2.34 | 2.34 | 21.82% |
| KBE | Bank | | 55.98 | 43 | 1.3 | 1.3 | 1.64% |
| FAS | Financial Bull 3X | | 161.82 | 33 | 2.91 | 2.91 | 7.48% |
| FAZ | Financial Bear 3X | | 4.54 | 62 | -2.78 | -2.78 | -27.4% |
| UYG | Financials | | 92.87 | 26 | 1.72 | 1.72 | 9% |
| KIE | Insurance | | 56.42 | 25 | 1.27 | 1.27 | 0.32% |
| 12Stocks.com: Charts, Trends, Fundamental Data and Performances of Financial Stocks | |
|
We now take in-depth look at all Financial stocks including charts, multi-period performances and overall trends (as measured by Smart Investing & Trading Score). One can sort Financial stocks (click link to choose) by Daily, Weekly and by Year-to-Date performances. Also, one can sort by size of the company or by market capitalization. |
| Select Your Default Chart Type: | |||||
| |||||
| Click on stock symbol or name for detailed view. Click on to add stock symbol to your watchlist and to view watchlist. Quick View: Move mouse or cursor over "Daily" to quickly view daily Technical stock chart and over "Weekly" to view weekly Technical stock chart. | |||||

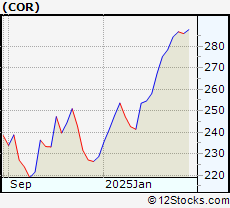 | COR CoreSite Realty Corporation |
| Sector: Financials | |
| SubSector: REIT - Office | |
| MarketCap: 4164.46 Millions | |
| Recent Price: 293.64 Smart Investing & Trading Score: 75 | |
| Day Percent Change: 1.83% Day Change: 5.29 | |
| Week Change: 1.83% Year-to-date Change: 31.0% | |
| COR Links: Profile News Message Board | |
| Charts:- Daily , Weekly | |
| Add COR to Watchlist: View: Get Complete COR Trend Analysis ➞ | |
 | FCFS FirstCash, Inc. |
| Sector: Financials | |
| SubSector: Credit Services | |
| MarketCap: 2795.48 Millions | |
| Recent Price: 134.75 Smart Investing & Trading Score: 95 | |
| Day Percent Change: 2.8% Day Change: 3.67 | |
| Week Change: 2.8% Year-to-date Change: 30.5% | |
| FCFS Links: Profile News Message Board | |
| Charts:- Daily , Weekly | |
| Add FCFS to Watchlist: View: Get Complete FCFS Trend Analysis ➞ | |
 | CUBI Customers Bancorp, Inc. |
| Sector: Financials | |
| SubSector: Regional - Northeast Banks | |
| MarketCap: 385.399 Millions | |
| Recent Price: 62.90 Smart Investing & Trading Score: 50 | |
| Day Percent Change: 1.13% Day Change: 0.7 | |
| Week Change: 1.13% Year-to-date Change: 29.2% | |
| CUBI Links: Profile News Message Board | |
| Charts:- Daily , Weekly | |
| Add CUBI to Watchlist: View: Get Complete CUBI Trend Analysis ➞ | |
 | BWFG Bankwell Financial Group, Inc. |
| Sector: Financials | |
| SubSector: Regional - Northeast Banks | |
| MarketCap: 142.899 Millions | |
| Recent Price: 39.93 Smart Investing & Trading Score: 100 | |
| Day Percent Change: 2.15% Day Change: 0.84 | |
| Week Change: 2.15% Year-to-date Change: 29.0% | |
| BWFG Links: Profile News Message Board | |
| Charts:- Daily , Weekly | |
| Add BWFG to Watchlist: View: Get Complete BWFG Trend Analysis ➞ | |
 | EVER EverQuote, Inc. |
| Sector: Financials | |
| SubSector: Regional - Southeast Banks | |
| MarketCap: 767.135 Millions | |
| Recent Price: 25.76 Smart Investing & Trading Score: 88 | |
| Day Percent Change: 6.89% Day Change: 1.66 | |
| Week Change: 6.89% Year-to-date Change: 28.9% | |
| EVER Links: Profile News Message Board | |
| Charts:- Daily , Weekly | |
| Add EVER to Watchlist: View: Get Complete EVER Trend Analysis ➞ | |
 | CBOE Cboe Global Markets, Inc. |
| Sector: Financials | |
| SubSector: Diversified Investments | |
| MarketCap: 8834.5 Millions | |
| Recent Price: 250.87 Smart Investing & Trading Score: 100 | |
| Day Percent Change: 1.24% Day Change: 3.08 | |
| Week Change: 1.24% Year-to-date Change: 28.8% | |
| CBOE Links: Profile News Message Board | |
| Charts:- Daily , Weekly | |
| Add CBOE to Watchlist: View: Get Complete CBOE Trend Analysis ➞ | |
 | COIN Coinbase Global, Inc. |
| Sector: Financials | |
| SubSector: Financial Data & Stock Exchanges | |
| MarketCap: 16390 Millions | |
| Recent Price: 318.17 Smart Investing & Trading Score: 26 | |
| Day Percent Change: 1.11% Day Change: 3.48 | |
| Week Change: 1.11% Year-to-date Change: 28.1% | |
| COIN Links: Profile News Message Board | |
| Charts:- Daily , Weekly | |
| Add COIN to Watchlist: View: Get Complete COIN Trend Analysis ➞ | |
 | PAGS PagSeguro Digital Ltd. |
| Sector: Financials | |
| SubSector: Credit Services | |
| MarketCap: 6500.78 Millions | |
| Recent Price: 8.01 Smart Investing & Trading Score: 47 | |
| Day Percent Change: 3.35% Day Change: 0.26 | |
| Week Change: 3.35% Year-to-date Change: 28.0% | |
| PAGS Links: Profile News Message Board | |
| Charts:- Daily , Weekly | |
| Add PAGS to Watchlist: View: Get Complete PAGS Trend Analysis ➞ | |
 | GS The Goldman Sachs Group, Inc. |
| Sector: Financials | |
| SubSector: Investment Brokerage - National | |
| MarketCap: 54579.3 Millions | |
| Recent Price: 726.03 Smart Investing & Trading Score: 83 | |
| Day Percent Change: 2.32% Day Change: 16.46 | |
| Week Change: 2.32% Year-to-date Change: 27.4% | |
| GS Links: Profile News Message Board | |
| Charts:- Daily , Weekly | |
| Add GS to Watchlist: View: Get Complete GS Trend Analysis ➞ | |
 | PKST Peakstone Realty Trust |
| Sector: Financials | |
| SubSector: REIT - Diversified | |
| MarketCap: 1050 Millions | |
| Recent Price: 13.85 Smart Investing & Trading Score: 83 | |
| Day Percent Change: 1.54% Day Change: 0.21 | |
| Week Change: 1.54% Year-to-date Change: 27.4% | |
| PKST Links: Profile News Message Board | |
| Charts:- Daily , Weekly | |
| Add PKST to Watchlist: View: Get Complete PKST Trend Analysis ➞ | |
 | NTB The Bank of N.T. Butterfield & Son Limited |
| Sector: Financials | |
| SubSector: Foreign Regional Banks | |
| MarketCap: 889.379 Millions | |
| Recent Price: 45.96 Smart Investing & Trading Score: 78 | |
| Day Percent Change: 2.77% Day Change: 1.24 | |
| Week Change: 2.77% Year-to-date Change: 27.2% | |
| NTB Links: Profile News Message Board | |
| Charts:- Daily , Weekly | |
| Add NTB to Watchlist: View: Get Complete NTB Trend Analysis ➞ | |
 | PGRE Paramount Group, Inc. |
| Sector: Financials | |
| SubSector: Property Management | |
| MarketCap: 1722.72 Millions | |
| Recent Price: 6.28 Smart Investing & Trading Score: 68 | |
| Day Percent Change: 3.46% Day Change: 0.21 | |
| Week Change: 3.46% Year-to-date Change: 27.1% | |
| PGRE Links: Profile News Message Board | |
| Charts:- Daily , Weekly | |
| Add PGRE to Watchlist: View: Get Complete PGRE Trend Analysis ➞ | |
 | ICE Intercontinental Exchange, Inc. |
| Sector: Financials | |
| SubSector: Diversified Investments | |
| MarketCap: 46054.6 Millions | |
| Recent Price: 188.45 Smart Investing & Trading Score: 95 | |
| Day Percent Change: 2.09% Day Change: 3.85 | |
| Week Change: 2.09% Year-to-date Change: 26.8% | |
| ICE Links: Profile News Message Board | |
| Charts:- Daily , Weekly | |
| Add ICE to Watchlist: View: Get Complete ICE Trend Analysis ➞ | |
 | EPR EPR Properties |
| Sector: Financials | |
| SubSector: REIT - Retail | |
| MarketCap: 2217.64 Millions | |
| Recent Price: 54.92 Smart Investing & Trading Score: 10 | |
| Day Percent Change: -0.16% Day Change: -0.09 | |
| Week Change: -0.16% Year-to-date Change: 26.2% | |
| EPR Links: Profile News Message Board | |
| Charts:- Daily , Weekly | |
| Add EPR to Watchlist: View: Get Complete EPR Trend Analysis ➞ | |
 | BEN Franklin Resources, Inc. |
| Sector: Financials | |
| SubSector: Asset Management | |
| MarketCap: 9419.73 Millions | |
| Recent Price: 25.13 Smart Investing & Trading Score: 90 | |
| Day Percent Change: 4.93% Day Change: 1.18 | |
| Week Change: 4.93% Year-to-date Change: 25.9% | |
| BEN Links: Profile News Message Board | |
| Charts:- Daily , Weekly | |
| Add BEN to Watchlist: View: Get Complete BEN Trend Analysis ➞ | |
 | NDAQ Nasdaq, Inc. |
| Sector: Financials | |
| SubSector: Diversified Investments | |
| MarketCap: 14885.2 Millions | |
| Recent Price: 96.91 Smart Investing & Trading Score: 90 | |
| Day Percent Change: 1.83% Day Change: 1.74 | |
| Week Change: 1.83% Year-to-date Change: 25.8% | |
| NDAQ Links: Profile News Message Board | |
| Charts:- Daily , Weekly | |
| Add NDAQ to Watchlist: View: Get Complete NDAQ Trend Analysis ➞ | |
 | NTRS Northern Trust Corporation |
| Sector: Financials | |
| SubSector: Asset Management | |
| MarketCap: 15316.8 Millions | |
| Recent Price: 127.65 Smart Investing & Trading Score: 46 | |
| Day Percent Change: 0.46% Day Change: 0.59 | |
| Week Change: 0.46% Year-to-date Change: 25.5% | |
| NTRS Links: Profile News Message Board | |
| Charts:- Daily , Weekly | |
| Add NTRS to Watchlist: View: Get Complete NTRS Trend Analysis ➞ | |
 | GL Globe Life Inc. |
| Sector: Financials | |
| SubSector: Life Insurance | |
| MarketCap: 7596.46 Millions | |
| Recent Price: 139.34 Smart Investing & Trading Score: 68 | |
| Day Percent Change: 1.53% Day Change: 2.1 | |
| Week Change: 1.53% Year-to-date Change: 25.5% | |
| GL Links: Profile News Message Board | |
| Charts:- Daily , Weekly | |
| Add GL to Watchlist: View: Get Complete GL Trend Analysis ➞ | |
 | PLMR Palomar Holdings, Inc. |
| Sector: Financials | |
| SubSector: Property & Casualty Insurance | |
| MarketCap: 1297.42 Millions | |
| Recent Price: 131.53 Smart Investing & Trading Score: 35 | |
| Day Percent Change: 1.47% Day Change: 1.91 | |
| Week Change: 1.47% Year-to-date Change: 24.6% | |
| PLMR Links: Profile News Message Board | |
| Charts:- Daily , Weekly | |
| Add PLMR to Watchlist: View: Get Complete PLMR Trend Analysis ➞ | |
 | CME CME Group Inc. |
| Sector: Financials | |
| SubSector: Investment Brokerage - National | |
| MarketCap: 64145 Millions | |
| Recent Price: 287.10 Smart Investing & Trading Score: 77 | |
| Day Percent Change: 2.26% Day Change: 6.34 | |
| Week Change: 2.26% Year-to-date Change: 24.2% | |
| CME Links: Profile News Message Board | |
| Charts:- Daily , Weekly | |
| Add CME to Watchlist: View: Get Complete CME Trend Analysis ➞ | |
 | JPM JPMorgan Chase & Co. |
| Sector: Financials | |
| SubSector: Money Center Banks | |
| MarketCap: 279736 Millions | |
| Recent Price: 294.26 Smart Investing & Trading Score: 60 | |
| Day Percent Change: 1.69% Day Change: 4.89 | |
| Week Change: 1.69% Year-to-date Change: 24.2% | |
| JPM Links: Profile News Message Board | |
| Charts:- Daily , Weekly | |
| Add JPM to Watchlist: View: Get Complete JPM Trend Analysis ➞ | |
 | BPOP Popular, Inc. |
| Sector: Financials | |
| SubSector: Foreign Regional Banks | |
| MarketCap: 2671.99 Millions | |
| Recent Price: 115.06 Smart Investing & Trading Score: 76 | |
| Day Percent Change: 1.65% Day Change: 1.87 | |
| Week Change: 1.65% Year-to-date Change: 23.3% | |
| BPOP Links: Profile News Message Board | |
| Charts:- Daily , Weekly | |
| Add BPOP to Watchlist: View: Get Complete BPOP Trend Analysis ➞ | |
 | LNC Lincoln National Corporation |
| Sector: Financials | |
| SubSector: Life Insurance | |
| MarketCap: 4545.26 Millions | |
| Recent Price: 37.92 Smart Investing & Trading Score: 95 | |
| Day Percent Change: 2.85% Day Change: 1.05 | |
| Week Change: 2.85% Year-to-date Change: 23.1% | |
| LNC Links: Profile News Message Board | |
| Charts:- Daily , Weekly | |
| Add LNC to Watchlist: View: Get Complete LNC Trend Analysis ➞ | |
 | CTRE CareTrust REIT, Inc. |
| Sector: Financials | |
| SubSector: REIT - Healthcare Facilities | |
| MarketCap: 1507.94 Millions | |
| Recent Price: 32.90 Smart Investing & Trading Score: 100 | |
| Day Percent Change: 2.84% Day Change: 0.91 | |
| Week Change: 2.84% Year-to-date Change: 23.1% | |
| CTRE Links: Profile News Message Board | |
| Charts:- Daily , Weekly | |
| Add CTRE to Watchlist: View: Get Complete CTRE Trend Analysis ➞ | |
 | WPC W. P. Carey Inc. |
| Sector: Financials | |
| SubSector: REIT - Diversified | |
| MarketCap: 9560.03 Millions | |
| Recent Price: 66.08 Smart Investing & Trading Score: 100 | |
| Day Percent Change: 1.69% Day Change: 1.1 | |
| Week Change: 1.69% Year-to-date Change: 23.0% | |
| WPC Links: Profile News Message Board | |
| Charts:- Daily , Weekly | |
| Add WPC to Watchlist: View: Get Complete WPC Trend Analysis ➞ | |
| For tabular summary view of above stock list: Summary View ➞ 0 - 25 , 25 - 50 , 50 - 75 , 75 - 100 , 100 - 125 , 125 - 150 , 150 - 175 , 175 - 200 , 200 - 225 , 225 - 250 , 250 - 275 , 275 - 300 , 300 - 325 , 325 - 350 , 350 - 375 , 375 - 400 , 400 - 425 , 425 - 450 , 450 - 475 , 475 - 500 , 500 - 525 , 525 - 550 , 550 - 575 | ||
| Click To Change The Sort Order: By Market Cap or Company Size Performance: Year-to-date, Week and Day | |
| Select Chart Type: | ||
|
Best Stocks Today 12Stocks.com |
© 2025 12Stocks.com Terms & Conditions Privacy Contact Us
All Information Provided Only For Education And Not To Be Used For Investing or Trading. See Terms & Conditions


One More Thing ... Get Best Stocks Delivered Daily!
Never Ever Miss A Move With Our Top Ten Stocks Lists
Find Best Stocks In Any Market - Bull or Bear Market
Take A Peek At Our Top Ten Stocks Lists: Daily, Weekly, Year-to-Date & Top Trends
Find Best Stocks In Any Market - Bull or Bear Market
Take A Peek At Our Top Ten Stocks Lists: Daily, Weekly, Year-to-Date & Top Trends
Financial Stocks With Best Up Trends [0-bearish to 100-bullish]: Uniti [100], LendingTree [100], Mercury General[100], Perella Weinberg[100], Broadstone Net[100], LendingClub [100], TPG RE[100], CareTrust REIT[100], Stewart Information[100], Healthcare Realty[100], VICI Properties[100]
Best Financial Stocks Year-to-Date:
ESSA Bancorp[3207.77%], Easterly Government[108.45%], Mr. Cooper[86.58%], Heritage Insurance[75.29%], Root [65.29%], Industrial Logistics[64.89%], Rocket [58.42%], Diversified Healthcare[49.61%], ProAssurance [49.59%], Uniti [47.09%], SoFi Technologies[41.62%] Best Financial Stocks This Week:
Uniti [64.77%], Industrial Logistics[11.36%], LendingTree [7.32%], eXp World[7.27%], EverQuote [6.89%], Camping World[6.84%], First Foundation[6.69%], Diamond Hill[5.46%], Mercury General[5.36%], Cipher Mining[5.27%], AlTi Global[5.13%] Best Financial Stocks Daily:
Uniti [64.77%], Industrial Logistics[11.36%], LendingTree [7.32%], eXp World[7.27%], EverQuote [6.89%], Camping World[6.84%], First Foundation[6.69%], Diamond Hill[5.46%], Mercury General[5.36%], Cipher Mining[5.27%], AlTi Global[5.13%]