
 Login Sign Up


| |||||
 |  | ||||

| 12Stocks.com Market Intelligence |
Best Financial Stocks
| In a hurry? Financial Stocks Lists: Performance Trends Table, Stock Charts
Sort Financial stocks: Daily, Weekly, Year-to-Date, Market Cap & Trends. Filter Financial stocks list by size:All Financial Large Mid-Range Small & MicroCap |
| 12Stocks.com Financial Stocks Performances & Trends Daily | |||||||||
|
|  The overall Smart Investing & Trading Score is 90 (0-bearish to 100-bullish) which puts Financial sector in short term bullish trend. The Smart Investing & Trading Score from previous trading session is 60 and an improvement of trend continues.
| ||||||||
Here are the Smart Investing & Trading Scores of the most requested Financial stocks at 12Stocks.com (click stock name for detailed review):
|


| 12Stocks.com: Investing in Financial sector with Stocks | |
|
The following table helps investors and traders sort through current performance and trends (as measured by Smart Investing & Trading Score) of various
stocks in the Financial sector. Quick View: Move mouse or cursor over stock symbol (ticker) to view short-term Technical chart and over stock name to view long term chart. Click on  to add stock symbol to your watchlist and to add stock symbol to your watchlist and  to view watchlist. Click on any ticker or stock name for detailed market intelligence report for that stock. to view watchlist. Click on any ticker or stock name for detailed market intelligence report for that stock. |
12Stocks.com Performance of Stocks in Financial Sector
| Ticker | Stock Name | Watchlist | Category | Recent Price | Trend Score | Change % | YTD Change% |
| CB | Chubb |   | Insurance - Property & Casualty | 274.28 | 50 | 0.75% | 1.30% |
| PLD | Prologis | | REIT - Industrial | 115.16 | 100 | 1.12% | 12.50% |
| BBVA | Banco Bilbao | | Banks - | 19.12 | 50 | 0.58% | 109.28% |
| SMFG | Sumitomo Mitsui | | Banks - | 16.72 | 80 | 0.66% | 17.99% |
| MMC | Marsh & McLennan Cos | | Insurance | 196.15 | 0 | -0.63% | -6.13% |
| ICE | Intercontinental Exchange | | Financial Data & Stock Exchanges | 171.13 | 0 | -0.65% | 15.22% |
| CME | CME | | Financial Data & Stock Exchanges | 260.59 | 20 | -0.69% | 13.04% |
| MTU | Mitsubishi UFJ | | Banks | 6.64 | 10 | 0.00% | 0.00% |
| BAM | Brookfield Asset | | Asset Mgmt | 59.87 | 70 | 2.03% | 11.92% |
| AMT | American Tower | | REIT - Specialty | 193.03 | 20 | -2.12% | 8.35% |
| LFC | China Life | | Life Insurance | 43.74 | 80 | -0.36% | 0.00% |
| BMO | Bank of Montreal | | Banks - | 129.39 | 70 | -0.26% | 37.85% |
| HOOD | Robinhood Markets | | Capital Markets | 120.91 | 100 | 1.91% | 206.57% |
| MCO | Moody's Corp | | Financial Data & Stock Exchanges | 482.32 | 0 | -5.75% | 2.39% |
| MFG | Mizuho | | Banks - Regional | 6.58 | 40 | 0.30% | 37.05% |
| PNC | PNC | | Banks - Regional | 206.27 | 80 | 1.23% | 10.75% |
| AON | Aon | | Insurance | 352.76 | 0 | -1.46% | -0.03% |
| BNS | Bank Of | | Banks - | 64.64 | 90 | 0.00% | 25.97% |
| COIN | Coinbase Global | | Financial Data & Stock Exchanges | 342.79 | 90 | 6.93% | 33.27% |
| AJG | Arthur J. | | Insurance | 296.74 | 50 | 1.39% | 7.98% |
| USB | U.S. Bancorp | | Banks - Regional | 50.21 | 100 | 1.21% | 7.34% |
| EQIX | Equinix | | REIT - Specialty | 785.30 | 30 | 0.84% | -15.95% |
| APO | Apollo Global | | Asset Mgmt | 143.49 | 80 | 3.36% | -12.93% |
| CM | Canadian Imperial | | Banks - | 80.44 | 90 | 0.25% | 31.01% |
| BK | Bank Of | | Banks - | 108.52 | 100 | 1.41% | 42.62% |
| For chart view version of above stock list: Chart View ➞ 0 - 25 , 25 - 50 , 50 - 75 , 75 - 100 , 100 - 125 , 125 - 150 , 150 - 175 , 175 - 200 , 200 - 225 , 225 - 250 , 250 - 275 , 275 - 300 , 300 - 325 , 325 - 350 , 350 - 375 , 375 - 400 , 400 - 425 , 425 - 450 , 450 - 475 , 475 - 500 , 500 - 525 , 525 - 550 , 550 - 575 , 575 - 600 , 600 - 625 , 625 - 650 , 650 - 675 , 675 - 700 , 700 - 725 , 725 - 750 , 750 - 775 , 775 - 800 , 800 - 825 , 825 - 850 , 850 - 875 , 875 - 900 , 900 - 925 , 925 - 950 , 950 - 975 , 975 - 1000 , 1000 - 1025 , 1025 - 1050 , 1050 - 1075 , 1075 - 1100 , 1100 - 1125 , 1125 - 1150 , 1150 - 1175 , 1175 - 1200 , 1200 - 1225 , 1225 - 1250 , 1250 - 1275 , 1275 - 1300 , 1300 - 1325 , 1325 - 1350 , 1350 - 1375 , 1375 - 1400 , 1400 - 1425 , 1425 - 1450 , 1450 - 1475 , 1475 - 1500 , 1500 - 1525 , 1525 - 1550 | ||
 | Click To Change The Sort Order: By Market Cap or Company Size Performance: Year-to-date, Week and Day |  |
|
Get the most comprehensive stock market coverage daily at 12Stocks.com ➞ Best Stocks Today ➞ Best Stocks Weekly ➞ Best Stocks Year-to-Date ➞ Best Stocks Trends ➞  Best Stocks Today 12Stocks.com Best Nasdaq Stocks ➞ Best S&P 500 Stocks ➞ Best Tech Stocks ➞ Best Biotech Stocks ➞ |
| Detailed Overview of Financial Stocks |
| Financial Technical Overview, Leaders & Laggards, Top Financial ETF Funds & Detailed Financial Stocks List, Charts, Trends & More |
| Financial Sector: Technical Analysis, Trends & YTD Performance | |
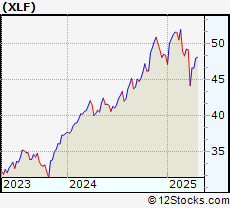
| Financial sector is composed of stocks
from banks, brokers, insurance, REITs
and services subsectors. Financial sector, as represented by XLF, an exchange-traded fund [ETF] that holds basket of Financial stocks (e.g, Bank of America, Goldman Sachs) is up by 13.0735% and is currently underperforming the overall market by -0.7866% year-to-date. Below is a quick view of Technical charts and trends: |
|
 XLF Weekly Chart |
|
| Long Term Trend: Good | |
| Medium Term Trend: Good | |
 XLF Daily Chart |
|
| Short Term Trend: Very Good | |
| Overall Trend Score: 90 | |
| YTD Performance: 13.0735% | |
| **Trend Scores & Views Are Only For Educational Purposes And Not For Investing | |
| 12Stocks.com: Top Performing Financial Sector Stocks | |||||||||||||||||||||||||||||||||||||||||||||||
 The top performing Financial sector stocks year to date are
Now, more recently, over last week, the top performing Financial sector stocks on the move are


|
|||||||||||||||||||||||||||||||||||||||||||||||
| 12Stocks.com: Investing in Financial Sector using Exchange Traded Funds | |
|
The following table shows list of key exchange traded funds (ETF) that
help investors track Financial Index. For detailed view, check out our ETF Funds section of our website. Quick View: Move mouse or cursor over ETF symbol (ticker) to view short-term Technical chart and over ETF name to view long term chart. Click on ticker or stock name for detailed view. Click on to add stock symbol to your watchlist and to view watchlist. |
12Stocks.com List of ETFs that track Financial Index
| Ticker | ETF Name | Watchlist | Recent Price | Smart Investing & Trading Score | Change % | Week % | Year-to-date % |
| CHIX | China Financials | | 10.57 | 20 | 0 | 0 | 0% |
| 12Stocks.com: Charts, Trends, Fundamental Data and Performances of Financial Stocks | |
|
We now take in-depth look at all Financial stocks including charts, multi-period performances and overall trends (as measured by Smart Investing & Trading Score). One can sort Financial stocks (click link to choose) by Daily, Weekly and by Year-to-Date performances. Also, one can sort by size of the company or by market capitalization. |
| Select Your Default Chart Type: | |||||
| |||||
| Click on stock symbol or name for detailed view. Click on to add stock symbol to your watchlist and to view watchlist. Quick View: Move mouse or cursor over "Daily" to quickly view daily Technical stock chart and over "Weekly" to view weekly Technical stock chart. | |||||

 | CB Chubb Limited |
| Sector: Financials | |
| SubSector: Insurance - Property & Casualty | |
| MarketCap: 110589 Millions | |
| Recent Price: 274.28 Smart Investing & Trading Score: 50 | |
| Day Percent Change: 0.745638% Day Change: 2.16 | |
| Week Change: -1.14255% Year-to-date Change: 1.3% | |
| CB Links: Profile News Message Board | |
| Charts:- Daily , Weekly | |
| Add CB to Watchlist: View: Get Complete CB Trend Analysis ➞ | |
 | PLD Prologis Inc |
| Sector: Financials | |
| SubSector: REIT - Industrial | |
| MarketCap: 108028 Millions | |
| Recent Price: 115.16 Smart Investing & Trading Score: 100 | |
| Day Percent Change: 1.11511% Day Change: 1.64 | |
| Week Change: 3.76644% Year-to-date Change: 12.5% | |
| PLD Links: Profile News Message Board | |
| Charts:- Daily , Weekly | |
| Add PLD to Watchlist: View: Get Complete PLD Trend Analysis ➞ | |
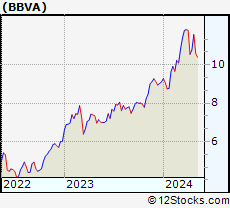 | BBVA Banco Bilbao Vizcaya Argentaria S.A. ADR |
| Sector: Financials | |
| SubSector: Banks - Diversified | |
| MarketCap: 105322 Millions | |
| Recent Price: 19.12 Smart Investing & Trading Score: 50 | |
| Day Percent Change: 0.578643% Day Change: 0.09 | |
| Week Change: 1.21758% Year-to-date Change: 109.3% | |
| BBVA Links: Profile News Message Board | |
| Charts:- Daily , Weekly | |
| Add BBVA to Watchlist: View: Get Complete BBVA Trend Analysis ➞ | |
 | SMFG Sumitomo Mitsui Financial Group Inc ADR |
| Sector: Financials | |
| SubSector: Banks - Diversified | |
| MarketCap: 104905 Millions | |
| Recent Price: 16.72 Smart Investing & Trading Score: 80 | |
| Day Percent Change: 0.662252% Day Change: -0.16 | |
| Week Change: -0.712589% Year-to-date Change: 18.0% | |
| SMFG Links: Profile News Message Board | |
| Charts:- Daily , Weekly | |
| Add SMFG to Watchlist: View: Get Complete SMFG Trend Analysis ➞ | |
 | MMC Marsh & McLennan Cos., Inc |
| Sector: Financials | |
| SubSector: Insurance Brokers | |
| MarketCap: 100163 Millions | |
| Recent Price: 196.15 Smart Investing & Trading Score: 0 | |
| Day Percent Change: -0.633232% Day Change: -0.26 | |
| Week Change: -1.31811% Year-to-date Change: -6.1% | |
| MMC Links: Profile News Message Board | |
| Charts:- Daily , Weekly | |
| Add MMC to Watchlist: View: Get Complete MMC Trend Analysis ➞ | |
 | ICE Intercontinental Exchange Inc |
| Sector: Financials | |
| SubSector: Financial Data & Stock Exchanges | |
| MarketCap: 99756.2 Millions | |
| Recent Price: 171.13 Smart Investing & Trading Score: 0 | |
| Day Percent Change: -0.650218% Day Change: -1.3 | |
| Week Change: -0.638681% Year-to-date Change: 15.2% | |
| ICE Links: Profile News Message Board | |
| Charts:- Daily , Weekly | |
| Add ICE to Watchlist: View: Get Complete ICE Trend Analysis ➞ | |
 | CME CME Group Inc |
| Sector: Financials | |
| SubSector: Financial Data & Stock Exchanges | |
| MarketCap: 94398 Millions | |
| Recent Price: 260.59 Smart Investing & Trading Score: 20 | |
| Day Percent Change: -0.689787% Day Change: -2.05 | |
| Week Change: 0.261629% Year-to-date Change: 13.0% | |
| CME Links: Profile News Message Board | |
| Charts:- Daily , Weekly | |
| Add CME to Watchlist: View: Get Complete CME Trend Analysis ➞ | |
 | MTU Mitsubishi UFJ Financial Group, Inc. |
| Sector: Financials | |
| SubSector: Money Center Banks | |
| MarketCap: 94306.7 Millions | |
| Recent Price: 6.64 Smart Investing & Trading Score: 10 | |
| Day Percent Change: 0% Day Change: -9999 | |
| Week Change: 0% Year-to-date Change: 0.0% | |
| MTU Links: Profile News Message Board | |
| Charts:- Daily , Weekly | |
| Add MTU to Watchlist: View: Get Complete MTU Trend Analysis ➞ | |
 | BAM Brookfield Asset Management Ltd |
| Sector: Financials | |
| SubSector: Asset Management | |
| MarketCap: 93997.1 Millions | |
| Recent Price: 59.87 Smart Investing & Trading Score: 70 | |
| Day Percent Change: 2.02795% Day Change: -0.36 | |
| Week Change: 7.52514% Year-to-date Change: 11.9% | |
| BAM Links: Profile News Message Board | |
| Charts:- Daily , Weekly | |
| Add BAM to Watchlist: View: Get Complete BAM Trend Analysis ➞ | |
 | AMT American Tower Corp |
| Sector: Financials | |
| SubSector: REIT - Specialty | |
| MarketCap: 92863.6 Millions | |
| Recent Price: 193.03 Smart Investing & Trading Score: 20 | |
| Day Percent Change: -2.12453% Day Change: -3.63 | |
| Week Change: -0.376755% Year-to-date Change: 8.4% | |
| AMT Links: Profile News Message Board | |
| Charts:- Daily , Weekly | |
| Add AMT to Watchlist: View: Get Complete AMT Trend Analysis ➞ | |
 | LFC China Life Insurance Company Limited |
| Sector: Financials | |
| SubSector: Life Insurance | |
| MarketCap: 92028.5 Millions | |
| Recent Price: 43.74 Smart Investing & Trading Score: 80 | |
| Day Percent Change: -0.364465% Day Change: -9999 | |
| Week Change: 690.958% Year-to-date Change: 0.0% | |
| LFC Links: Profile News Message Board | |
| Charts:- Daily , Weekly | |
| Add LFC to Watchlist: View: Get Complete LFC Trend Analysis ➞ | |
 | BMO Bank of Montreal |
| Sector: Financials | |
| SubSector: Banks - Diversified | |
| MarketCap: 91053 Millions | |
| Recent Price: 129.39 Smart Investing & Trading Score: 70 | |
| Day Percent Change: -0.262083% Day Change: -0.19 | |
| Week Change: 2.43845% Year-to-date Change: 37.9% | |
| BMO Links: Profile News Message Board | |
| Charts:- Daily , Weekly | |
| Add BMO to Watchlist: View: Get Complete BMO Trend Analysis ➞ | |
 | HOOD Robinhood Markets Inc |
| Sector: Financials | |
| SubSector: Capital Markets | |
| MarketCap: 89978.4 Millions | |
| Recent Price: 120.91 Smart Investing & Trading Score: 100 | |
| Day Percent Change: 1.91335% Day Change: 0.96 | |
| Week Change: 2.93717% Year-to-date Change: 206.6% | |
| HOOD Links: Profile News Message Board | |
| Charts:- Daily , Weekly | |
| Add HOOD to Watchlist: View: Get Complete HOOD Trend Analysis ➞ | |
 | MCO Moody's Corp |
| Sector: Financials | |
| SubSector: Financial Data & Stock Exchanges | |
| MarketCap: 89526 Millions | |
| Recent Price: 482.32 Smart Investing & Trading Score: 0 | |
| Day Percent Change: -5.75454% Day Change: -31.1 | |
| Week Change: -4.69491% Year-to-date Change: 2.4% | |
| MCO Links: Profile News Message Board | |
| Charts:- Daily , Weekly | |
| Add MCO to Watchlist: View: Get Complete MCO Trend Analysis ➞ | |
 | MFG Mizuho Financial Group, Inc. ADR |
| Sector: Financials | |
| SubSector: Banks - Regional | |
| MarketCap: 81353.5 Millions | |
| Recent Price: 6.58 Smart Investing & Trading Score: 40 | |
| Day Percent Change: 0.304878% Day Change: -0.06 | |
| Week Change: -1.93741% Year-to-date Change: 37.1% | |
| MFG Links: Profile News Message Board | |
| Charts:- Daily , Weekly | |
| Add MFG to Watchlist: View: Get Complete MFG Trend Analysis ➞ | |
 | PNC PNC Financial Services Group Inc |
| Sector: Financials | |
| SubSector: Banks - Regional | |
| MarketCap: 80494.2 Millions | |
| Recent Price: 206.27 Smart Investing & Trading Score: 80 | |
| Day Percent Change: 1.22687% Day Change: 2.09 | |
| Week Change: 2.1695% Year-to-date Change: 10.7% | |
| PNC Links: Profile News Message Board | |
| Charts:- Daily , Weekly | |
| Add PNC to Watchlist: View: Get Complete PNC Trend Analysis ➞ | |
 | AON Aon plc |
| Sector: Financials | |
| SubSector: Insurance Brokers | |
| MarketCap: 79898.3 Millions | |
| Recent Price: 352.76 Smart Investing & Trading Score: 0 | |
| Day Percent Change: -1.46369% Day Change: -2.35 | |
| Week Change: -2.65199% Year-to-date Change: 0.0% | |
| AON Links: Profile News Message Board | |
| Charts:- Daily , Weekly | |
| Add AON to Watchlist: View: Get Complete AON Trend Analysis ➞ | |
 | BNS Bank Of Nova Scotia |
| Sector: Financials | |
| SubSector: Banks - Diversified | |
| MarketCap: 79019 Millions | |
| Recent Price: 64.64 Smart Investing & Trading Score: 90 | |
| Day Percent Change: 0% Day Change: -0.1 | |
| Week Change: 1.18973% Year-to-date Change: 26.0% | |
| BNS Links: Profile News Message Board | |
| Charts:- Daily , Weekly | |
| Add BNS to Watchlist: View: Get Complete BNS Trend Analysis ➞ | |
 | COIN Coinbase Global Inc |
| Sector: Financials | |
| SubSector: Financial Data & Stock Exchanges | |
| MarketCap: 76842.5 Millions | |
| Recent Price: 342.79 Smart Investing & Trading Score: 90 | |
| Day Percent Change: 6.93474% Day Change: 27.26 | |
| Week Change: 8.70489% Year-to-date Change: 33.3% | |
| COIN Links: Profile News Message Board | |
| Charts:- Daily , Weekly | |
| Add COIN to Watchlist: View: Get Complete COIN Trend Analysis ➞ | |
 | AJG Arthur J. Gallagher & Co |
| Sector: Financials | |
| SubSector: Insurance Brokers | |
| MarketCap: 76709.8 Millions | |
| Recent Price: 296.74 Smart Investing & Trading Score: 50 | |
| Day Percent Change: 1.39411% Day Change: 3.66 | |
| Week Change: 1.21427% Year-to-date Change: 8.0% | |
| AJG Links: Profile News Message Board | |
| Charts:- Daily , Weekly | |
| Add AJG to Watchlist: View: Get Complete AJG Trend Analysis ➞ | |
 | USB U.S. Bancorp |
| Sector: Financials | |
| SubSector: Banks - Regional | |
| MarketCap: 75942 Millions | |
| Recent Price: 50.21 Smart Investing & Trading Score: 100 | |
| Day Percent Change: 1.20943% Day Change: 0.52 | |
| Week Change: 2.05285% Year-to-date Change: 7.3% | |
| USB Links: Profile News Message Board | |
| Charts:- Daily , Weekly | |
| Add USB to Watchlist: View: Get Complete USB Trend Analysis ➞ | |
 | EQIX Equinix Inc |
| Sector: Financials | |
| SubSector: REIT - Specialty | |
| MarketCap: 75715.4 Millions | |
| Recent Price: 785.30 Smart Investing & Trading Score: 30 | |
| Day Percent Change: 0.837207% Day Change: 3.25 | |
| Week Change: 0.602101% Year-to-date Change: -15.9% | |
| EQIX Links: Profile News Message Board | |
| Charts:- Daily , Weekly | |
| Add EQIX to Watchlist: View: Get Complete EQIX Trend Analysis ➞ | |
 | APO Apollo Global Management Inc |
| Sector: Financials | |
| SubSector: Asset Management | |
| MarketCap: 75692.1 Millions | |
| Recent Price: 143.49 Smart Investing & Trading Score: 80 | |
| Day Percent Change: 3.36407% Day Change: 4.09 | |
| Week Change: 7.37055% Year-to-date Change: -12.9% | |
| APO Links: Profile News Message Board | |
| Charts:- Daily , Weekly | |
| Add APO to Watchlist: View: Get Complete APO Trend Analysis ➞ | |
 | CM Canadian Imperial Bank Of Commerce |
| Sector: Financials | |
| SubSector: Banks - Diversified | |
| MarketCap: 73165.8 Millions | |
| Recent Price: 80.44 Smart Investing & Trading Score: 90 | |
| Day Percent Change: 0.249252% Day Change: -0.05 | |
| Week Change: 2.02943% Year-to-date Change: 31.0% | |
| CM Links: Profile News Message Board | |
| Charts:- Daily , Weekly | |
| Add CM to Watchlist: View: Get Complete CM Trend Analysis ➞ | |
 | BK Bank Of New York Mellon Corp |
| Sector: Financials | |
| SubSector: Banks - Diversified | |
| MarketCap: 73126.4 Millions | |
| Recent Price: 108.52 Smart Investing & Trading Score: 100 | |
| Day Percent Change: 1.41108% Day Change: 1.56 | |
| Week Change: 4.34615% Year-to-date Change: 42.6% | |
| BK Links: Profile News Message Board | |
| Charts:- Daily , Weekly | |
| Add BK to Watchlist: View: Get Complete BK Trend Analysis ➞ | |
| For tabular summary view of above stock list: Summary View ➞ 0 - 25 , 25 - 50 , 50 - 75 , 75 - 100 , 100 - 125 , 125 - 150 , 150 - 175 , 175 - 200 , 200 - 225 , 225 - 250 , 250 - 275 , 275 - 300 , 300 - 325 , 325 - 350 , 350 - 375 , 375 - 400 , 400 - 425 , 425 - 450 , 450 - 475 , 475 - 500 , 500 - 525 , 525 - 550 , 550 - 575 , 575 - 600 , 600 - 625 , 625 - 650 , 650 - 675 , 675 - 700 , 700 - 725 , 725 - 750 , 750 - 775 , 775 - 800 , 800 - 825 , 825 - 850 , 850 - 875 , 875 - 900 , 900 - 925 , 925 - 950 , 950 - 975 , 975 - 1000 , 1000 - 1025 , 1025 - 1050 , 1050 - 1075 , 1075 - 1100 , 1100 - 1125 , 1125 - 1150 , 1150 - 1175 , 1175 - 1200 , 1200 - 1225 , 1225 - 1250 , 1250 - 1275 , 1275 - 1300 , 1300 - 1325 , 1325 - 1350 , 1350 - 1375 , 1375 - 1400 , 1400 - 1425 , 1425 - 1450 , 1450 - 1475 , 1475 - 1500 , 1500 - 1525 , 1525 - 1550 | ||
| Click To Change The Sort Order: By Market Cap or Company Size Performance: Year-to-date, Week and Day | |
| Select Chart Type: | ||
|
Best Stocks Today 12Stocks.com |
© 2025 12Stocks.com Terms & Conditions Privacy Contact Us
All Information Provided Only For Education And Not To Be Used For Investing or Trading. See Terms & Conditions


One More Thing ... Get Best Stocks Delivered Daily!
Never Ever Miss A Move With Our Top Ten Stocks Lists
Find Best Stocks In Any Market - Bull or Bear Market
Take A Peek At Our Top Ten Stocks Lists: Daily, Weekly, Year-to-Date & Top Trends
Find Best Stocks In Any Market - Bull or Bear Market
Take A Peek At Our Top Ten Stocks Lists: Daily, Weekly, Year-to-Date & Top Trends
Financial Stocks With Best Up Trends [0-bearish to 100-bullish]: Better Home[100], AMREP Corp[100], PIMCO California[100], Torchmark [100], PIMCO California[100], Triumph Bancorp[100], StepStone [100], Radian [100], National Bank[100], PIMCO Municipal[100], MARA [100]
Best Financial Stocks Year-to-Date:
Insight Select[12384.6%], Oxford Lane[292.479%], Better Home[250.328%], Metalpha Technology[213.274%], Robinhood Markets[206.567%], Cipher Mining[145.528%], Mr. Cooper[133.957%], Banco Santander[130.037%], IHS Holding[117.61%], Deutsche Bank[114.776%], LoanDepot [110.733%] Best Financial Stocks This Week:
Colony Starwood[15929900%], Blackhawk Network[91300%], Macquarie Global[81662.9%], Credit Suisse[63241.6%], Pennsylvania Real[23823%], First Republic[22570.9%], Select ome[14000%], CorEnergy Infrastructure[6797.78%], FedNat Holding[5525%], BlackRock Municipal[5340%], BlackRock MuniYield[3379.04%] Best Financial Stocks Daily:
Better Home[13.3451%], AMREP Corp[11.992%], PIMCO California[11.9545%], Torchmark [11.8363%], Forge Global[11.5409%], PIMCO California[11.4754%], BlackRock Muni[10.8108%], Blackrock MuniYield[10.72%], Triumph Bancorp[10.2661%], StepStone [8.74771%], BlackRock MuniYield[8.15348%]