
 Login Sign Up


| |||||
 |  | ||||

| 12Stocks.com Market Intelligence |
Best Financial Stocks
| In a hurry? Financial Stocks Lists: Performance Trends Table, Stock Charts
Sort Financial stocks: Daily, Weekly, Year-to-Date, Market Cap & Trends. Filter Financial stocks list by size:All Financial Large Mid-Range Small & MicroCap |
| 12Stocks.com Financial Stocks Performances & Trends Daily | |||||||||
|
|  The overall Smart Investing & Trading Score is 33 (0-bearish to 100-bullish) which puts Financial sector in short term bearish to neutral trend. The Smart Investing & Trading Score from previous trading session is 26 and hence an improvement of trend.
| ||||||||
Here are the Smart Investing & Trading Scores of the most requested Financial stocks at 12Stocks.com (click stock name for detailed review):
|


| 12Stocks.com: Investing in Financial sector with Stocks | |
|
The following table helps investors and traders sort through current performance and trends (as measured by Smart Investing & Trading Score) of various
stocks in the Financial sector. Quick View: Move mouse or cursor over stock symbol (ticker) to view short-term Technical chart and over stock name to view long term chart. Click on  to add stock symbol to your watchlist and to add stock symbol to your watchlist and  to view watchlist. Click on any ticker or stock name for detailed market intelligence report for that stock. to view watchlist. Click on any ticker or stock name for detailed market intelligence report for that stock. |
12Stocks.com Performance of Stocks in Financial Sector
| Ticker | Stock Name | Watchlist | Category | Recent Price | Smart Investing & Trading Score | Change % | YTD Change% |
| FSBC | Five Star |   | Banks - Regional | 30.09 | 66 | 2.21% | 0.66% |
| INDB | Independent Bank | | Regional Banks | 63.96 | 51 | 3.06% | 0.58% |
| AON | Aon | | Insurance | 360.40 | 64 | 1.96% | 0.53% |
| RM | Regional Management | | Credit Services | 33.87 | 93 | 3.23% | 0.51% |
| WTFC | Wintrust | | Regional Banks | 124.85 | 26 | 0.67% | 0.50% |
| STC | Stewart Information | | Insurance | 67.35 | 100 | 2.67% | 0.49% |
| CIM | Chimera | | Mortgage | 13.67 | 58 | 1.71% | 0.48% |
| IVR | Invesco Mortgage | | Mortgage | 7.71 | 90 | 1.72% | 0.47% |
| AJG | Arthur J. | | Insurance | 284.61 | 25 | 0.15% | 0.46% |
| OFG | OFG Bancorp | | Banks | 42.18 | 54 | 0.96% | 0.42% |
| LAZ | Lazard | | Asset Mgmt | 51.21 | 43 | 2.03% | 0.42% |
| PLD | Prologis | | REIT - Industrial | 105.21 | 10 | 0.29% | 0.42% |
| FAF | First American | | Insurance | 62.00 | 100 | 2.21% | 0.14% |
| HONE | HarborOne Bancorp | | S&L | 11.72 | 46 | 0.95% | 0.04% |
| PNC | PNC | | Banks | 189.07 | 53 | 1.72% | -0.12% |
| AIV | Apartment | | REIT | 8.47 | 61 | 0.95% | -0.17% |
| BX | Blackstone | | Asset Mgmt | 170.50 | 65 | 0.06% | -0.27% |
| BSRR | Sierra Bancorp | | Regional Banks | 28.60 | 36 | 0.03% | -0.28% |
| CNOB | ConnectOne Bancorp | | Regional Banks | 22.68 | 10 | 1.98% | -0.34% |
| HIPO | Hippo | | Insurance - Specialty | 26.64 | 73 | 5.05% | -0.49% |
| EPRT | Essential Properties | | REIT - | 30.84 | 57 | 0.98% | -0.51% |
| PMT | PennyMac Mortgage | | Mortgage | 12.12 | 42 | 2.71% | -0.58% |
| HOMB | Home Bancshares | | Banks | 27.93 | 17 | 1.20% | -0.69% |
| GLPI | Gaming and | | REIT - | 47.08 | 85 | 2.02% | -0.72% |
| VOYA | Voya | | Asset Mgmt | 67.86 | 36 | 0.82% | -0.78% |
| For chart view version of above stock list: Chart View ➞ 0 - 25 , 25 - 50 , 50 - 75 , 75 - 100 , 100 - 125 , 125 - 150 , 150 - 175 , 175 - 200 , 200 - 225 , 225 - 250 , 250 - 275 , 275 - 300 , 300 - 325 , 325 - 350 , 350 - 375 , 375 - 400 , 400 - 425 , 425 - 450 , 450 - 475 , 475 - 500 , 500 - 525 , 525 - 550 , 550 - 575 | ||
 | Click To Change The Sort Order: By Market Cap or Company Size Performance: Year-to-date, Week and Day |  |
|
Get the most comprehensive stock market coverage daily at 12Stocks.com ➞ Best Stocks Today ➞ Best Stocks Weekly ➞ Best Stocks Year-to-Date ➞ Best Stocks Trends ➞  Best Stocks Today 12Stocks.com Best Nasdaq Stocks ➞ Best S&P 500 Stocks ➞ Best Tech Stocks ➞ Best Biotech Stocks ➞ |
| Detailed Overview of Financial Stocks |
| Financial Technical Overview, Leaders & Laggards, Top Financial ETF Funds & Detailed Financial Stocks List, Charts, Trends & More |
| Financial Sector: Technical Analysis, Trends & YTD Performance | |
| Financial sector is composed of stocks
from banks, brokers, insurance, REITs
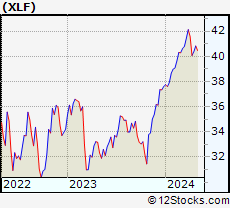
and services subsectors. Financial sector, as represented by XLF, an exchange-traded fund [ETF] that holds basket of Financial stocks (e.g, Bank of America, Goldman Sachs) is up by 7.8% and is currently outperforming the overall market by 0.27% year-to-date. Below is a quick view of Technical charts and trends: |
|
 XLF Weekly Chart |
|
| Long Term Trend: Good | |
| Medium Term Trend: Not Good | |
 XLF Daily Chart |
|
| Short Term Trend: Not Good | |
| Overall Trend Score: 33 | |
| YTD Performance: 7.8% | |
| **Trend Scores & Views Are Only For Educational Purposes And Not For Investing | |
| 12Stocks.com: Top Performing Financial Sector Stocks | ||||||||||||||||||||||||||||||||||||||||||||||||
 The top performing Financial sector stocks year to date are
Now, more recently, over last week, the top performing Financial sector stocks on the move are


|
||||||||||||||||||||||||||||||||||||||||||||||||
| 12Stocks.com: Investing in Financial Sector using Exchange Traded Funds | |
|
The following table shows list of key exchange traded funds (ETF) that
help investors track Financial Index. For detailed view, check out our ETF Funds section of our website. Quick View: Move mouse or cursor over ETF symbol (ticker) to view short-term Technical chart and over ETF name to view long term chart. Click on ticker or stock name for detailed view. Click on to add stock symbol to your watchlist and to view watchlist. |
12Stocks.com List of ETFs that track Financial Index
| Ticker | ETF Name | Watchlist | Recent Price | Smart Investing & Trading Score | Change % | Week % | Year-to-date % |
| XLF | Financial | | 51.91 | 33 | 0.99 | 0.99 | 7.8% |
| IAI | Broker-Dealers & Secs | | 174.97 | 63 | 2.34 | 2.34 | 21.82% |
| KBE | Bank | | 55.98 | 43 | 1.3 | 1.3 | 1.64% |
| FAS | Financial Bull 3X | | 161.82 | 33 | 2.91 | 2.91 | 7.48% |
| FAZ | Financial Bear 3X | | 4.54 | 62 | -2.78 | -2.78 | -27.4% |
| UYG | Financials | | 92.87 | 26 | 1.72 | 1.72 | 9% |
| KIE | Insurance | | 56.42 | 25 | 1.27 | 1.27 | 0.32% |
| 12Stocks.com: Charts, Trends, Fundamental Data and Performances of Financial Stocks | |
|
We now take in-depth look at all Financial stocks including charts, multi-period performances and overall trends (as measured by Smart Investing & Trading Score). One can sort Financial stocks (click link to choose) by Daily, Weekly and by Year-to-Date performances. Also, one can sort by size of the company or by market capitalization. |
| Select Your Default Chart Type: | |||||
| |||||
| Click on stock symbol or name for detailed view. Click on to add stock symbol to your watchlist and to view watchlist. Quick View: Move mouse or cursor over "Daily" to quickly view daily Technical stock chart and over "Weekly" to view weekly Technical stock chart. | |||||

 | FSBC Five Star Bancorp |
| Sector: Financials | |
| SubSector: Banks - Regional | |
| MarketCap: 377 Millions | |
| Recent Price: 30.09 Smart Investing & Trading Score: 66 | |
| Day Percent Change: 2.21% Day Change: 0.65 | |
| Week Change: 2.21% Year-to-date Change: 0.7% | |
| FSBC Links: Profile News Message Board | |
| Charts:- Daily , Weekly | |
| Add FSBC to Watchlist: View: Get Complete FSBC Trend Analysis ➞ | |
 | INDB Independent Bank Corp. |
| Sector: Financials | |
| SubSector: Regional - Northeast Banks | |
| MarketCap: 2347.09 Millions | |
| Recent Price: 63.96 Smart Investing & Trading Score: 51 | |
| Day Percent Change: 3.06% Day Change: 1.9 | |
| Week Change: 3.06% Year-to-date Change: 0.6% | |
| INDB Links: Profile News Message Board | |
| Charts:- Daily , Weekly | |
| Add INDB to Watchlist: View: Get Complete INDB Trend Analysis ➞ | |
 | AON Aon plc |
| Sector: Financials | |
| SubSector: Insurance Brokers | |
| MarketCap: 36870.1 Millions | |
| Recent Price: 360.40 Smart Investing & Trading Score: 64 | |
| Day Percent Change: 1.96% Day Change: 6.94 | |
| Week Change: 1.96% Year-to-date Change: 0.5% | |
| AON Links: Profile News Message Board | |
| Charts:- Daily , Weekly | |
| Add AON to Watchlist: View: Get Complete AON Trend Analysis ➞ | |
 | RM Regional Management Corp. |
| Sector: Financials | |
| SubSector: Credit Services | |
| MarketCap: 148.008 Millions | |
| Recent Price: 33.87 Smart Investing & Trading Score: 93 | |
| Day Percent Change: 3.23% Day Change: 1.06 | |
| Week Change: 3.23% Year-to-date Change: 0.5% | |
| RM Links: Profile News Message Board | |
| Charts:- Daily , Weekly | |
| Add RM to Watchlist: View: Get Complete RM Trend Analysis ➞ | |
 | WTFC Wintrust Financial Corporation |
| Sector: Financials | |
| SubSector: Regional - Midwest Banks | |
| MarketCap: 1942.6 Millions | |
| Recent Price: 124.85 Smart Investing & Trading Score: 26 | |
| Day Percent Change: 0.67% Day Change: 0.83 | |
| Week Change: 0.67% Year-to-date Change: 0.5% | |
| WTFC Links: Profile News Message Board | |
| Charts:- Daily , Weekly | |
| Add WTFC to Watchlist: View: Get Complete WTFC Trend Analysis ➞ | |
 | STC Stewart Information Services Corporation |
| Sector: Financials | |
| SubSector: Property & Casualty Insurance | |
| MarketCap: 629.912 Millions | |
| Recent Price: 67.35 Smart Investing & Trading Score: 100 | |
| Day Percent Change: 2.67% Day Change: 1.75 | |
| Week Change: 2.67% Year-to-date Change: 0.5% | |
| STC Links: Profile News Message Board | |
| Charts:- Daily , Weekly | |
| Add STC to Watchlist: View: Get Complete STC Trend Analysis ➞ | |
 | CIM Chimera Investment Corporation |
| Sector: Financials | |
| SubSector: Mortgage Investment | |
| MarketCap: 2164.09 Millions | |
| Recent Price: 13.67 Smart Investing & Trading Score: 58 | |
| Day Percent Change: 1.71% Day Change: 0.23 | |
| Week Change: 1.71% Year-to-date Change: 0.5% | |
| CIM Links: Profile News Message Board | |
| Charts:- Daily , Weekly | |
| Add CIM to Watchlist: View: Get Complete CIM Trend Analysis ➞ | |
 | IVR Invesco Mortgage Capital Inc. |
| Sector: Financials | |
| SubSector: Mortgage Investment | |
| MarketCap: 1182.19 Millions | |
| Recent Price: 7.71 Smart Investing & Trading Score: 90 | |
| Day Percent Change: 1.72% Day Change: 0.13 | |
| Week Change: 1.72% Year-to-date Change: 0.5% | |
| IVR Links: Profile News Message Board | |
| Charts:- Daily , Weekly | |
| Add IVR to Watchlist: View: Get Complete IVR Trend Analysis ➞ | |
 | AJG Arthur J. Gallagher & Co. |
| Sector: Financials | |
| SubSector: Insurance Brokers | |
| MarketCap: 14852.2 Millions | |
| Recent Price: 284.61 Smart Investing & Trading Score: 25 | |
| Day Percent Change: 0.15% Day Change: 0.44 | |
| Week Change: 0.15% Year-to-date Change: 0.5% | |
| AJG Links: Profile News Message Board | |
| Charts:- Daily , Weekly | |
| Add AJG to Watchlist: View: Get Complete AJG Trend Analysis ➞ | |
 | OFG OFG Bancorp |
| Sector: Financials | |
| SubSector: Money Center Banks | |
| MarketCap: 537.599 Millions | |
| Recent Price: 42.18 Smart Investing & Trading Score: 54 | |
| Day Percent Change: 0.96% Day Change: 0.4 | |
| Week Change: 0.96% Year-to-date Change: 0.4% | |
| OFG Links: Profile News Message Board | |
| Charts:- Daily , Weekly | |
| Add OFG to Watchlist: View: Get Complete OFG Trend Analysis ➞ | |
 | LAZ Lazard Ltd |
| Sector: Financials | |
| SubSector: Asset Management | |
| MarketCap: 3061.13 Millions | |
| Recent Price: 51.21 Smart Investing & Trading Score: 43 | |
| Day Percent Change: 2.03% Day Change: 1.02 | |
| Week Change: 2.03% Year-to-date Change: 0.4% | |
| LAZ Links: Profile News Message Board | |
| Charts:- Daily , Weekly | |
| Add LAZ to Watchlist: View: Get Complete LAZ Trend Analysis ➞ | |
 | PLD Prologis, Inc. |
| Sector: Financials | |
| SubSector: REIT - Industrial | |
| MarketCap: 48728.9 Millions | |
| Recent Price: 105.21 Smart Investing & Trading Score: 10 | |
| Day Percent Change: 0.29% Day Change: 0.3 | |
| Week Change: 0.29% Year-to-date Change: 0.4% | |
| PLD Links: Profile News Message Board | |
| Charts:- Daily , Weekly | |
| Add PLD to Watchlist: View: Get Complete PLD Trend Analysis ➞ | |
 | FAF First American Financial Corporation |
| Sector: Financials | |
| SubSector: Property & Casualty Insurance | |
| MarketCap: 4163.82 Millions | |
| Recent Price: 62.00 Smart Investing & Trading Score: 100 | |
| Day Percent Change: 2.21% Day Change: 1.34 | |
| Week Change: 2.21% Year-to-date Change: 0.1% | |
| FAF Links: Profile News Message Board | |
| Charts:- Daily , Weekly | |
| Add FAF to Watchlist: View: Get Complete FAF Trend Analysis ➞ | |
 | HONE HarborOne Bancorp, Inc. |
| Sector: Financials | |
| SubSector: Savings & Loans | |
| MarketCap: 456.03 Millions | |
| Recent Price: 11.72 Smart Investing & Trading Score: 46 | |
| Day Percent Change: 0.95% Day Change: 0.11 | |
| Week Change: 0.95% Year-to-date Change: 0.0% | |
| HONE Links: Profile News Message Board | |
| Charts:- Daily , Weekly | |
| Add HONE to Watchlist: View: Get Complete HONE Trend Analysis ➞ | |
 | PNC The PNC Financial Services Group, Inc. |
| Sector: Financials | |
| SubSector: Money Center Banks | |
| MarketCap: 41291.5 Millions | |
| Recent Price: 189.07 Smart Investing & Trading Score: 53 | |
| Day Percent Change: 1.72% Day Change: 3.19 | |
| Week Change: 1.72% Year-to-date Change: -0.1% | |
| PNC Links: Profile News Message Board | |
| Charts:- Daily , Weekly | |
| Add PNC to Watchlist: View: Get Complete PNC Trend Analysis ➞ | |
 | AIV Apartment Investment and Management Company |
| Sector: Financials | |
| SubSector: REIT - Residential | |
| MarketCap: 4485.11 Millions | |
| Recent Price: 8.47 Smart Investing & Trading Score: 61 | |
| Day Percent Change: 0.95% Day Change: 0.08 | |
| Week Change: 0.95% Year-to-date Change: -0.2% | |
| AIV Links: Profile News Message Board | |
| Charts:- Daily , Weekly | |
| Add AIV to Watchlist: View: Get Complete AIV Trend Analysis ➞ | |
 | BX The Blackstone Group Inc. |
| Sector: Financials | |
| SubSector: Asset Management | |
| MarketCap: 50957.7 Millions | |
| Recent Price: 170.50 Smart Investing & Trading Score: 65 | |
| Day Percent Change: 0.06% Day Change: 0.1 | |
| Week Change: 0.06% Year-to-date Change: -0.3% | |
| BX Links: Profile News Message Board | |
| Charts:- Daily , Weekly | |
| Add BX to Watchlist: View: Get Complete BX Trend Analysis ➞ | |
 | BSRR Sierra Bancorp |
| Sector: Financials | |
| SubSector: Regional - Pacific Banks | |
| MarketCap: 256.929 Millions | |
| Recent Price: 28.60 Smart Investing & Trading Score: 36 | |
| Day Percent Change: 0.03% Day Change: 0.01 | |
| Week Change: 0.03% Year-to-date Change: -0.3% | |
| BSRR Links: Profile News Message Board | |
| Charts:- Daily , Weekly | |
| Add BSRR to Watchlist: View: Get Complete BSRR Trend Analysis ➞ | |
 | CNOB ConnectOne Bancorp, Inc. |
| Sector: Financials | |
| SubSector: Regional - Northeast Banks | |
| MarketCap: 491.899 Millions | |
| Recent Price: 22.68 Smart Investing & Trading Score: 10 | |
| Day Percent Change: 1.98% Day Change: 0.44 | |
| Week Change: 1.98% Year-to-date Change: -0.3% | |
| CNOB Links: Profile News Message Board | |
| Charts:- Daily , Weekly | |
| Add CNOB to Watchlist: View: Get Complete CNOB Trend Analysis ➞ | |
 | HIPO Hippo Holdings Inc. |
| Sector: Financials | |
| SubSector: Insurance - Specialty | |
| MarketCap: 377 Millions | |
| Recent Price: 26.64 Smart Investing & Trading Score: 73 | |
| Day Percent Change: 5.05% Day Change: 1.28 | |
| Week Change: 5.05% Year-to-date Change: -0.5% | |
| HIPO Links: Profile News Message Board | |
| Charts:- Daily , Weekly | |
| Add HIPO to Watchlist: View: Get Complete HIPO Trend Analysis ➞ | |
 | EPRT Essential Properties Realty Trust, Inc. |
| Sector: Financials | |
| SubSector: REIT - Diversified | |
| MarketCap: 1424.43 Millions | |
| Recent Price: 30.84 Smart Investing & Trading Score: 57 | |
| Day Percent Change: 0.98% Day Change: 0.3 | |
| Week Change: 0.98% Year-to-date Change: -0.5% | |
| EPRT Links: Profile News Message Board | |
| Charts:- Daily , Weekly | |
| Add EPRT to Watchlist: View: Get Complete EPRT Trend Analysis ➞ | |
 | PMT PennyMac Mortgage Investment Trust |
| Sector: Financials | |
| SubSector: Mortgage Investment | |
| MarketCap: 917.639 Millions | |
| Recent Price: 12.12 Smart Investing & Trading Score: 42 | |
| Day Percent Change: 2.71% Day Change: 0.32 | |
| Week Change: 2.71% Year-to-date Change: -0.6% | |
| PMT Links: Profile News Message Board | |
| Charts:- Daily , Weekly | |
| Add PMT to Watchlist: View: Get Complete PMT Trend Analysis ➞ | |
 | HOMB Home Bancshares, Inc. (Conway, AR) |
| Sector: Financials | |
| SubSector: Money Center Banks | |
| MarketCap: 2090.49 Millions | |
| Recent Price: 27.93 Smart Investing & Trading Score: 17 | |
| Day Percent Change: 1.2% Day Change: 0.33 | |
| Week Change: 1.2% Year-to-date Change: -0.7% | |
| HOMB Links: Profile News Message Board | |
| Charts:- Daily , Weekly | |
| Add HOMB to Watchlist: View: Get Complete HOMB Trend Analysis ➞ | |
 | GLPI Gaming and Leisure Properties, Inc. |
| Sector: Financials | |
| SubSector: REIT - Diversified | |
| MarketCap: 4922.33 Millions | |
| Recent Price: 47.08 Smart Investing & Trading Score: 85 | |
| Day Percent Change: 2.02% Day Change: 0.93 | |
| Week Change: 2.02% Year-to-date Change: -0.7% | |
| GLPI Links: Profile News Message Board | |
| Charts:- Daily , Weekly | |
| Add GLPI to Watchlist: View: Get Complete GLPI Trend Analysis ➞ | |
 | VOYA Voya Financial, Inc. |
| Sector: Financials | |
| SubSector: Asset Management | |
| MarketCap: 4771.23 Millions | |
| Recent Price: 67.86 Smart Investing & Trading Score: 36 | |
| Day Percent Change: 0.82% Day Change: 0.55 | |
| Week Change: 0.82% Year-to-date Change: -0.8% | |
| VOYA Links: Profile News Message Board | |
| Charts:- Daily , Weekly | |
| Add VOYA to Watchlist: View: Get Complete VOYA Trend Analysis ➞ | |
| For tabular summary view of above stock list: Summary View ➞ 0 - 25 , 25 - 50 , 50 - 75 , 75 - 100 , 100 - 125 , 125 - 150 , 150 - 175 , 175 - 200 , 200 - 225 , 225 - 250 , 250 - 275 , 275 - 300 , 300 - 325 , 325 - 350 , 350 - 375 , 375 - 400 , 400 - 425 , 425 - 450 , 450 - 475 , 475 - 500 , 500 - 525 , 525 - 550 , 550 - 575 | ||
| Click To Change The Sort Order: By Market Cap or Company Size Performance: Year-to-date, Week and Day | |
| Select Chart Type: | ||
|
Best Stocks Today 12Stocks.com |
© 2025 12Stocks.com Terms & Conditions Privacy Contact Us
All Information Provided Only For Education And Not To Be Used For Investing or Trading. See Terms & Conditions


One More Thing ... Get Best Stocks Delivered Daily!
Never Ever Miss A Move With Our Top Ten Stocks Lists
Find Best Stocks In Any Market - Bull or Bear Market
Take A Peek At Our Top Ten Stocks Lists: Daily, Weekly, Year-to-Date & Top Trends
Find Best Stocks In Any Market - Bull or Bear Market
Take A Peek At Our Top Ten Stocks Lists: Daily, Weekly, Year-to-Date & Top Trends
Financial Stocks With Best Up Trends [0-bearish to 100-bullish]: Uniti [100], LendingTree [100], Mercury General[100], Perella Weinberg[100], Broadstone Net[100], LendingClub [100], TPG RE[100], CareTrust REIT[100], Stewart Information[100], Healthcare Realty[100], VICI Properties[100]
Best Financial Stocks Year-to-Date:
ESSA Bancorp[3207.77%], Easterly Government[108.45%], Mr. Cooper[86.58%], Heritage Insurance[75.29%], Root [65.29%], Industrial Logistics[64.89%], Rocket [58.42%], Diversified Healthcare[49.61%], ProAssurance [49.59%], Uniti [47.09%], SoFi Technologies[41.62%] Best Financial Stocks This Week:
Uniti [64.77%], Industrial Logistics[11.36%], LendingTree [7.32%], eXp World[7.27%], EverQuote [6.89%], Camping World[6.84%], First Foundation[6.69%], Diamond Hill[5.46%], Mercury General[5.36%], Cipher Mining[5.27%], AlTi Global[5.13%] Best Financial Stocks Daily:
Uniti [64.77%], Industrial Logistics[11.36%], LendingTree [7.32%], eXp World[7.27%], EverQuote [6.89%], Camping World[6.84%], First Foundation[6.69%], Diamond Hill[5.46%], Mercury General[5.36%], Cipher Mining[5.27%], AlTi Global[5.13%]