
 Login Sign Up


| |||||
 |  | ||||

| 12Stocks.com Market Intelligence |
Best Financial Stocks
| In a hurry? Financial Stocks Lists: Performance Trends Table, Stock Charts
Sort Financial stocks: Daily, Weekly, Year-to-Date, Market Cap & Trends. Filter Financial stocks list by size:All Financial Large Mid-Range Small & MicroCap |
| 12Stocks.com Financial Stocks Performances & Trends Daily | |||||||||
|
|  The overall Smart Investing & Trading Score is 33 (0-bearish to 100-bullish) which puts Financial sector in short term bearish to neutral trend. The Smart Investing & Trading Score from previous trading session is 26 and hence an improvement of trend.
| ||||||||
Here are the Smart Investing & Trading Scores of the most requested Financial stocks at 12Stocks.com (click stock name for detailed review):
|


| 12Stocks.com: Investing in Financial sector with Stocks | |
|
The following table helps investors and traders sort through current performance and trends (as measured by Smart Investing & Trading Score) of various
stocks in the Financial sector. Quick View: Move mouse or cursor over stock symbol (ticker) to view short-term Technical chart and over stock name to view long term chart. Click on  to add stock symbol to your watchlist and to add stock symbol to your watchlist and  to view watchlist. Click on any ticker or stock name for detailed market intelligence report for that stock. to view watchlist. Click on any ticker or stock name for detailed market intelligence report for that stock. |
12Stocks.com Performance of Stocks in Financial Sector
| Ticker | Stock Name | Watchlist | Category | Recent Price | Smart Investing & Trading Score | Change % | Weekly Change% |
| BANC | Banc of California |   | Regional Banks | 14.38 | 43 | 1.55% | 1.55% |
| FHN | First Horizon | | Regional Banks | 21.67 | 43 | 1.55% | 1.55% |
| PKST | Peakstone Realty | | REIT - | 13.85 | 83 | 1.54% | 1.54% |
| SVC | Service Properties | | REIT | 2.63 | 58 | 1.54% | 1.54% |
| OLP | One Liberty | | REIT - | 22.45 | 25 | 1.54% | 1.54% |
| CATY | Cathay General | | Regional Banks | 45.52 | 43 | 1.54% | 1.54% |
| GL | Globe Life | | Life Insurance | 139.34 | 68 | 1.53% | 1.53% |
| WELL | Welltower | | REIT | 168.78 | 95 | 1.53% | 1.53% |
| FCF | First Commonwealth | | Regional Banks | 16.58 | 68 | 1.53% | 1.53% |
| HMN | Horace Mann | | Insurance | 41.90 | 64 | 1.53% | 1.53% |
| THG | Hanover Insurance | | Insurance | 171.39 | 64 | 1.52% | 1.52% |
| PDLB | PDL Community | | REIT - Retail | 14.12 | 66 | 1.51% | 1.51% |
| HTBK | Heritage Commerce | | Regional Banks | 9.39 | 58 | 1.51% | 1.51% |
| THFF | First | | Regional Banks | 53.23 | 43 | 1.51% | 1.51% |
| PJT | PJT Partners | | Asset Mgmt | 181.73 | 76 | 1.51% | 1.51% |
| AKR | Acadia Realty | | Property Mgmt | 18.78 | 50 | 1.51% | 1.51% |
| NHI | National Health | | REIT | 72.41 | 77 | 1.51% | 1.51% |
| ACNB | ACNB | | Regional - Southwest Banks | 41.95 | 43 | 1.50% | 1.50% |
| CBSH | Commerce Bancshares | | Regional Banks | 60.81 | 25 | 1.49% | 1.49% |
| KIM | Kimco Realty | | REIT - Retail | 21.05 | 0 | 1.49% | 1.49% |
| SBCF | Seacoast Banking | | Regional Banks | 28.05 | 61 | 1.48% | 1.48% |
| PLMR | Palomar | | Insurance | 131.53 | 35 | 1.47% | 1.47% |
| FOR | Forestar | | Real Estatet | 25.52 | 85 | 1.47% | 1.47% |
| JRVR | James River | | Insurance | 5.52 | 20 | 1.47% | 1.47% |
| PNFP | Pinnacle | | Regional Banks | 87.40 | 17 | 1.47% | 1.47% |
| For chart view version of above stock list: Chart View ➞ 0 - 25 , 25 - 50 , 50 - 75 , 75 - 100 , 100 - 125 , 125 - 150 , 150 - 175 , 175 - 200 , 200 - 225 , 225 - 250 , 250 - 275 , 275 - 300 , 300 - 325 , 325 - 350 , 350 - 375 , 375 - 400 , 400 - 425 , 425 - 450 , 450 - 475 , 475 - 500 , 500 - 525 , 525 - 550 , 550 - 575 | ||
 | Click To Change The Sort Order: By Market Cap or Company Size Performance: Year-to-date, Week and Day |  |
|
Get the most comprehensive stock market coverage daily at 12Stocks.com ➞ Best Stocks Today ➞ Best Stocks Weekly ➞ Best Stocks Year-to-Date ➞ Best Stocks Trends ➞  Best Stocks Today 12Stocks.com Best Nasdaq Stocks ➞ Best S&P 500 Stocks ➞ Best Tech Stocks ➞ Best Biotech Stocks ➞ |
| Detailed Overview of Financial Stocks |
| Financial Technical Overview, Leaders & Laggards, Top Financial ETF Funds & Detailed Financial Stocks List, Charts, Trends & More |
| Financial Sector: Technical Analysis, Trends & YTD Performance | |
| Financial sector is composed of stocks
from banks, brokers, insurance, REITs
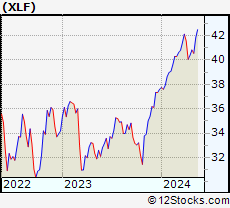
and services subsectors. Financial sector, as represented by XLF, an exchange-traded fund [ETF] that holds basket of Financial stocks (e.g, Bank of America, Goldman Sachs) is up by 7.8% and is currently outperforming the overall market by 0.27% year-to-date. Below is a quick view of Technical charts and trends: |
|
 XLF Weekly Chart |
|
| Long Term Trend: Good | |
| Medium Term Trend: Not Good | |
 XLF Daily Chart |
|
| Short Term Trend: Not Good | |
| Overall Trend Score: 33 | |
| YTD Performance: 7.8% | |
| **Trend Scores & Views Are Only For Educational Purposes And Not For Investing | |
| 12Stocks.com: Top Performing Financial Sector Stocks | ||||||||||||||||||||||||||||||||||||||||||||||||
 The top performing Financial sector stocks year to date are
Now, more recently, over last week, the top performing Financial sector stocks on the move are


|
||||||||||||||||||||||||||||||||||||||||||||||||
| 12Stocks.com: Investing in Financial Sector using Exchange Traded Funds | |
|
The following table shows list of key exchange traded funds (ETF) that
help investors track Financial Index. For detailed view, check out our ETF Funds section of our website. Quick View: Move mouse or cursor over ETF symbol (ticker) to view short-term Technical chart and over ETF name to view long term chart. Click on ticker or stock name for detailed view. Click on to add stock symbol to your watchlist and to view watchlist. |
12Stocks.com List of ETFs that track Financial Index
| Ticker | ETF Name | Watchlist | Recent Price | Smart Investing & Trading Score | Change % | Week % | Year-to-date % |
| XLF | Financial | | 51.91 | 33 | 0.99 | 0.99 | 7.8% |
| IAI | Broker-Dealers & Secs | | 174.97 | 63 | 2.34 | 2.34 | 21.82% |
| KBE | Bank | | 55.98 | 43 | 1.3 | 1.3 | 1.64% |
| FAS | Financial Bull 3X | | 161.82 | 33 | 2.91 | 2.91 | 7.48% |
| FAZ | Financial Bear 3X | | 4.54 | 62 | -2.78 | -2.78 | -27.4% |
| UYG | Financials | | 92.87 | 26 | 1.72 | 1.72 | 9% |
| KIE | Insurance | | 56.42 | 25 | 1.27 | 1.27 | 0.32% |
| 12Stocks.com: Charts, Trends, Fundamental Data and Performances of Financial Stocks | |
|
We now take in-depth look at all Financial stocks including charts, multi-period performances and overall trends (as measured by Smart Investing & Trading Score). One can sort Financial stocks (click link to choose) by Daily, Weekly and by Year-to-Date performances. Also, one can sort by size of the company or by market capitalization. |
| Select Your Default Chart Type: | |||||
| |||||
| Click on stock symbol or name for detailed view. Click on to add stock symbol to your watchlist and to view watchlist. Quick View: Move mouse or cursor over "Daily" to quickly view daily Technical stock chart and over "Weekly" to view weekly Technical stock chart. | |||||

 | BANC Banc of California, Inc. |
| Sector: Financials | |
| SubSector: Regional - Pacific Banks | |
| MarketCap: 459.929 Millions | |
| Recent Price: 14.38 Smart Investing & Trading Score: 43 | |
| Day Percent Change: 1.55% Day Change: 0.22 | |
| Week Change: 1.55% Year-to-date Change: -6.3% | |
| BANC Links: Profile News Message Board | |
| Charts:- Daily , Weekly | |
| Add BANC to Watchlist: View: Get Complete BANC Trend Analysis ➞ | |
 | FHN First Horizon National Corporation |
| Sector: Financials | |
| SubSector: Regional - Southeast Banks | |
| MarketCap: 2661.05 Millions | |
| Recent Price: 21.67 Smart Investing & Trading Score: 43 | |
| Day Percent Change: 1.55% Day Change: 0.33 | |
| Week Change: 1.55% Year-to-date Change: 8.5% | |
| FHN Links: Profile News Message Board | |
| Charts:- Daily , Weekly | |
| Add FHN to Watchlist: View: Get Complete FHN Trend Analysis ➞ | |
 | PKST Peakstone Realty Trust |
| Sector: Financials | |
| SubSector: REIT - Diversified | |
| MarketCap: 1050 Millions | |
| Recent Price: 13.85 Smart Investing & Trading Score: 83 | |
| Day Percent Change: 1.54% Day Change: 0.21 | |
| Week Change: 1.54% Year-to-date Change: 27.4% | |
| PKST Links: Profile News Message Board | |
| Charts:- Daily , Weekly | |
| Add PKST to Watchlist: View: Get Complete PKST Trend Analysis ➞ | |
 | SVC Service Properties Trust |
| Sector: Financials | |
| SubSector: REIT - Hotel/Motel | |
| MarketCap: 1067.74 Millions | |
| Recent Price: 2.63 Smart Investing & Trading Score: 58 | |
| Day Percent Change: 1.54% Day Change: 0.04 | |
| Week Change: 1.54% Year-to-date Change: 4.5% | |
| SVC Links: Profile News Message Board | |
| Charts:- Daily , Weekly | |
| Add SVC to Watchlist: View: Get Complete SVC Trend Analysis ➞ | |
 | OLP One Liberty Properties, Inc. |
| Sector: Financials | |
| SubSector: REIT - Diversified | |
| MarketCap: 378.353 Millions | |
| Recent Price: 22.45 Smart Investing & Trading Score: 25 | |
| Day Percent Change: 1.54% Day Change: 0.34 | |
| Week Change: 1.54% Year-to-date Change: -16.2% | |
| OLP Links: Profile News Message Board | |
| Charts:- Daily , Weekly | |
| Add OLP to Watchlist: View: Get Complete OLP Trend Analysis ➞ | |
 | CATY Cathay General Bancorp |
| Sector: Financials | |
| SubSector: Regional - Pacific Banks | |
| MarketCap: 1781.99 Millions | |
| Recent Price: 45.52 Smart Investing & Trading Score: 43 | |
| Day Percent Change: 1.54% Day Change: 0.69 | |
| Week Change: 1.54% Year-to-date Change: -3.7% | |
| CATY Links: Profile News Message Board | |
| Charts:- Daily , Weekly | |
| Add CATY to Watchlist: View: Get Complete CATY Trend Analysis ➞ | |
 | GL Globe Life Inc. |
| Sector: Financials | |
| SubSector: Life Insurance | |
| MarketCap: 7596.46 Millions | |
| Recent Price: 139.34 Smart Investing & Trading Score: 68 | |
| Day Percent Change: 1.53% Day Change: 2.1 | |
| Week Change: 1.53% Year-to-date Change: 25.5% | |
| GL Links: Profile News Message Board | |
| Charts:- Daily , Weekly | |
| Add GL to Watchlist: View: Get Complete GL Trend Analysis ➞ | |
 | WELL Welltower Inc. |
| Sector: Financials | |
| SubSector: REIT - Healthcare Facilities | |
| MarketCap: 21398.8 Millions | |
| Recent Price: 168.78 Smart Investing & Trading Score: 95 | |
| Day Percent Change: 1.53% Day Change: 2.54 | |
| Week Change: 1.53% Year-to-date Change: 34.5% | |
| WELL Links: Profile News Message Board | |
| Charts:- Daily , Weekly | |
| Add WELL to Watchlist: View: Get Complete WELL Trend Analysis ➞ | |
 | FCF First Commonwealth Financial Corporation |
| Sector: Financials | |
| SubSector: Regional - Northeast Banks | |
| MarketCap: 900.299 Millions | |
| Recent Price: 16.58 Smart Investing & Trading Score: 68 | |
| Day Percent Change: 1.53% Day Change: 0.25 | |
| Week Change: 1.53% Year-to-date Change: -1.3% | |
| FCF Links: Profile News Message Board | |
| Charts:- Daily , Weekly | |
| Add FCF to Watchlist: View: Get Complete FCF Trend Analysis ➞ | |
 | HMN Horace Mann Educators Corporation |
| Sector: Financials | |
| SubSector: Property & Casualty Insurance | |
| MarketCap: 1545.52 Millions | |
| Recent Price: 41.90 Smart Investing & Trading Score: 64 | |
| Day Percent Change: 1.53% Day Change: 0.63 | |
| Week Change: 1.53% Year-to-date Change: 7.7% | |
| HMN Links: Profile News Message Board | |
| Charts:- Daily , Weekly | |
| Add HMN to Watchlist: View: Get Complete HMN Trend Analysis ➞ | |
 | THG The Hanover Insurance Group, Inc. |
| Sector: Financials | |
| SubSector: Property & Casualty Insurance | |
| MarketCap: 3677.92 Millions | |
| Recent Price: 171.39 Smart Investing & Trading Score: 64 | |
| Day Percent Change: 1.52% Day Change: 2.56 | |
| Week Change: 1.52% Year-to-date Change: 11.4% | |
| THG Links: Profile News Message Board | |
| Charts:- Daily , Weekly | |
| Add THG to Watchlist: View: Get Complete THG Trend Analysis ➞ | |
 | PDLB PDL Community Bancorp |
| Sector: Financials | |
| SubSector: REIT - Retail | |
| MarketCap: 206.114 Millions | |
| Recent Price: 14.12 Smart Investing & Trading Score: 66 | |
| Day Percent Change: 1.51% Day Change: 0.21 | |
| Week Change: 1.51% Year-to-date Change: 8.6% | |
| PDLB Links: Profile News Message Board | |
| Charts:- Daily , Weekly | |
| Add PDLB to Watchlist: View: Get Complete PDLB Trend Analysis ➞ | |
 | HTBK Heritage Commerce Corp |
| Sector: Financials | |
| SubSector: Regional - Pacific Banks | |
| MarketCap: 416.129 Millions | |
| Recent Price: 9.39 Smart Investing & Trading Score: 58 | |
| Day Percent Change: 1.51% Day Change: 0.14 | |
| Week Change: 1.51% Year-to-date Change: 1.4% | |
| HTBK Links: Profile News Message Board | |
| Charts:- Daily , Weekly | |
| Add HTBK to Watchlist: View: Get Complete HTBK Trend Analysis ➞ | |
 | THFF First Financial Corporation |
| Sector: Financials | |
| SubSector: Regional - Midwest Banks | |
| MarketCap: 433.07 Millions | |
| Recent Price: 53.23 Smart Investing & Trading Score: 43 | |
| Day Percent Change: 1.51% Day Change: 0.79 | |
| Week Change: 1.51% Year-to-date Change: 17.8% | |
| THFF Links: Profile News Message Board | |
| Charts:- Daily , Weekly | |
| Add THFF to Watchlist: View: Get Complete THFF Trend Analysis ➞ | |
 | PJT PJT Partners Inc. |
| Sector: Financials | |
| SubSector: Asset Management | |
| MarketCap: 1100.93 Millions | |
| Recent Price: 181.73 Smart Investing & Trading Score: 76 | |
| Day Percent Change: 1.51% Day Change: 2.71 | |
| Week Change: 1.51% Year-to-date Change: 15.4% | |
| PJT Links: Profile News Message Board | |
| Charts:- Daily , Weekly | |
| Add PJT to Watchlist: View: Get Complete PJT Trend Analysis ➞ | |
 | AKR Acadia Realty Trust |
| Sector: Financials | |
| SubSector: Property Management | |
| MarketCap: 1367.42 Millions | |
| Recent Price: 18.78 Smart Investing & Trading Score: 50 | |
| Day Percent Change: 1.51% Day Change: 0.28 | |
| Week Change: 1.51% Year-to-date Change: -21.5% | |
| AKR Links: Profile News Message Board | |
| Charts:- Daily , Weekly | |
| Add AKR to Watchlist: View: Get Complete AKR Trend Analysis ➞ | |
 | NHI National Health Investors, Inc. |
| Sector: Financials | |
| SubSector: REIT - Healthcare Facilities | |
| MarketCap: 2156.54 Millions | |
| Recent Price: 72.41 Smart Investing & Trading Score: 77 | |
| Day Percent Change: 1.51% Day Change: 1.08 | |
| Week Change: 1.51% Year-to-date Change: 5.8% | |
| NHI Links: Profile News Message Board | |
| Charts:- Daily , Weekly | |
| Add NHI to Watchlist: View: Get Complete NHI Trend Analysis ➞ | |
 | ACNB ACNB Corporation |
| Sector: Financials | |
| SubSector: Regional - Southwest Banks | |
| MarketCap: 231.065 Millions | |
| Recent Price: 41.95 Smart Investing & Trading Score: 43 | |
| Day Percent Change: 1.5% Day Change: 0.62 | |
| Week Change: 1.5% Year-to-date Change: 6.2% | |
| ACNB Links: Profile News Message Board | |
| Charts:- Daily , Weekly | |
| Add ACNB to Watchlist: View: Get Complete ACNB Trend Analysis ➞ | |
 | CBSH Commerce Bancshares, Inc. |
| Sector: Financials | |
| SubSector: Regional - Midwest Banks | |
| MarketCap: 6201.5 Millions | |
| Recent Price: 60.81 Smart Investing & Trading Score: 25 | |
| Day Percent Change: 1.49% Day Change: 0.89 | |
| Week Change: 1.49% Year-to-date Change: -2.0% | |
| CBSH Links: Profile News Message Board | |
| Charts:- Daily , Weekly | |
| Add CBSH to Watchlist: View: Get Complete CBSH Trend Analysis ➞ | |
 | KIM Kimco Realty Corporation |
| Sector: Financials | |
| SubSector: REIT - Retail | |
| MarketCap: 5358.64 Millions | |
| Recent Price: 21.05 Smart Investing & Trading Score: 0 | |
| Day Percent Change: 1.49% Day Change: 0.31 | |
| Week Change: 1.49% Year-to-date Change: -9.1% | |
| KIM Links: Profile News Message Board | |
| Charts:- Daily , Weekly | |
| Add KIM to Watchlist: View: Get Complete KIM Trend Analysis ➞ | |
 | SBCF Seacoast Banking Corporation of Florida |
| Sector: Financials | |
| SubSector: Regional - Mid-Atlantic Banks | |
| MarketCap: 881.559 Millions | |
| Recent Price: 28.05 Smart Investing & Trading Score: 61 | |
| Day Percent Change: 1.48% Day Change: 0.41 | |
| Week Change: 1.48% Year-to-date Change: 2.6% | |
| SBCF Links: Profile News Message Board | |
| Charts:- Daily , Weekly | |
| Add SBCF to Watchlist: View: Get Complete SBCF Trend Analysis ➞ | |
 | PLMR Palomar Holdings, Inc. |
| Sector: Financials | |
| SubSector: Property & Casualty Insurance | |
| MarketCap: 1297.42 Millions | |
| Recent Price: 131.53 Smart Investing & Trading Score: 35 | |
| Day Percent Change: 1.47% Day Change: 1.91 | |
| Week Change: 1.47% Year-to-date Change: 24.6% | |
| PLMR Links: Profile News Message Board | |
| Charts:- Daily , Weekly | |
| Add PLMR to Watchlist: View: Get Complete PLMR Trend Analysis ➞ | |
 | FOR Forestar Group Inc. |
| Sector: Financials | |
| SubSector: Real Estate Development | |
| MarketCap: 661.019 Millions | |
| Recent Price: 25.52 Smart Investing & Trading Score: 85 | |
| Day Percent Change: 1.47% Day Change: 0.37 | |
| Week Change: 1.47% Year-to-date Change: -1.5% | |
| FOR Links: Profile News Message Board | |
| Charts:- Daily , Weekly | |
| Add FOR to Watchlist: View: Get Complete FOR Trend Analysis ➞ | |
 | JRVR James River Group Holdings, Ltd. |
| Sector: Financials | |
| SubSector: Property & Casualty Insurance | |
| MarketCap: 978.312 Millions | |
| Recent Price: 5.52 Smart Investing & Trading Score: 20 | |
| Day Percent Change: 1.47% Day Change: 0.08 | |
| Week Change: 1.47% Year-to-date Change: 13.6% | |
| JRVR Links: Profile News Message Board | |
| Charts:- Daily , Weekly | |
| Add JRVR to Watchlist: View: Get Complete JRVR Trend Analysis ➞ | |
 | PNFP Pinnacle Financial Partners, Inc. |
| Sector: Financials | |
| SubSector: Regional - Southeast Banks | |
| MarketCap: 2771.75 Millions | |
| Recent Price: 87.40 Smart Investing & Trading Score: 17 | |
| Day Percent Change: 1.47% Day Change: 1.27 | |
| Week Change: 1.47% Year-to-date Change: -23.5% | |
| PNFP Links: Profile News Message Board | |
| Charts:- Daily , Weekly | |
| Add PNFP to Watchlist: View: Get Complete PNFP Trend Analysis ➞ | |
| For tabular summary view of above stock list: Summary View ➞ 0 - 25 , 25 - 50 , 50 - 75 , 75 - 100 , 100 - 125 , 125 - 150 , 150 - 175 , 175 - 200 , 200 - 225 , 225 - 250 , 250 - 275 , 275 - 300 , 300 - 325 , 325 - 350 , 350 - 375 , 375 - 400 , 400 - 425 , 425 - 450 , 450 - 475 , 475 - 500 , 500 - 525 , 525 - 550 , 550 - 575 | ||
| Click To Change The Sort Order: By Market Cap or Company Size Performance: Year-to-date, Week and Day | |
| Select Chart Type: | ||
|
Best Stocks Today 12Stocks.com |
© 2025 12Stocks.com Terms & Conditions Privacy Contact Us
All Information Provided Only For Education And Not To Be Used For Investing or Trading. See Terms & Conditions


One More Thing ... Get Best Stocks Delivered Daily!
Never Ever Miss A Move With Our Top Ten Stocks Lists
Find Best Stocks In Any Market - Bull or Bear Market
Take A Peek At Our Top Ten Stocks Lists: Daily, Weekly, Year-to-Date & Top Trends
Find Best Stocks In Any Market - Bull or Bear Market
Take A Peek At Our Top Ten Stocks Lists: Daily, Weekly, Year-to-Date & Top Trends
Financial Stocks With Best Up Trends [0-bearish to 100-bullish]: Uniti [100], LendingTree [100], Mercury General[100], Perella Weinberg[100], Broadstone Net[100], LendingClub [100], TPG RE[100], CareTrust REIT[100], Stewart Information[100], Healthcare Realty[100], VICI Properties[100]
Best Financial Stocks Year-to-Date:
ESSA Bancorp[3207.77%], Easterly Government[108.45%], Mr. Cooper[86.58%], Heritage Insurance[75.29%], Root [65.29%], Industrial Logistics[64.89%], Rocket [58.42%], Diversified Healthcare[49.61%], ProAssurance [49.59%], Uniti [47.09%], SoFi Technologies[41.62%] Best Financial Stocks This Week:
Uniti [64.77%], Industrial Logistics[11.36%], LendingTree [7.32%], eXp World[7.27%], EverQuote [6.89%], Camping World[6.84%], First Foundation[6.69%], Diamond Hill[5.46%], Mercury General[5.36%], Cipher Mining[5.27%], AlTi Global[5.13%] Best Financial Stocks Daily:
Uniti [64.77%], Industrial Logistics[11.36%], LendingTree [7.32%], eXp World[7.27%], EverQuote [6.89%], Camping World[6.84%], First Foundation[6.69%], Diamond Hill[5.46%], Mercury General[5.36%], Cipher Mining[5.27%], AlTi Global[5.13%]