
 Login Sign Up


| |||||
 |  | ||||

| 12Stocks.com Market Intelligence |
Best Financial Stocks
| In a hurry? Financial Stocks Lists: Performance Trends Table, Stock Charts
Sort Financial stocks: Daily, Weekly, Year-to-Date, Market Cap & Trends. Filter Financial stocks list by size:All Financial Large Mid-Range Small & MicroCap |
| 12Stocks.com Financial Stocks Performances & Trends Daily | |||||||||
|
|  The overall Smart Investing & Trading Score is 33 (0-bearish to 100-bullish) which puts Financial sector in short term bearish to neutral trend. The Smart Investing & Trading Score from previous trading session is 26 and hence an improvement of trend.
| ||||||||
Here are the Smart Investing & Trading Scores of the most requested Financial stocks at 12Stocks.com (click stock name for detailed review):
|


| 12Stocks.com: Investing in Financial sector with Stocks | |
|
The following table helps investors and traders sort through current performance and trends (as measured by Smart Investing & Trading Score) of various
stocks in the Financial sector. Quick View: Move mouse or cursor over stock symbol (ticker) to view short-term Technical chart and over stock name to view long term chart. Click on  to add stock symbol to your watchlist and to add stock symbol to your watchlist and  to view watchlist. Click on any ticker or stock name for detailed market intelligence report for that stock. to view watchlist. Click on any ticker or stock name for detailed market intelligence report for that stock. |
12Stocks.com Performance of Stocks in Financial Sector
| Ticker | Stock Name | Watchlist | Category | Recent Price | Smart Investing & Trading Score | Change % | YTD Change% |
| WSFS | WSFS |   | Regional Banks | 54.27 | 43 | 0.95% | 2.40% |
| FNB | F.N.B | | Regional Banks | 15.00 | 36 | 0.94% | 2.32% |
| HLNE | Hamilton Lane | | Asset Mgmt | 150.90 | 38 | 2.10% | 2.29% |
| NMIH | NMI | | Insurance | 37.60 | 25 | 1.10% | 2.29% |
| FBIZ | First Business | | Regional Banks | 46.96 | 17 | 0.15% | 2.00% |
| HR | Healthcare Realty | | REIT | 16.97 | 100 | 2.60% | 1.96% |
| CADE | Cadence Ban | | Regional Banks | 34.72 | 61 | 2.30% | 1.74% |
| MBWM | Mercantile Bank | | Regional Banks | 44.85 | 43 | 0.92% | 1.63% |
| WSBF | Waterstone | | S&L | 13.32 | 58 | 0.83% | 1.52% |
| CBAN | Colony Bankcorp | | Regional Banks | 16.27 | 36 | 1.62% | 1.50% |
| HTBK | Heritage Commerce | | Regional Banks | 9.39 | 58 | 1.51% | 1.43% |
| GNL | Global Net | | REIT - | 6.92 | 10 | 0.58% | 1.38% |
| CASH | Meta | | S&L | 74.52 | 17 | -0.36% | 1.35% |
| RNST | Renasant | | Banks | 35.99 | 36 | 1.32% | 1.32% |
| PKBK | Parke Bancorp | | Regional Banks | 20.36 | 33 | 0.27% | 1.21% |
| TFC | Truist | | Regional Banks | 43.41 | 48 | 1.05% | 1.20% |
| AXP | American Express | | Credit Services | 298.59 | 43 | 1.47% | 1.18% |
| HBAN | Huntington Bancshares | | Regional Banks | 16.27 | 43 | 1.43% | 1.05% |
| IFN | India Fund | | Asset Mgmt | 15.45 | 25 | -0.58% | 1.03% |
| LMND | Lemonade | | Insurance Property & Casualty | 37.00 | 58 | 1.65% | 0.87% |
| MTB | M&T Bank | | Regional Banks | 188.29 | 43 | 1.78% | 0.86% |
| CZNC | Citizens & Northern | | Regional Banks | 18.51 | 23 | 0.54% | 0.84% |
| TRST | TrustCo Bank | | Regional Banks | 33.19 | 48 | 0.42% | 0.80% |
| STEP | StepStone | | Asset Mgmt | 58.08 | 20 | 2.25% | 0.76% |
| LADR | Ladder Capital | | Mortgage | 11.04 | 66 | 1.56% | 0.68% |
| For chart view version of above stock list: Chart View ➞ 0 - 25 , 25 - 50 , 50 - 75 , 75 - 100 , 100 - 125 , 125 - 150 , 150 - 175 , 175 - 200 , 200 - 225 , 225 - 250 , 250 - 275 , 275 - 300 , 300 - 325 , 325 - 350 , 350 - 375 , 375 - 400 , 400 - 425 , 425 - 450 , 450 - 475 , 475 - 500 , 500 - 525 , 525 - 550 , 550 - 575 | ||
 | Click To Change The Sort Order: By Market Cap or Company Size Performance: Year-to-date, Week and Day |  |
|
Get the most comprehensive stock market coverage daily at 12Stocks.com ➞ Best Stocks Today ➞ Best Stocks Weekly ➞ Best Stocks Year-to-Date ➞ Best Stocks Trends ➞  Best Stocks Today 12Stocks.com Best Nasdaq Stocks ➞ Best S&P 500 Stocks ➞ Best Tech Stocks ➞ Best Biotech Stocks ➞ |
| Detailed Overview of Financial Stocks |
| Financial Technical Overview, Leaders & Laggards, Top Financial ETF Funds & Detailed Financial Stocks List, Charts, Trends & More |
| Financial Sector: Technical Analysis, Trends & YTD Performance | |
| Financial sector is composed of stocks
from banks, brokers, insurance, REITs
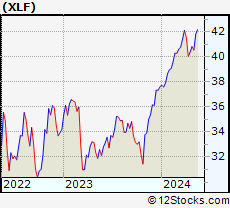
and services subsectors. Financial sector, as represented by XLF, an exchange-traded fund [ETF] that holds basket of Financial stocks (e.g, Bank of America, Goldman Sachs) is up by 7.8% and is currently outperforming the overall market by 0.27% year-to-date. Below is a quick view of Technical charts and trends: |
|
 XLF Weekly Chart |
|
| Long Term Trend: Good | |
| Medium Term Trend: Not Good | |
 XLF Daily Chart |
|
| Short Term Trend: Not Good | |
| Overall Trend Score: 33 | |
| YTD Performance: 7.8% | |
| **Trend Scores & Views Are Only For Educational Purposes And Not For Investing | |
| 12Stocks.com: Top Performing Financial Sector Stocks | ||||||||||||||||||||||||||||||||||||||||||||||||
 The top performing Financial sector stocks year to date are
Now, more recently, over last week, the top performing Financial sector stocks on the move are


|
||||||||||||||||||||||||||||||||||||||||||||||||
| 12Stocks.com: Investing in Financial Sector using Exchange Traded Funds | |
|
The following table shows list of key exchange traded funds (ETF) that
help investors track Financial Index. For detailed view, check out our ETF Funds section of our website. Quick View: Move mouse or cursor over ETF symbol (ticker) to view short-term Technical chart and over ETF name to view long term chart. Click on ticker or stock name for detailed view. Click on to add stock symbol to your watchlist and to view watchlist. |
12Stocks.com List of ETFs that track Financial Index
| Ticker | ETF Name | Watchlist | Recent Price | Smart Investing & Trading Score | Change % | Week % | Year-to-date % |
| XLF | Financial | | 51.91 | 33 | 0.99 | 0.99 | 7.8% |
| IAI | Broker-Dealers & Secs | | 174.97 | 63 | 2.34 | 2.34 | 21.82% |
| KBE | Bank | | 55.98 | 43 | 1.3 | 1.3 | 1.64% |
| FAS | Financial Bull 3X | | 161.82 | 33 | 2.91 | 2.91 | 7.48% |
| FAZ | Financial Bear 3X | | 4.54 | 62 | -2.78 | -2.78 | -27.4% |
| UYG | Financials | | 92.87 | 26 | 1.72 | 1.72 | 9% |
| KIE | Insurance | | 56.42 | 25 | 1.27 | 1.27 | 0.32% |
| 12Stocks.com: Charts, Trends, Fundamental Data and Performances of Financial Stocks | |
|
We now take in-depth look at all Financial stocks including charts, multi-period performances and overall trends (as measured by Smart Investing & Trading Score). One can sort Financial stocks (click link to choose) by Daily, Weekly and by Year-to-Date performances. Also, one can sort by size of the company or by market capitalization. |
| Select Your Default Chart Type: | |||||
| |||||
| Click on stock symbol or name for detailed view. Click on to add stock symbol to your watchlist and to view watchlist. Quick View: Move mouse or cursor over "Daily" to quickly view daily Technical stock chart and over "Weekly" to view weekly Technical stock chart. | |||||

 | WSFS WSFS Financial Corporation |
| Sector: Financials | |
| SubSector: Regional - Mid-Atlantic Banks | |
| MarketCap: 1191.29 Millions | |
| Recent Price: 54.27 Smart Investing & Trading Score: 43 | |
| Day Percent Change: 0.95% Day Change: 0.51 | |
| Week Change: 0.95% Year-to-date Change: 2.4% | |
| WSFS Links: Profile News Message Board | |
| Charts:- Daily , Weekly | |
| Add WSFS to Watchlist: View: Get Complete WSFS Trend Analysis ➞ | |
 | FNB F.N.B. Corporation |
| Sector: Financials | |
| SubSector: Regional - Southeast Banks | |
| MarketCap: 2445.55 Millions | |
| Recent Price: 15.00 Smart Investing & Trading Score: 36 | |
| Day Percent Change: 0.94% Day Change: 0.14 | |
| Week Change: 0.94% Year-to-date Change: 2.3% | |
| FNB Links: Profile News Message Board | |
| Charts:- Daily , Weekly | |
| Add FNB to Watchlist: View: Get Complete FNB Trend Analysis ➞ | |
 | HLNE Hamilton Lane Incorporated |
| Sector: Financials | |
| SubSector: Asset Management | |
| MarketCap: 2484.13 Millions | |
| Recent Price: 150.90 Smart Investing & Trading Score: 38 | |
| Day Percent Change: 2.1% Day Change: 3.11 | |
| Week Change: 2.1% Year-to-date Change: 2.3% | |
| HLNE Links: Profile News Message Board | |
| Charts:- Daily , Weekly | |
| Add HLNE to Watchlist: View: Get Complete HLNE Trend Analysis ➞ | |
 | NMIH NMI Holdings, Inc. |
| Sector: Financials | |
| SubSector: Surety & Title Insurance | |
| MarketCap: 816.018 Millions | |
| Recent Price: 37.60 Smart Investing & Trading Score: 25 | |
| Day Percent Change: 1.1% Day Change: 0.41 | |
| Week Change: 1.1% Year-to-date Change: 2.3% | |
| NMIH Links: Profile News Message Board | |
| Charts:- Daily , Weekly | |
| Add NMIH to Watchlist: View: Get Complete NMIH Trend Analysis ➞ | |
 | FBIZ First Business Financial Services, Inc. |
| Sector: Financials | |
| SubSector: Regional - Midwest Banks | |
| MarketCap: 144.97 Millions | |
| Recent Price: 46.96 Smart Investing & Trading Score: 17 | |
| Day Percent Change: 0.15% Day Change: 0.07 | |
| Week Change: 0.15% Year-to-date Change: 2.0% | |
| FBIZ Links: Profile News Message Board | |
| Charts:- Daily , Weekly | |
| Add FBIZ to Watchlist: View: Get Complete FBIZ Trend Analysis ➞ | |
 | HR Healthcare Realty Trust Incorporated |
| Sector: Financials | |
| SubSector: REIT - Healthcare Facilities | |
| MarketCap: 3718.84 Millions | |
| Recent Price: 16.97 Smart Investing & Trading Score: 100 | |
| Day Percent Change: 2.6% Day Change: 0.43 | |
| Week Change: 2.6% Year-to-date Change: 2.0% | |
| HR Links: Profile News Message Board | |
| Charts:- Daily , Weekly | |
| Add HR to Watchlist: View: Get Complete HR Trend Analysis ➞ | |
 | CADE Cadence Bancorporation |
| Sector: Financials | |
| SubSector: Regional - Southeast Banks | |
| MarketCap: 756.335 Millions | |
| Recent Price: 34.72 Smart Investing & Trading Score: 61 | |
| Day Percent Change: 2.3% Day Change: 0.78 | |
| Week Change: 2.3% Year-to-date Change: 1.7% | |
| CADE Links: Profile News Message Board | |
| Charts:- Daily , Weekly | |
| Add CADE to Watchlist: View: Get Complete CADE Trend Analysis ➞ | |
 | MBWM Mercantile Bank Corporation |
| Sector: Financials | |
| SubSector: Regional - Midwest Banks | |
| MarketCap: 372.77 Millions | |
| Recent Price: 44.85 Smart Investing & Trading Score: 43 | |
| Day Percent Change: 0.92% Day Change: 0.41 | |
| Week Change: 0.92% Year-to-date Change: 1.6% | |
| MBWM Links: Profile News Message Board | |
| Charts:- Daily , Weekly | |
| Add MBWM to Watchlist: View: Get Complete MBWM Trend Analysis ➞ | |
 | WSBF Waterstone Financial, Inc. |
| Sector: Financials | |
| SubSector: Savings & Loans | |
| MarketCap: 371.93 Millions | |
| Recent Price: 13.32 Smart Investing & Trading Score: 58 | |
| Day Percent Change: 0.83% Day Change: 0.11 | |
| Week Change: 0.83% Year-to-date Change: 1.5% | |
| WSBF Links: Profile News Message Board | |
| Charts:- Daily , Weekly | |
| Add WSBF to Watchlist: View: Get Complete WSBF Trend Analysis ➞ | |
 | CBAN Colony Bankcorp, Inc. |
| Sector: Financials | |
| SubSector: Regional - Mid-Atlantic Banks | |
| MarketCap: 115.559 Millions | |
| Recent Price: 16.27 Smart Investing & Trading Score: 36 | |
| Day Percent Change: 1.62% Day Change: 0.26 | |
| Week Change: 1.62% Year-to-date Change: 1.5% | |
| CBAN Links: Profile News Message Board | |
| Charts:- Daily , Weekly | |
| Add CBAN to Watchlist: View: Get Complete CBAN Trend Analysis ➞ | |
 | HTBK Heritage Commerce Corp |
| Sector: Financials | |
| SubSector: Regional - Pacific Banks | |
| MarketCap: 416.129 Millions | |
| Recent Price: 9.39 Smart Investing & Trading Score: 58 | |
| Day Percent Change: 1.51% Day Change: 0.14 | |
| Week Change: 1.51% Year-to-date Change: 1.4% | |
| HTBK Links: Profile News Message Board | |
| Charts:- Daily , Weekly | |
| Add HTBK to Watchlist: View: Get Complete HTBK Trend Analysis ➞ | |
 | GNL Global Net Lease, Inc. |
| Sector: Financials | |
| SubSector: REIT - Diversified | |
| MarketCap: 1362.73 Millions | |
| Recent Price: 6.92 Smart Investing & Trading Score: 10 | |
| Day Percent Change: 0.58% Day Change: 0.04 | |
| Week Change: 0.58% Year-to-date Change: 1.4% | |
| GNL Links: Profile News Message Board | |
| Charts:- Daily , Weekly | |
| Add GNL to Watchlist: View: Get Complete GNL Trend Analysis ➞ | |
 | CASH Meta Financial Group, Inc. |
| Sector: Financials | |
| SubSector: Savings & Loans | |
| MarketCap: 849.33 Millions | |
| Recent Price: 74.52 Smart Investing & Trading Score: 17 | |
| Day Percent Change: -0.36% Day Change: -0.27 | |
| Week Change: -0.36% Year-to-date Change: 1.4% | |
| CASH Links: Profile News Message Board | |
| Charts:- Daily , Weekly | |
| Add CASH to Watchlist: View: Get Complete CASH Trend Analysis ➞ | |
 | RNST Renasant Corporation |
| Sector: Financials | |
| SubSector: Money Center Banks | |
| MarketCap: 1279.39 Millions | |
| Recent Price: 35.99 Smart Investing & Trading Score: 36 | |
| Day Percent Change: 1.32% Day Change: 0.47 | |
| Week Change: 1.32% Year-to-date Change: 1.3% | |
| RNST Links: Profile News Message Board | |
| Charts:- Daily , Weekly | |
| Add RNST to Watchlist: View: Get Complete RNST Trend Analysis ➞ | |
 | PKBK Parke Bancorp, Inc. |
| Sector: Financials | |
| SubSector: Regional - Northeast Banks | |
| MarketCap: 165.799 Millions | |
| Recent Price: 20.36 Smart Investing & Trading Score: 33 | |
| Day Percent Change: 0.27% Day Change: 0.05 | |
| Week Change: 0.27% Year-to-date Change: 1.2% | |
| PKBK Links: Profile News Message Board | |
| Charts:- Daily , Weekly | |
| Add PKBK to Watchlist: View: Get Complete PKBK Trend Analysis ➞ | |
 | TFC Truist Financial Corporation |
| Sector: Financials | |
| SubSector: Regional - Southeast Banks | |
| MarketCap: 44928.5 Millions | |
| Recent Price: 43.41 Smart Investing & Trading Score: 48 | |
| Day Percent Change: 1.05% Day Change: 0.45 | |
| Week Change: 1.05% Year-to-date Change: 1.2% | |
| TFC Links: Profile News Message Board | |
| Charts:- Daily , Weekly | |
| Add TFC to Watchlist: View: Get Complete TFC Trend Analysis ➞ | |
 | AXP American Express Company |
| Sector: Financials | |
| SubSector: Credit Services | |
| MarketCap: 68388 Millions | |
| Recent Price: 298.59 Smart Investing & Trading Score: 43 | |
| Day Percent Change: 1.47% Day Change: 4.32 | |
| Week Change: 1.47% Year-to-date Change: 1.2% | |
| AXP Links: Profile News Message Board | |
| Charts:- Daily , Weekly | |
| Add AXP to Watchlist: View: Get Complete AXP Trend Analysis ➞ | |
 | HBAN Huntington Bancshares Incorporated |
| Sector: Financials | |
| SubSector: Regional - Midwest Banks | |
| MarketCap: 8468.1 Millions | |
| Recent Price: 16.27 Smart Investing & Trading Score: 43 | |
| Day Percent Change: 1.43% Day Change: 0.23 | |
| Week Change: 1.43% Year-to-date Change: 1.1% | |
| HBAN Links: Profile News Message Board | |
| Charts:- Daily , Weekly | |
| Add HBAN to Watchlist: View: Get Complete HBAN Trend Analysis ➞ | |
 | IFN The India Fund, Inc. |
| Sector: Financials | |
| SubSector: Asset Management | |
| MarketCap: 344.303 Millions | |
| Recent Price: 15.45 Smart Investing & Trading Score: 25 | |
| Day Percent Change: -0.58% Day Change: -0.09 | |
| Week Change: -0.58% Year-to-date Change: 1.0% | |
| IFN Links: Profile News Message Board | |
| Charts:- Daily , Weekly | |
| Add IFN to Watchlist: View: Get Complete IFN Trend Analysis ➞ | |
 | LMND Lemonade, Inc. |
| Sector: Financials | |
| SubSector: Insurance Property & Casualty | |
| MarketCap: 56457 Millions | |
| Recent Price: 37.00 Smart Investing & Trading Score: 58 | |
| Day Percent Change: 1.65% Day Change: 0.6 | |
| Week Change: 1.65% Year-to-date Change: 0.9% | |
| LMND Links: Profile News Message Board | |
| Charts:- Daily , Weekly | |
| Add LMND to Watchlist: View: Get Complete LMND Trend Analysis ➞ | |
 | MTB M&T Bank Corporation |
| Sector: Financials | |
| SubSector: Regional - Northeast Banks | |
| MarketCap: 13950.9 Millions | |
| Recent Price: 188.29 Smart Investing & Trading Score: 43 | |
| Day Percent Change: 1.78% Day Change: 3.3 | |
| Week Change: 1.78% Year-to-date Change: 0.9% | |
| MTB Links: Profile News Message Board | |
| Charts:- Daily , Weekly | |
| Add MTB to Watchlist: View: Get Complete MTB Trend Analysis ➞ | |
 | CZNC Citizens & Northern Corporation |
| Sector: Financials | |
| SubSector: Regional - Mid-Atlantic Banks | |
| MarketCap: 274.459 Millions | |
| Recent Price: 18.51 Smart Investing & Trading Score: 23 | |
| Day Percent Change: 0.54% Day Change: 0.1 | |
| Week Change: 0.54% Year-to-date Change: 0.8% | |
| CZNC Links: Profile News Message Board | |
| Charts:- Daily , Weekly | |
| Add CZNC to Watchlist: View: Get Complete CZNC Trend Analysis ➞ | |
 | TRST TrustCo Bank Corp NY |
| Sector: Financials | |
| SubSector: Regional - Northeast Banks | |
| MarketCap: 543.999 Millions | |
| Recent Price: 33.19 Smart Investing & Trading Score: 48 | |
| Day Percent Change: 0.42% Day Change: 0.14 | |
| Week Change: 0.42% Year-to-date Change: 0.8% | |
| TRST Links: Profile News Message Board | |
| Charts:- Daily , Weekly | |
| Add TRST to Watchlist: View: Get Complete TRST Trend Analysis ➞ | |
 | STEP StepStone Group Inc. |
| Sector: Financials | |
| SubSector: Asset Management | |
| MarketCap: 30757 Millions | |
| Recent Price: 58.08 Smart Investing & Trading Score: 20 | |
| Day Percent Change: 2.25% Day Change: 1.28 | |
| Week Change: 2.25% Year-to-date Change: 0.8% | |
| STEP Links: Profile News Message Board | |
| Charts:- Daily , Weekly | |
| Add STEP to Watchlist: View: Get Complete STEP Trend Analysis ➞ | |
 | LADR Ladder Capital Corp |
| Sector: Financials | |
| SubSector: Mortgage Investment | |
| MarketCap: 660.039 Millions | |
| Recent Price: 11.04 Smart Investing & Trading Score: 66 | |
| Day Percent Change: 1.56% Day Change: 0.17 | |
| Week Change: 1.56% Year-to-date Change: 0.7% | |
| LADR Links: Profile News Message Board | |
| Charts:- Daily , Weekly | |
| Add LADR to Watchlist: View: Get Complete LADR Trend Analysis ➞ | |
| For tabular summary view of above stock list: Summary View ➞ 0 - 25 , 25 - 50 , 50 - 75 , 75 - 100 , 100 - 125 , 125 - 150 , 150 - 175 , 175 - 200 , 200 - 225 , 225 - 250 , 250 - 275 , 275 - 300 , 300 - 325 , 325 - 350 , 350 - 375 , 375 - 400 , 400 - 425 , 425 - 450 , 450 - 475 , 475 - 500 , 500 - 525 , 525 - 550 , 550 - 575 | ||
| Click To Change The Sort Order: By Market Cap or Company Size Performance: Year-to-date, Week and Day | |
| Select Chart Type: | ||
|
Best Stocks Today 12Stocks.com |
© 2025 12Stocks.com Terms & Conditions Privacy Contact Us
All Information Provided Only For Education And Not To Be Used For Investing or Trading. See Terms & Conditions


One More Thing ... Get Best Stocks Delivered Daily!
Never Ever Miss A Move With Our Top Ten Stocks Lists
Find Best Stocks In Any Market - Bull or Bear Market
Take A Peek At Our Top Ten Stocks Lists: Daily, Weekly, Year-to-Date & Top Trends
Find Best Stocks In Any Market - Bull or Bear Market
Take A Peek At Our Top Ten Stocks Lists: Daily, Weekly, Year-to-Date & Top Trends
Financial Stocks With Best Up Trends [0-bearish to 100-bullish]: Uniti [100], LendingTree [100], Mercury General[100], Perella Weinberg[100], Broadstone Net[100], LendingClub [100], TPG RE[100], CareTrust REIT[100], Stewart Information[100], Healthcare Realty[100], VICI Properties[100]
Best Financial Stocks Year-to-Date:
ESSA Bancorp[3207.77%], Easterly Government[108.45%], Mr. Cooper[86.58%], Heritage Insurance[75.29%], Root [65.29%], Industrial Logistics[64.89%], Rocket [58.42%], Diversified Healthcare[49.61%], ProAssurance [49.59%], Uniti [47.09%], SoFi Technologies[41.62%] Best Financial Stocks This Week:
Uniti [64.77%], Industrial Logistics[11.36%], LendingTree [7.32%], eXp World[7.27%], EverQuote [6.89%], Camping World[6.84%], First Foundation[6.69%], Diamond Hill[5.46%], Mercury General[5.36%], Cipher Mining[5.27%], AlTi Global[5.13%] Best Financial Stocks Daily:
Uniti [64.77%], Industrial Logistics[11.36%], LendingTree [7.32%], eXp World[7.27%], EverQuote [6.89%], Camping World[6.84%], First Foundation[6.69%], Diamond Hill[5.46%], Mercury General[5.36%], Cipher Mining[5.27%], AlTi Global[5.13%]