
 Login Sign Up


| |||||
 |  | ||||

| 12Stocks.com Market Intelligence |
Best Financial Stocks
| In a hurry? Financial Stocks Lists: Performance Trends Table, Stock Charts
Sort Financial stocks: Daily, Weekly, Year-to-Date, Market Cap & Trends. Filter Financial stocks list by size:All Financial Large Mid-Range Small & MicroCap |
| 12Stocks.com Financial Stocks Performances & Trends Daily | |||||||||
|
|  The overall Smart Investing & Trading Score is 33 (0-bearish to 100-bullish) which puts Financial sector in short term bearish to neutral trend. The Smart Investing & Trading Score from previous trading session is 26 and hence an improvement of trend.
| ||||||||
Here are the Smart Investing & Trading Scores of the most requested Financial stocks at 12Stocks.com (click stock name for detailed review):
|


| 12Stocks.com: Investing in Financial sector with Stocks | |
|
The following table helps investors and traders sort through current performance and trends (as measured by Smart Investing & Trading Score) of various
stocks in the Financial sector. Quick View: Move mouse or cursor over stock symbol (ticker) to view short-term Technical chart and over stock name to view long term chart. Click on  to add stock symbol to your watchlist and to add stock symbol to your watchlist and  to view watchlist. Click on any ticker or stock name for detailed market intelligence report for that stock. to view watchlist. Click on any ticker or stock name for detailed market intelligence report for that stock. |
12Stocks.com Performance of Stocks in Financial Sector
| Ticker | Stock Name | Watchlist | Category | Recent Price | Smart Investing & Trading Score | Change % | YTD Change% |
| STAG | STAG Industrial |   | REIT - Industrial | 34.87 | 35 | 1.40% | 4.20% |
| TFSL | TFS | | Regional Banks | 12.79 | 25 | -0.31% | 4.14% |
| ALEX | Alexander & Baldwin | | Real Estatet | 18.23 | 88 | 1.33% | 4.09% |
| FNF | Fidelity National | | Insurance | 57.96 | 90 | 2.44% | 4.04% |
| TCBI | Texas Capital | | Regional - Southwest Banks | 81.31 | 31 | 0.48% | 3.98% |
| SYBT | Stock Yards | | Regional Banks | 73.90 | 30 | 0.43% | 3.67% |
| TSBK | Timberland Bancorp | | S&L | 31.37 | 43 | 1.29% | 3.66% |
| MPW | Medical Properties | | REIT | 4.04 | 25 | -0.49% | 3.66% |
| CHCO | City Holding | | Regional Banks | 120.95 | 33 | 0.16% | 3.51% |
| TOWN | TowneBank | | Regional Banks | 34.99 | 51 | 1.45% | 3.48% |
| FMBH | First Mid | | Regional Banks | 37.81 | 53 | 0.93% | 3.34% |
| WBS | Webster | | Regional Banks | 56.62 | 36 | 1.09% | 3.21% |
| CHMG | Chemung | | Regional Banks | 50.02 | 43 | 1.79% | 3.16% |
| SUI | Sun Communities | | REIT | 125.84 | 88 | 1.24% | 3.08% |
| LAMR | Lamar Advertising | | REIT - | 123.71 | 61 | 2.32% | 3.06% |
| ASB | Associated Banc-Corp | | Regional Banks | 24.39 | 43 | 1.25% | 3.00% |
| SFST | Southern First | | Banks | 40.93 | 51 | 1.09% | 2.97% |
| PGR | Progressive | | Insurance | 241.58 | 28 | 0.20% | 2.87% |
| LTC | LTC Properties | | REIT | 34.74 | 32 | 1.31% | 2.77% |
| EGP | East Properties | | REIT - Industrial | 163.60 | 44 | 1.01% | 2.75% |
| SBCF | Seacoast Banking | | Regional Banks | 28.05 | 61 | 1.48% | 2.62% |
| NBN | Northeast Bank | | Regional Banks | 94.02 | 26 | 1.10% | 2.51% |
| SRCE | 1st Source | | Regional Banks | 59.50 | 17 | 1.21% | 2.51% |
| CTBI | Community Trust | | Regional Banks | 53.81 | 36 | 1.32% | 2.42% |
| JHG | Janus Henderson | | Asset Mgmt | 43.17 | 70 | 2.06% | 2.40% |
| For chart view version of above stock list: Chart View ➞ 0 - 25 , 25 - 50 , 50 - 75 , 75 - 100 , 100 - 125 , 125 - 150 , 150 - 175 , 175 - 200 , 200 - 225 , 225 - 250 , 250 - 275 , 275 - 300 , 300 - 325 , 325 - 350 , 350 - 375 , 375 - 400 , 400 - 425 , 425 - 450 , 450 - 475 , 475 - 500 , 500 - 525 , 525 - 550 , 550 - 575 | ||
 | Click To Change The Sort Order: By Market Cap or Company Size Performance: Year-to-date, Week and Day |  |
|
Get the most comprehensive stock market coverage daily at 12Stocks.com ➞ Best Stocks Today ➞ Best Stocks Weekly ➞ Best Stocks Year-to-Date ➞ Best Stocks Trends ➞  Best Stocks Today 12Stocks.com Best Nasdaq Stocks ➞ Best S&P 500 Stocks ➞ Best Tech Stocks ➞ Best Biotech Stocks ➞ |
| Detailed Overview of Financial Stocks |
| Financial Technical Overview, Leaders & Laggards, Top Financial ETF Funds & Detailed Financial Stocks List, Charts, Trends & More |
| Financial Sector: Technical Analysis, Trends & YTD Performance | |
| Financial sector is composed of stocks
from banks, brokers, insurance, REITs
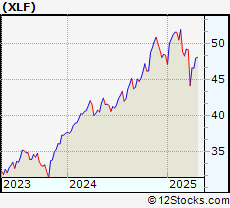
and services subsectors. Financial sector, as represented by XLF, an exchange-traded fund [ETF] that holds basket of Financial stocks (e.g, Bank of America, Goldman Sachs) is up by 7.8% and is currently outperforming the overall market by 0.27% year-to-date. Below is a quick view of Technical charts and trends: |
|
 XLF Weekly Chart |
|
| Long Term Trend: Good | |
| Medium Term Trend: Not Good | |
 XLF Daily Chart |
|
| Short Term Trend: Not Good | |
| Overall Trend Score: 33 | |
| YTD Performance: 7.8% | |
| **Trend Scores & Views Are Only For Educational Purposes And Not For Investing | |
| 12Stocks.com: Top Performing Financial Sector Stocks | ||||||||||||||||||||||||||||||||||||||||||||||||
 The top performing Financial sector stocks year to date are
Now, more recently, over last week, the top performing Financial sector stocks on the move are


|
||||||||||||||||||||||||||||||||||||||||||||||||
| 12Stocks.com: Investing in Financial Sector using Exchange Traded Funds | |
|
The following table shows list of key exchange traded funds (ETF) that
help investors track Financial Index. For detailed view, check out our ETF Funds section of our website. Quick View: Move mouse or cursor over ETF symbol (ticker) to view short-term Technical chart and over ETF name to view long term chart. Click on ticker or stock name for detailed view. Click on to add stock symbol to your watchlist and to view watchlist. |
12Stocks.com List of ETFs that track Financial Index
| Ticker | ETF Name | Watchlist | Recent Price | Smart Investing & Trading Score | Change % | Week % | Year-to-date % |
| XLF | Financial | | 51.91 | 33 | 0.99 | 0.99 | 7.8% |
| IAI | Broker-Dealers & Secs | | 174.97 | 63 | 2.34 | 2.34 | 21.82% |
| KBE | Bank | | 55.98 | 43 | 1.3 | 1.3 | 1.64% |
| FAS | Financial Bull 3X | | 161.82 | 33 | 2.91 | 2.91 | 7.48% |
| FAZ | Financial Bear 3X | | 4.54 | 62 | -2.78 | -2.78 | -27.4% |
| UYG | Financials | | 92.87 | 26 | 1.72 | 1.72 | 9% |
| KIE | Insurance | | 56.42 | 25 | 1.27 | 1.27 | 0.32% |
| 12Stocks.com: Charts, Trends, Fundamental Data and Performances of Financial Stocks | |
|
We now take in-depth look at all Financial stocks including charts, multi-period performances and overall trends (as measured by Smart Investing & Trading Score). One can sort Financial stocks (click link to choose) by Daily, Weekly and by Year-to-Date performances. Also, one can sort by size of the company or by market capitalization. |
| Select Your Default Chart Type: | |||||
| |||||
| Click on stock symbol or name for detailed view. Click on to add stock symbol to your watchlist and to view watchlist. Quick View: Move mouse or cursor over "Daily" to quickly view daily Technical stock chart and over "Weekly" to view weekly Technical stock chart. | |||||

 | STAG STAG Industrial, Inc. |
| Sector: Financials | |
| SubSector: REIT - Industrial | |
| MarketCap: 3767.49 Millions | |
| Recent Price: 34.87 Smart Investing & Trading Score: 35 | |
| Day Percent Change: 1.4% Day Change: 0.48 | |
| Week Change: 1.4% Year-to-date Change: 4.2% | |
| STAG Links: Profile News Message Board | |
| Charts:- Daily , Weekly | |
| Add STAG to Watchlist: View: Get Complete STAG Trend Analysis ➞ | |
 | TFSL TFS Financial Corporation |
| Sector: Financials | |
| SubSector: Regional - Midwest Banks | |
| MarketCap: 4539.1 Millions | |
| Recent Price: 12.79 Smart Investing & Trading Score: 25 | |
| Day Percent Change: -0.31% Day Change: -0.04 | |
| Week Change: -0.31% Year-to-date Change: 4.1% | |
| TFSL Links: Profile News Message Board | |
| Charts:- Daily , Weekly | |
| Add TFSL to Watchlist: View: Get Complete TFSL Trend Analysis ➞ | |
 | ALEX Alexander & Baldwin, Inc. |
| Sector: Financials | |
| SubSector: Real Estate Development | |
| MarketCap: 751.419 Millions | |
| Recent Price: 18.23 Smart Investing & Trading Score: 88 | |
| Day Percent Change: 1.33% Day Change: 0.24 | |
| Week Change: 1.33% Year-to-date Change: 4.1% | |
| ALEX Links: Profile News Message Board | |
| Charts:- Daily , Weekly | |
| Add ALEX to Watchlist: View: Get Complete ALEX Trend Analysis ➞ | |
 | FNF Fidelity National Financial, Inc. |
| Sector: Financials | |
| SubSector: Surety & Title Insurance | |
| MarketCap: 6532.18 Millions | |
| Recent Price: 57.96 Smart Investing & Trading Score: 90 | |
| Day Percent Change: 2.44% Day Change: 1.38 | |
| Week Change: 2.44% Year-to-date Change: 4.0% | |
| FNF Links: Profile News Message Board | |
| Charts:- Daily , Weekly | |
| Add FNF to Watchlist: View: Get Complete FNF Trend Analysis ➞ | |
 | TCBI Texas Capital Bancshares, Inc. |
| Sector: Financials | |
| SubSector: Regional - Southwest Banks | |
| MarketCap: 1202.75 Millions | |
| Recent Price: 81.31 Smart Investing & Trading Score: 31 | |
| Day Percent Change: 0.48% Day Change: 0.39 | |
| Week Change: 0.48% Year-to-date Change: 4.0% | |
| TCBI Links: Profile News Message Board | |
| Charts:- Daily , Weekly | |
| Add TCBI to Watchlist: View: Get Complete TCBI Trend Analysis ➞ | |
 | SYBT Stock Yards Bancorp, Inc. |
| Sector: Financials | |
| SubSector: Regional - Southeast Banks | |
| MarketCap: 629.235 Millions | |
| Recent Price: 73.90 Smart Investing & Trading Score: 30 | |
| Day Percent Change: 0.43% Day Change: 0.32 | |
| Week Change: 0.43% Year-to-date Change: 3.7% | |
| SYBT Links: Profile News Message Board | |
| Charts:- Daily , Weekly | |
| Add SYBT to Watchlist: View: Get Complete SYBT Trend Analysis ➞ | |
 | TSBK Timberland Bancorp, Inc. |
| Sector: Financials | |
| SubSector: Savings & Loans | |
| MarketCap: 155.03 Millions | |
| Recent Price: 31.37 Smart Investing & Trading Score: 43 | |
| Day Percent Change: 1.29% Day Change: 0.4 | |
| Week Change: 1.29% Year-to-date Change: 3.7% | |
| TSBK Links: Profile News Message Board | |
| Charts:- Daily , Weekly | |
| Add TSBK to Watchlist: View: Get Complete TSBK Trend Analysis ➞ | |
 | MPW Medical Properties Trust, Inc. |
| Sector: Financials | |
| SubSector: REIT - Healthcare Facilities | |
| MarketCap: 8586.74 Millions | |
| Recent Price: 4.04 Smart Investing & Trading Score: 25 | |
| Day Percent Change: -0.49% Day Change: -0.02 | |
| Week Change: -0.49% Year-to-date Change: 3.7% | |
| MPW Links: Profile News Message Board | |
| Charts:- Daily , Weekly | |
| Add MPW to Watchlist: View: Get Complete MPW Trend Analysis ➞ | |
 | CHCO City Holding Company |
| Sector: Financials | |
| SubSector: Regional - Mid-Atlantic Banks | |
| MarketCap: 1059.59 Millions | |
| Recent Price: 120.95 Smart Investing & Trading Score: 33 | |
| Day Percent Change: 0.16% Day Change: 0.19 | |
| Week Change: 0.16% Year-to-date Change: 3.5% | |
| CHCO Links: Profile News Message Board | |
| Charts:- Daily , Weekly | |
| Add CHCO to Watchlist: View: Get Complete CHCO Trend Analysis ➞ | |
 | TOWN TowneBank |
| Sector: Financials | |
| SubSector: Regional - Mid-Atlantic Banks | |
| MarketCap: 1344.09 Millions | |
| Recent Price: 34.99 Smart Investing & Trading Score: 51 | |
| Day Percent Change: 1.45% Day Change: 0.5 | |
| Week Change: 1.45% Year-to-date Change: 3.5% | |
| TOWN Links: Profile News Message Board | |
| Charts:- Daily , Weekly | |
| Add TOWN to Watchlist: View: Get Complete TOWN Trend Analysis ➞ | |
 | FMBH First Mid Bancshares, Inc. |
| Sector: Financials | |
| SubSector: Regional - Midwest Banks | |
| MarketCap: 373.27 Millions | |
| Recent Price: 37.81 Smart Investing & Trading Score: 53 | |
| Day Percent Change: 0.93% Day Change: 0.35 | |
| Week Change: 0.93% Year-to-date Change: 3.3% | |
| FMBH Links: Profile News Message Board | |
| Charts:- Daily , Weekly | |
| Add FMBH to Watchlist: View: Get Complete FMBH Trend Analysis ➞ | |
 | WBS Webster Financial Corporation |
| Sector: Financials | |
| SubSector: Regional - Northeast Banks | |
| MarketCap: 2111.59 Millions | |
| Recent Price: 56.62 Smart Investing & Trading Score: 36 | |
| Day Percent Change: 1.09% Day Change: 0.61 | |
| Week Change: 1.09% Year-to-date Change: 3.2% | |
| WBS Links: Profile News Message Board | |
| Charts:- Daily , Weekly | |
| Add WBS to Watchlist: View: Get Complete WBS Trend Analysis ➞ | |
 | CHMG Chemung Financial Corporation |
| Sector: Financials | |
| SubSector: Regional - Pacific Banks | |
| MarketCap: 142.229 Millions | |
| Recent Price: 50.02 Smart Investing & Trading Score: 43 | |
| Day Percent Change: 1.79% Day Change: 0.88 | |
| Week Change: 1.79% Year-to-date Change: 3.2% | |
| CHMG Links: Profile News Message Board | |
| Charts:- Daily , Weekly | |
| Add CHMG to Watchlist: View: Get Complete CHMG Trend Analysis ➞ | |
 | SUI Sun Communities, Inc. |
| Sector: Financials | |
| SubSector: REIT - Residential | |
| MarketCap: 11280.5 Millions | |
| Recent Price: 125.84 Smart Investing & Trading Score: 88 | |
| Day Percent Change: 1.24% Day Change: 1.54 | |
| Week Change: 1.24% Year-to-date Change: 3.1% | |
| SUI Links: Profile News Message Board | |
| Charts:- Daily , Weekly | |
| Add SUI to Watchlist: View: Get Complete SUI Trend Analysis ➞ | |
 | LAMR Lamar Advertising Company (REIT) |
| Sector: Financials | |
| SubSector: REIT - Diversified | |
| MarketCap: 4838.33 Millions | |
| Recent Price: 123.71 Smart Investing & Trading Score: 61 | |
| Day Percent Change: 2.32% Day Change: 2.8 | |
| Week Change: 2.32% Year-to-date Change: 3.1% | |
| LAMR Links: Profile News Message Board | |
| Charts:- Daily , Weekly | |
| Add LAMR to Watchlist: View: Get Complete LAMR Trend Analysis ➞ | |
 | ASB Associated Banc-Corp |
| Sector: Financials | |
| SubSector: Regional - Midwest Banks | |
| MarketCap: 1904.8 Millions | |
| Recent Price: 24.39 Smart Investing & Trading Score: 43 | |
| Day Percent Change: 1.25% Day Change: 0.3 | |
| Week Change: 1.25% Year-to-date Change: 3.0% | |
| ASB Links: Profile News Message Board | |
| Charts:- Daily , Weekly | |
| Add ASB to Watchlist: View: Get Complete ASB Trend Analysis ➞ | |
 | SFST Southern First Bancshares, Inc. |
| Sector: Financials | |
| SubSector: Money Center Banks | |
| MarketCap: 189.099 Millions | |
| Recent Price: 40.93 Smart Investing & Trading Score: 51 | |
| Day Percent Change: 1.09% Day Change: 0.44 | |
| Week Change: 1.09% Year-to-date Change: 3.0% | |
| SFST Links: Profile News Message Board | |
| Charts:- Daily , Weekly | |
| Add SFST to Watchlist: View: Get Complete SFST Trend Analysis ➞ | |
 | PGR The Progressive Corporation |
| Sector: Financials | |
| SubSector: Property & Casualty Insurance | |
| MarketCap: 43112 Millions | |
| Recent Price: 241.58 Smart Investing & Trading Score: 28 | |
| Day Percent Change: 0.2% Day Change: 0.49 | |
| Week Change: 0.2% Year-to-date Change: 2.9% | |
| PGR Links: Profile News Message Board | |
| Charts:- Daily , Weekly | |
| Add PGR to Watchlist: View: Get Complete PGR Trend Analysis ➞ | |
 | LTC LTC Properties, Inc. |
| Sector: Financials | |
| SubSector: REIT - Healthcare Facilities | |
| MarketCap: 1369.24 Millions | |
| Recent Price: 34.74 Smart Investing & Trading Score: 32 | |
| Day Percent Change: 1.31% Day Change: 0.45 | |
| Week Change: 1.31% Year-to-date Change: 2.8% | |
| LTC Links: Profile News Message Board | |
| Charts:- Daily , Weekly | |
| Add LTC to Watchlist: View: Get Complete LTC Trend Analysis ➞ | |
 | EGP EastGroup Properties, Inc. |
| Sector: Financials | |
| SubSector: REIT - Industrial | |
| MarketCap: 4034.29 Millions | |
| Recent Price: 163.60 Smart Investing & Trading Score: 44 | |
| Day Percent Change: 1.01% Day Change: 1.63 | |
| Week Change: 1.01% Year-to-date Change: 2.8% | |
| EGP Links: Profile News Message Board | |
| Charts:- Daily , Weekly | |
| Add EGP to Watchlist: View: Get Complete EGP Trend Analysis ➞ | |
 | SBCF Seacoast Banking Corporation of Florida |
| Sector: Financials | |
| SubSector: Regional - Mid-Atlantic Banks | |
| MarketCap: 881.559 Millions | |
| Recent Price: 28.05 Smart Investing & Trading Score: 61 | |
| Day Percent Change: 1.48% Day Change: 0.41 | |
| Week Change: 1.48% Year-to-date Change: 2.6% | |
| SBCF Links: Profile News Message Board | |
| Charts:- Daily , Weekly | |
| Add SBCF to Watchlist: View: Get Complete SBCF Trend Analysis ➞ | |
 | NBN Northeast Bank |
| Sector: Financials | |
| SubSector: Regional - Northeast Banks | |
| MarketCap: 114.199 Millions | |
| Recent Price: 94.02 Smart Investing & Trading Score: 26 | |
| Day Percent Change: 1.1% Day Change: 1.02 | |
| Week Change: 1.1% Year-to-date Change: 2.5% | |
| NBN Links: Profile News Message Board | |
| Charts:- Daily , Weekly | |
| Add NBN to Watchlist: View: Get Complete NBN Trend Analysis ➞ | |
 | SRCE 1st Source Corporation |
| Sector: Financials | |
| SubSector: Regional - Midwest Banks | |
| MarketCap: 784.77 Millions | |
| Recent Price: 59.50 Smart Investing & Trading Score: 17 | |
| Day Percent Change: 1.21% Day Change: 0.71 | |
| Week Change: 1.21% Year-to-date Change: 2.5% | |
| SRCE Links: Profile News Message Board | |
| Charts:- Daily , Weekly | |
| Add SRCE to Watchlist: View: Get Complete SRCE Trend Analysis ➞ | |
 | CTBI Community Trust Bancorp, Inc. |
| Sector: Financials | |
| SubSector: Regional - Southeast Banks | |
| MarketCap: 608.435 Millions | |
| Recent Price: 53.81 Smart Investing & Trading Score: 36 | |
| Day Percent Change: 1.32% Day Change: 0.7 | |
| Week Change: 1.32% Year-to-date Change: 2.4% | |
| CTBI Links: Profile News Message Board | |
| Charts:- Daily , Weekly | |
| Add CTBI to Watchlist: View: Get Complete CTBI Trend Analysis ➞ | |
 | JHG Janus Henderson Group plc |
| Sector: Financials | |
| SubSector: Asset Management | |
| MarketCap: 2992.33 Millions | |
| Recent Price: 43.17 Smart Investing & Trading Score: 70 | |
| Day Percent Change: 2.06% Day Change: 0.87 | |
| Week Change: 2.06% Year-to-date Change: 2.4% | |
| JHG Links: Profile News Message Board | |
| Charts:- Daily , Weekly | |
| Add JHG to Watchlist: View: Get Complete JHG Trend Analysis ➞ | |
| For tabular summary view of above stock list: Summary View ➞ 0 - 25 , 25 - 50 , 50 - 75 , 75 - 100 , 100 - 125 , 125 - 150 , 150 - 175 , 175 - 200 , 200 - 225 , 225 - 250 , 250 - 275 , 275 - 300 , 300 - 325 , 325 - 350 , 350 - 375 , 375 - 400 , 400 - 425 , 425 - 450 , 450 - 475 , 475 - 500 , 500 - 525 , 525 - 550 , 550 - 575 | ||
| Click To Change The Sort Order: By Market Cap or Company Size Performance: Year-to-date, Week and Day | |
| Select Chart Type: | ||
|
Best Stocks Today 12Stocks.com |
© 2025 12Stocks.com Terms & Conditions Privacy Contact Us
All Information Provided Only For Education And Not To Be Used For Investing or Trading. See Terms & Conditions


One More Thing ... Get Best Stocks Delivered Daily!
Never Ever Miss A Move With Our Top Ten Stocks Lists
Find Best Stocks In Any Market - Bull or Bear Market
Take A Peek At Our Top Ten Stocks Lists: Daily, Weekly, Year-to-Date & Top Trends
Find Best Stocks In Any Market - Bull or Bear Market
Take A Peek At Our Top Ten Stocks Lists: Daily, Weekly, Year-to-Date & Top Trends
Financial Stocks With Best Up Trends [0-bearish to 100-bullish]: Uniti [100], LendingTree [100], Mercury General[100], Perella Weinberg[100], Broadstone Net[100], LendingClub [100], TPG RE[100], CareTrust REIT[100], Stewart Information[100], Healthcare Realty[100], VICI Properties[100]
Best Financial Stocks Year-to-Date:
ESSA Bancorp[3207.77%], Easterly Government[108.45%], Mr. Cooper[86.58%], Heritage Insurance[75.29%], Root [65.29%], Industrial Logistics[64.89%], Rocket [58.42%], Diversified Healthcare[49.61%], ProAssurance [49.59%], Uniti [47.09%], SoFi Technologies[41.62%] Best Financial Stocks This Week:
Uniti [64.77%], Industrial Logistics[11.36%], LendingTree [7.32%], eXp World[7.27%], EverQuote [6.89%], Camping World[6.84%], First Foundation[6.69%], Diamond Hill[5.46%], Mercury General[5.36%], Cipher Mining[5.27%], AlTi Global[5.13%] Best Financial Stocks Daily:
Uniti [64.77%], Industrial Logistics[11.36%], LendingTree [7.32%], eXp World[7.27%], EverQuote [6.89%], Camping World[6.84%], First Foundation[6.69%], Diamond Hill[5.46%], Mercury General[5.36%], Cipher Mining[5.27%], AlTi Global[5.13%]