
 Login Sign Up


| |||||
 |  | ||||

| 12Stocks.com Market Intelligence |
Best Financial Stocks
| In a hurry? Financial Stocks Lists: Performance Trends Table, Stock Charts
Sort Financial stocks: Daily, Weekly, Year-to-Date, Market Cap & Trends. Filter Financial stocks list by size:All Financial Large Mid-Range Small & MicroCap |
| 12Stocks.com Financial Stocks Performances & Trends Daily | |||||||||
|
|  The overall Smart Investing & Trading Score is 33 (0-bearish to 100-bullish) which puts Financial sector in short term bearish to neutral trend. The Smart Investing & Trading Score from previous trading session is 26 and hence an improvement of trend.
| ||||||||
Here are the Smart Investing & Trading Scores of the most requested Financial stocks at 12Stocks.com (click stock name for detailed review):
|


| 12Stocks.com: Investing in Financial sector with Stocks | |
|
The following table helps investors and traders sort through current performance and trends (as measured by Smart Investing & Trading Score) of various
stocks in the Financial sector. Quick View: Move mouse or cursor over stock symbol (ticker) to view short-term Technical chart and over stock name to view long term chart. Click on  to add stock symbol to your watchlist and to add stock symbol to your watchlist and  to view watchlist. Click on any ticker or stock name for detailed market intelligence report for that stock. to view watchlist. Click on any ticker or stock name for detailed market intelligence report for that stock. |
12Stocks.com Performance of Stocks in Financial Sector
| Ticker | Stock Name | Watchlist | Category | Recent Price | Trend Score | Change % | YTD Change% |
| FRT | Federal Realty |   | REIT - Retail | 91.54 | 10 | 1.03% | -16.48% |
| ARES | Ares Management | | Asset Mgmt | 188.55 | 88 | 3.13% | 7.34% |
| EQH | Equitable | | Insurance | 50.99 | 32 | 1.80% | 8.61% |
| NNN | National Retail | | REIT - | 43.05 | 93 | 2.45% | 6.95% |
| KIM | Kimco Realty | | REIT - Retail | 21.05 | 0 | 1.49% | -9.10% |
| AFG | American | | Insurance | 123.60 | 31 | 0.96% | -7.15% |
| JLL | Jones Lang | | Property Mgmt | 270.43 | 78 | 1.91% | 6.83% |
| CACC | Credit Acceptance | | Credit Services | 448.20 | 0 | 0.15% | -4.53% |
| GLPI | Gaming and | | REIT - | 47.08 | 85 | 2.02% | -0.72% |
| DEI | Douglas Emmett | | REIT - | 14.82 | 26 | -0.60% | -19.20% |
| LAMR | Lamar Advertising | | REIT - | 123.71 | 61 | 2.32% | 3.06% |
| VOYA | Voya | | Asset Mgmt | 67.86 | 36 | 0.82% | -0.78% |
| PB | Prosperity Bancshares | | Regional - Southwest Banks | 66.19 | 25 | 0.41% | -11.42% |
| ALLY | Ally | | Mortgage | 37.44 | 53 | 1.11% | 4.76% |
| EWBC | East West | | Foreign Banks | 100.03 | 43 | 1.24% | 5.07% |
| IVZ | Invesco | | Asset Mgmt | 21.00 | 70 | 1.89% | 21.49% |
| ZION | Zions Ban | | Regional Banks | 52.76 | 43 | 1.31% | -1.99% |
| CUBE | CubeSmart | | REIT - Industrial | 39.72 | 27 | -0.45% | -5.01% |
| LNC | Loln National | | Life Insurance | 37.92 | 95 | 2.85% | 23.08% |
| TFSL | TFS | | Regional Banks | 12.79 | 25 | -0.31% | 4.14% |
| AIV | Apartment | | REIT | 8.47 | 61 | 0.95% | -0.17% |
| CMA | Comerica | | Banks | 67.39 | 70 | 1.17% | 10.33% |
| RGA | Reinsurance | | Life Insurance | 177.10 | 7 | -0.13% | -16.73% |
| ORI | Old Republic | | Insurance | 36.35 | 35 | 1.23% | 7.18% |
| JBGS | JBG SMITH | | Property Mgmt | 20.56 | 63 | -1.67% | 33.77% |
| For chart view version of above stock list: Chart View ➞ 0 - 25 , 25 - 50 , 50 - 75 , 75 - 100 , 100 - 125 , 125 - 150 , 150 - 175 , 175 - 200 , 200 - 225 , 225 - 250 , 250 - 275 , 275 - 300 , 300 - 325 , 325 - 350 , 350 - 375 , 375 - 400 , 400 - 425 , 425 - 450 , 450 - 475 , 475 - 500 , 500 - 525 , 525 - 550 , 550 - 575 | ||
 | Click To Change The Sort Order: By Market Cap or Company Size Performance: Year-to-date, Week and Day |  |
|
Get the most comprehensive stock market coverage daily at 12Stocks.com ➞ Best Stocks Today ➞ Best Stocks Weekly ➞ Best Stocks Year-to-Date ➞ Best Stocks Trends ➞  Best Stocks Today 12Stocks.com Best Nasdaq Stocks ➞ Best S&P 500 Stocks ➞ Best Tech Stocks ➞ Best Biotech Stocks ➞ |
| Detailed Overview of Financial Stocks |
| Financial Technical Overview, Leaders & Laggards, Top Financial ETF Funds & Detailed Financial Stocks List, Charts, Trends & More |
| Financial Sector: Technical Analysis, Trends & YTD Performance | |
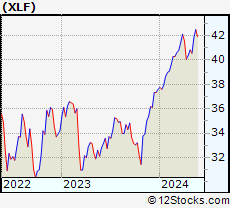
| Financial sector is composed of stocks
from banks, brokers, insurance, REITs
and services subsectors. Financial sector, as represented by XLF, an exchange-traded fund [ETF] that holds basket of Financial stocks (e.g, Bank of America, Goldman Sachs) is up by 7.8% and is currently outperforming the overall market by 0.27% year-to-date. Below is a quick view of Technical charts and trends: |
|
 XLF Weekly Chart |
|
| Long Term Trend: Good | |
| Medium Term Trend: Not Good | |
 XLF Daily Chart |
|
| Short Term Trend: Not Good | |
| Overall Trend Score: 33 | |
| YTD Performance: 7.8% | |
| **Trend Scores & Views Are Only For Educational Purposes And Not For Investing | |
| 12Stocks.com: Top Performing Financial Sector Stocks | ||||||||||||||||||||||||||||||||||||||||||||||||
 The top performing Financial sector stocks year to date are
Now, more recently, over last week, the top performing Financial sector stocks on the move are


|
||||||||||||||||||||||||||||||||||||||||||||||||
| 12Stocks.com: Investing in Financial Sector using Exchange Traded Funds | |
|
The following table shows list of key exchange traded funds (ETF) that
help investors track Financial Index. For detailed view, check out our ETF Funds section of our website. Quick View: Move mouse or cursor over ETF symbol (ticker) to view short-term Technical chart and over ETF name to view long term chart. Click on ticker or stock name for detailed view. Click on to add stock symbol to your watchlist and to view watchlist. |
12Stocks.com List of ETFs that track Financial Index
| Ticker | ETF Name | Watchlist | Recent Price | Smart Investing & Trading Score | Change % | Week % | Year-to-date % |
| XLF | Financial | | 51.91 | 33 | 0.99 | 0.99 | 7.8% |
| IAI | Broker-Dealers & Secs | | 174.97 | 63 | 2.34 | 2.34 | 21.82% |
| KBE | Bank | | 55.98 | 43 | 1.3 | 1.3 | 1.64% |
| FAS | Financial Bull 3X | | 161.82 | 33 | 2.91 | 2.91 | 7.48% |
| FAZ | Financial Bear 3X | | 4.54 | 62 | -2.78 | -2.78 | -27.4% |
| UYG | Financials | | 92.87 | 26 | 1.72 | 1.72 | 9% |
| KIE | Insurance | | 56.42 | 25 | 1.27 | 1.27 | 0.32% |
| 12Stocks.com: Charts, Trends, Fundamental Data and Performances of Financial Stocks | |
|
We now take in-depth look at all Financial stocks including charts, multi-period performances and overall trends (as measured by Smart Investing & Trading Score). One can sort Financial stocks (click link to choose) by Daily, Weekly and by Year-to-Date performances. Also, one can sort by size of the company or by market capitalization. |
| Select Your Default Chart Type: | |||||
| |||||
| Click on stock symbol or name for detailed view. Click on to add stock symbol to your watchlist and to view watchlist. Quick View: Move mouse or cursor over "Daily" to quickly view daily Technical stock chart and over "Weekly" to view weekly Technical stock chart. | |||||

 | FRT Federal Realty Investment Trust |
| Sector: Financials | |
| SubSector: REIT - Retail | |
| MarketCap: 5878.64 Millions | |
| Recent Price: 91.54 Smart Investing & Trading Score: 10 | |
| Day Percent Change: 1.03% Day Change: 0.93 | |
| Week Change: 1.03% Year-to-date Change: -16.5% | |
| FRT Links: Profile News Message Board | |
| Charts:- Daily , Weekly | |
| Add FRT to Watchlist: View: Get Complete FRT Trend Analysis ➞ | |
 | ARES Ares Management Corporation |
| Sector: Financials | |
| SubSector: Asset Management | |
| MarketCap: 5826.23 Millions | |
| Recent Price: 188.55 Smart Investing & Trading Score: 88 | |
| Day Percent Change: 3.13% Day Change: 5.72 | |
| Week Change: 3.13% Year-to-date Change: 7.3% | |
| ARES Links: Profile News Message Board | |
| Charts:- Daily , Weekly | |
| Add ARES to Watchlist: View: Get Complete ARES Trend Analysis ➞ | |
 | EQH Equitable Holdings, Inc. |
| Sector: Financials | |
| SubSector: Insurance Brokers | |
| MarketCap: 5520.07 Millions | |
| Recent Price: 50.99 Smart Investing & Trading Score: 32 | |
| Day Percent Change: 1.8% Day Change: 0.9 | |
| Week Change: 1.8% Year-to-date Change: 8.6% | |
| EQH Links: Profile News Message Board | |
| Charts:- Daily , Weekly | |
| Add EQH to Watchlist: View: Get Complete EQH Trend Analysis ➞ | |
 | NNN National Retail Properties, Inc. |
| Sector: Financials | |
| SubSector: REIT - Diversified | |
| MarketCap: 5459.93 Millions | |
| Recent Price: 43.05 Smart Investing & Trading Score: 93 | |
| Day Percent Change: 2.45% Day Change: 1.03 | |
| Week Change: 2.45% Year-to-date Change: 7.0% | |
| NNN Links: Profile News Message Board | |
| Charts:- Daily , Weekly | |
| Add NNN to Watchlist: View: Get Complete NNN Trend Analysis ➞ | |
 | KIM Kimco Realty Corporation |
| Sector: Financials | |
| SubSector: REIT - Retail | |
| MarketCap: 5358.64 Millions | |
| Recent Price: 21.05 Smart Investing & Trading Score: 0 | |
| Day Percent Change: 1.49% Day Change: 0.31 | |
| Week Change: 1.49% Year-to-date Change: -9.1% | |
| KIM Links: Profile News Message Board | |
| Charts:- Daily , Weekly | |
| Add KIM to Watchlist: View: Get Complete KIM Trend Analysis ➞ | |
 | AFG American Financial Group, Inc. |
| Sector: Financials | |
| SubSector: Property & Casualty Insurance | |
| MarketCap: 5353.82 Millions | |
| Recent Price: 123.60 Smart Investing & Trading Score: 31 | |
| Day Percent Change: 0.96% Day Change: 1.18 | |
| Week Change: 0.96% Year-to-date Change: -7.2% | |
| AFG Links: Profile News Message Board | |
| Charts:- Daily , Weekly | |
| Add AFG to Watchlist: View: Get Complete AFG Trend Analysis ➞ | |
 | JLL Jones Lang LaSalle Incorporated |
| Sector: Financials | |
| SubSector: Property Management | |
| MarketCap: 5259.32 Millions | |
| Recent Price: 270.43 Smart Investing & Trading Score: 78 | |
| Day Percent Change: 1.91% Day Change: 5.08 | |
| Week Change: 1.91% Year-to-date Change: 6.8% | |
| JLL Links: Profile News Message Board | |
| Charts:- Daily , Weekly | |
| Add JLL to Watchlist: View: Get Complete JLL Trend Analysis ➞ | |
 | CACC Credit Acceptance Corporation |
| Sector: Financials | |
| SubSector: Credit Services | |
| MarketCap: 5219.28 Millions | |
| Recent Price: 448.20 Smart Investing & Trading Score: 0 | |
| Day Percent Change: 0.15% Day Change: 0.69 | |
| Week Change: 0.15% Year-to-date Change: -4.5% | |
| CACC Links: Profile News Message Board | |
| Charts:- Daily , Weekly | |
| Add CACC to Watchlist: View: Get Complete CACC Trend Analysis ➞ | |
 | GLPI Gaming and Leisure Properties, Inc. |
| Sector: Financials | |
| SubSector: REIT - Diversified | |
| MarketCap: 4922.33 Millions | |
| Recent Price: 47.08 Smart Investing & Trading Score: 85 | |
| Day Percent Change: 2.02% Day Change: 0.93 | |
| Week Change: 2.02% Year-to-date Change: -0.7% | |
| GLPI Links: Profile News Message Board | |
| Charts:- Daily , Weekly | |
| Add GLPI to Watchlist: View: Get Complete GLPI Trend Analysis ➞ | |
 | DEI Douglas Emmett, Inc. |
| Sector: Financials | |
| SubSector: REIT - Diversified | |
| MarketCap: 4917.83 Millions | |
| Recent Price: 14.82 Smart Investing & Trading Score: 26 | |
| Day Percent Change: -0.6% Day Change: -0.09 | |
| Week Change: -0.6% Year-to-date Change: -19.2% | |
| DEI Links: Profile News Message Board | |
| Charts:- Daily , Weekly | |
| Add DEI to Watchlist: View: Get Complete DEI Trend Analysis ➞ | |
 | LAMR Lamar Advertising Company (REIT) |
| Sector: Financials | |
| SubSector: REIT - Diversified | |
| MarketCap: 4838.33 Millions | |
| Recent Price: 123.71 Smart Investing & Trading Score: 61 | |
| Day Percent Change: 2.32% Day Change: 2.8 | |
| Week Change: 2.32% Year-to-date Change: 3.1% | |
| LAMR Links: Profile News Message Board | |
| Charts:- Daily , Weekly | |
| Add LAMR to Watchlist: View: Get Complete LAMR Trend Analysis ➞ | |
 | VOYA Voya Financial, Inc. |
| Sector: Financials | |
| SubSector: Asset Management | |
| MarketCap: 4771.23 Millions | |
| Recent Price: 67.86 Smart Investing & Trading Score: 36 | |
| Day Percent Change: 0.82% Day Change: 0.55 | |
| Week Change: 0.82% Year-to-date Change: -0.8% | |
| VOYA Links: Profile News Message Board | |
| Charts:- Daily , Weekly | |
| Add VOYA to Watchlist: View: Get Complete VOYA Trend Analysis ➞ | |
 | PB Prosperity Bancshares, Inc. |
| Sector: Financials | |
| SubSector: Regional - Southwest Banks | |
| MarketCap: 4682.25 Millions | |
| Recent Price: 66.19 Smart Investing & Trading Score: 25 | |
| Day Percent Change: 0.41% Day Change: 0.27 | |
| Week Change: 0.41% Year-to-date Change: -11.4% | |
| PB Links: Profile News Message Board | |
| Charts:- Daily , Weekly | |
| Add PB to Watchlist: View: Get Complete PB Trend Analysis ➞ | |
 | ALLY Ally Financial Inc. |
| Sector: Financials | |
| SubSector: Mortgage Investment | |
| MarketCap: 4643.99 Millions | |
| Recent Price: 37.44 Smart Investing & Trading Score: 53 | |
| Day Percent Change: 1.11% Day Change: 0.41 | |
| Week Change: 1.11% Year-to-date Change: 4.8% | |
| ALLY Links: Profile News Message Board | |
| Charts:- Daily , Weekly | |
| Add ALLY to Watchlist: View: Get Complete ALLY Trend Analysis ➞ | |
 | EWBC East West Bancorp, Inc. |
| Sector: Financials | |
| SubSector: Foreign Money Center Banks | |
| MarketCap: 4618.31 Millions | |
| Recent Price: 100.03 Smart Investing & Trading Score: 43 | |
| Day Percent Change: 1.24% Day Change: 1.23 | |
| Week Change: 1.24% Year-to-date Change: 5.1% | |
| EWBC Links: Profile News Message Board | |
| Charts:- Daily , Weekly | |
| Add EWBC to Watchlist: View: Get Complete EWBC Trend Analysis ➞ | |
 | IVZ Invesco Ltd. |
| Sector: Financials | |
| SubSector: Asset Management | |
| MarketCap: 4578.23 Millions | |
| Recent Price: 21.00 Smart Investing & Trading Score: 70 | |
| Day Percent Change: 1.89% Day Change: 0.39 | |
| Week Change: 1.89% Year-to-date Change: 21.5% | |
| IVZ Links: Profile News Message Board | |
| Charts:- Daily , Weekly | |
| Add IVZ to Watchlist: View: Get Complete IVZ Trend Analysis ➞ | |
 | ZION Zions Bancorporation, National Association |
| Sector: Financials | |
| SubSector: Regional - Pacific Banks | |
| MarketCap: 4577.89 Millions | |
| Recent Price: 52.76 Smart Investing & Trading Score: 43 | |
| Day Percent Change: 1.31% Day Change: 0.68 | |
| Week Change: 1.31% Year-to-date Change: -2.0% | |
| ZION Links: Profile News Message Board | |
| Charts:- Daily , Weekly | |
| Add ZION to Watchlist: View: Get Complete ZION Trend Analysis ➞ | |
 | CUBE CubeSmart |
| Sector: Financials | |
| SubSector: REIT - Industrial | |
| MarketCap: 4562.99 Millions | |
| Recent Price: 39.72 Smart Investing & Trading Score: 27 | |
| Day Percent Change: -0.45% Day Change: -0.18 | |
| Week Change: -0.45% Year-to-date Change: -5.0% | |
| CUBE Links: Profile News Message Board | |
| Charts:- Daily , Weekly | |
| Add CUBE to Watchlist: View: Get Complete CUBE Trend Analysis ➞ | |
 | LNC Lincoln National Corporation |
| Sector: Financials | |
| SubSector: Life Insurance | |
| MarketCap: 4545.26 Millions | |
| Recent Price: 37.92 Smart Investing & Trading Score: 95 | |
| Day Percent Change: 2.85% Day Change: 1.05 | |
| Week Change: 2.85% Year-to-date Change: 23.1% | |
| LNC Links: Profile News Message Board | |
| Charts:- Daily , Weekly | |
| Add LNC to Watchlist: View: Get Complete LNC Trend Analysis ➞ | |
 | TFSL TFS Financial Corporation |
| Sector: Financials | |
| SubSector: Regional - Midwest Banks | |
| MarketCap: 4539.1 Millions | |
| Recent Price: 12.79 Smart Investing & Trading Score: 25 | |
| Day Percent Change: -0.31% Day Change: -0.04 | |
| Week Change: -0.31% Year-to-date Change: 4.1% | |
| TFSL Links: Profile News Message Board | |
| Charts:- Daily , Weekly | |
| Add TFSL to Watchlist: View: Get Complete TFSL Trend Analysis ➞ | |
 | AIV Apartment Investment and Management Company |
| Sector: Financials | |
| SubSector: REIT - Residential | |
| MarketCap: 4485.11 Millions | |
| Recent Price: 8.47 Smart Investing & Trading Score: 61 | |
| Day Percent Change: 0.95% Day Change: 0.08 | |
| Week Change: 0.95% Year-to-date Change: -0.2% | |
| AIV Links: Profile News Message Board | |
| Charts:- Daily , Weekly | |
| Add AIV to Watchlist: View: Get Complete AIV Trend Analysis ➞ | |
 | CMA Comerica Incorporated |
| Sector: Financials | |
| SubSector: Money Center Banks | |
| MarketCap: 4449.49 Millions | |
| Recent Price: 67.39 Smart Investing & Trading Score: 70 | |
| Day Percent Change: 1.17% Day Change: 0.78 | |
| Week Change: 1.17% Year-to-date Change: 10.3% | |
| CMA Links: Profile News Message Board | |
| Charts:- Daily , Weekly | |
| Add CMA to Watchlist: View: Get Complete CMA Trend Analysis ➞ | |
 | RGA Reinsurance Group of America, Incorporated |
| Sector: Financials | |
| SubSector: Life Insurance | |
| MarketCap: 4423.36 Millions | |
| Recent Price: 177.10 Smart Investing & Trading Score: 7 | |
| Day Percent Change: -0.13% Day Change: -0.23 | |
| Week Change: -0.13% Year-to-date Change: -16.7% | |
| RGA Links: Profile News Message Board | |
| Charts:- Daily , Weekly | |
| Add RGA to Watchlist: View: Get Complete RGA Trend Analysis ➞ | |
 | ORI Old Republic International Corporation |
| Sector: Financials | |
| SubSector: Property & Casualty Insurance | |
| MarketCap: 4420.92 Millions | |
| Recent Price: 36.35 Smart Investing & Trading Score: 35 | |
| Day Percent Change: 1.23% Day Change: 0.44 | |
| Week Change: 1.23% Year-to-date Change: 7.2% | |
| ORI Links: Profile News Message Board | |
| Charts:- Daily , Weekly | |
| Add ORI to Watchlist: View: Get Complete ORI Trend Analysis ➞ | |
 | JBGS JBG SMITH Properties |
| Sector: Financials | |
| SubSector: Property Management | |
| MarketCap: 4335.32 Millions | |
| Recent Price: 20.56 Smart Investing & Trading Score: 63 | |
| Day Percent Change: -1.67% Day Change: -0.35 | |
| Week Change: -1.67% Year-to-date Change: 33.8% | |
| JBGS Links: Profile News Message Board | |
| Charts:- Daily , Weekly | |
| Add JBGS to Watchlist: View: Get Complete JBGS Trend Analysis ➞ | |
| For tabular summary view of above stock list: Summary View ➞ 0 - 25 , 25 - 50 , 50 - 75 , 75 - 100 , 100 - 125 , 125 - 150 , 150 - 175 , 175 - 200 , 200 - 225 , 225 - 250 , 250 - 275 , 275 - 300 , 300 - 325 , 325 - 350 , 350 - 375 , 375 - 400 , 400 - 425 , 425 - 450 , 450 - 475 , 475 - 500 , 500 - 525 , 525 - 550 , 550 - 575 | ||
| Click To Change The Sort Order: By Market Cap or Company Size Performance: Year-to-date, Week and Day | |
| Select Chart Type: | ||
|
Best Stocks Today 12Stocks.com |
© 2025 12Stocks.com Terms & Conditions Privacy Contact Us
All Information Provided Only For Education And Not To Be Used For Investing or Trading. See Terms & Conditions


One More Thing ... Get Best Stocks Delivered Daily!
Never Ever Miss A Move With Our Top Ten Stocks Lists
Find Best Stocks In Any Market - Bull or Bear Market
Take A Peek At Our Top Ten Stocks Lists: Daily, Weekly, Year-to-Date & Top Trends
Find Best Stocks In Any Market - Bull or Bear Market
Take A Peek At Our Top Ten Stocks Lists: Daily, Weekly, Year-to-Date & Top Trends
Financial Stocks With Best Up Trends [0-bearish to 100-bullish]: Uniti [100], LendingTree [100], Mercury General[100], Perella Weinberg[100], Broadstone Net[100], LendingClub [100], TPG RE[100], CareTrust REIT[100], Stewart Information[100], Healthcare Realty[100], VICI Properties[100]
Best Financial Stocks Year-to-Date:
ESSA Bancorp[3207.77%], Easterly Government[108.45%], Mr. Cooper[86.58%], Heritage Insurance[75.29%], Root [65.29%], Industrial Logistics[64.89%], Rocket [58.42%], Diversified Healthcare[49.61%], ProAssurance [49.59%], Uniti [47.09%], SoFi Technologies[41.62%] Best Financial Stocks This Week:
Uniti [64.77%], Industrial Logistics[11.36%], LendingTree [7.32%], eXp World[7.27%], EverQuote [6.89%], Camping World[6.84%], First Foundation[6.69%], Diamond Hill[5.46%], Mercury General[5.36%], Cipher Mining[5.27%], AlTi Global[5.13%] Best Financial Stocks Daily:
Uniti [64.77%], Industrial Logistics[11.36%], LendingTree [7.32%], eXp World[7.27%], EverQuote [6.89%], Camping World[6.84%], First Foundation[6.69%], Diamond Hill[5.46%], Mercury General[5.36%], Cipher Mining[5.27%], AlTi Global[5.13%]