
 Login Sign Up


| |||||
 |  | ||||

| 12Stocks.com Market Intelligence |
Best Financial Stocks
| In a hurry? Financial Stocks Lists: Performance Trends Table, Stock Charts
Sort Financial stocks: Daily, Weekly, Year-to-Date, Market Cap & Trends. Filter Financial stocks list by size:All Financial Large Mid-Range Small & MicroCap |
| 12Stocks.com Financial Stocks Performances & Trends Daily | |||||||||
|
|  The overall Smart Investing & Trading Score is 33 (0-bearish to 100-bullish) which puts Financial sector in short term bearish to neutral trend. The Smart Investing & Trading Score from previous trading session is 26 and hence an improvement of trend.
| ||||||||
Here are the Smart Investing & Trading Scores of the most requested Financial stocks at 12Stocks.com (click stock name for detailed review):
|


| 12Stocks.com: Investing in Financial sector with Stocks | |
|
The following table helps investors and traders sort through current performance and trends (as measured by Smart Investing & Trading Score) of various
stocks in the Financial sector. Quick View: Move mouse or cursor over stock symbol (ticker) to view short-term Technical chart and over stock name to view long term chart. Click on  to add stock symbol to your watchlist and to add stock symbol to your watchlist and  to view watchlist. Click on any ticker or stock name for detailed market intelligence report for that stock. to view watchlist. Click on any ticker or stock name for detailed market intelligence report for that stock. |
12Stocks.com Performance of Stocks in Financial Sector
| Ticker | Stock Name | Watchlist | Category | Recent Price | Smart Investing & Trading Score | Change % | YTD Change% |
| WFC | Wells Fargo |   | Banks | 77.58 | 26 | -0.26% | 11.00% |
| DGICA | Donegal | | Insurance | 16.97 | 10 | 1.31% | 10.99% |
| FBP | First Ban | | Foreign Banks | 20.44 | 36 | 0.59% | 10.94% |
| IBOC | Bancshares | | Regional - Southwest Banks | 69.20 | 76 | 2.61% | 10.75% |
| CMA | Comerica | | Banks | 67.39 | 70 | 1.17% | 10.33% |
| UNTY | Unity Bancorp | | Banks | 47.88 | 36 | 0.06% | 10.16% |
| EFC | Ellington | | Mortgage | 12.95 | 51 | 1.97% | 10.11% |
| OZK | Bank OZK | | Regional Banks | 47.97 | 36 | 0.31% | 10.05% |
| CBNK | Capital Bancorp | | S&L | 31.22 | 10 | 1.00% | 9.89% |
| ACT | Enact | | Insurance - Specialty | 35.36 | 70 | 0.64% | 9.82% |
| L | Loews | | Insurance | 92.82 | 83 | 2.80% | 9.68% |
| CFG | Citizens | | Regional Banks | 47.58 | 53 | 1.62% | 9.68% |
| O | Realty ome | | REIT - Retail | 57.45 | 88 | 1.56% | 9.64% |
| TRV | Travelers | | Insurance | 263.00 | 42 | 1.81% | 9.63% |
| BLK | BlackRock | | Asset Mgmt | 1116.06 | 76 | 2.22% | 9.47% |
| OMF | OneMain | | Credit Services | 55.84 | 31 | -1.15% | 9.12% |
| ALX | Alexander s | | REIT - Retail | 213.41 | 0 | -12.98% | 9.07% |
| SMBK | Smart | | Regional Banks | 33.71 | 36 | 1.35% | 8.81% |
| PDLB | PDL Community | | REIT - Retail | 14.12 | 66 | 1.51% | 8.62% |
| MITT | AG Mortgage | | Mortgage | 7.03 | 26 | 0.86% | 8.62% |
| EQH | Equitable | | Insurance | 50.99 | 32 | 1.80% | 8.61% |
| EVR | Evercore | | Asset Mgmt | 300.01 | 58 | 2.04% | 8.60% |
| MA | Mastercard | | Credit Services | 569.81 | 64 | 1.77% | 8.55% |
| HWC | Hancock Whitney | | Regional Banks | 58.89 | 41 | 2.17% | 8.52% |
| FHN | First Horizon | | Regional Banks | 21.67 | 43 | 1.55% | 8.48% |
| For chart view version of above stock list: Chart View ➞ 0 - 25 , 25 - 50 , 50 - 75 , 75 - 100 , 100 - 125 , 125 - 150 , 150 - 175 , 175 - 200 , 200 - 225 , 225 - 250 , 250 - 275 , 275 - 300 , 300 - 325 , 325 - 350 , 350 - 375 , 375 - 400 , 400 - 425 , 425 - 450 , 450 - 475 , 475 - 500 , 500 - 525 , 525 - 550 , 550 - 575 | ||
 | Click To Change The Sort Order: By Market Cap or Company Size Performance: Year-to-date, Week and Day |  |
|
Get the most comprehensive stock market coverage daily at 12Stocks.com ➞ Best Stocks Today ➞ Best Stocks Weekly ➞ Best Stocks Year-to-Date ➞ Best Stocks Trends ➞  Best Stocks Today 12Stocks.com Best Nasdaq Stocks ➞ Best S&P 500 Stocks ➞ Best Tech Stocks ➞ Best Biotech Stocks ➞ |
| Detailed Overview of Financial Stocks |
| Financial Technical Overview, Leaders & Laggards, Top Financial ETF Funds & Detailed Financial Stocks List, Charts, Trends & More |
| Financial Sector: Technical Analysis, Trends & YTD Performance | |
| Financial sector is composed of stocks
from banks, brokers, insurance, REITs
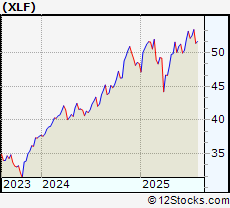
and services subsectors. Financial sector, as represented by XLF, an exchange-traded fund [ETF] that holds basket of Financial stocks (e.g, Bank of America, Goldman Sachs) is up by 7.8% and is currently outperforming the overall market by 0.27% year-to-date. Below is a quick view of Technical charts and trends: |
|
 XLF Weekly Chart |
|
| Long Term Trend: Good | |
| Medium Term Trend: Not Good | |
 XLF Daily Chart |
|
| Short Term Trend: Not Good | |
| Overall Trend Score: 33 | |
| YTD Performance: 7.8% | |
| **Trend Scores & Views Are Only For Educational Purposes And Not For Investing | |
| 12Stocks.com: Top Performing Financial Sector Stocks | ||||||||||||||||||||||||||||||||||||||||||||||||
 The top performing Financial sector stocks year to date are
Now, more recently, over last week, the top performing Financial sector stocks on the move are


|
||||||||||||||||||||||||||||||||||||||||||||||||
| 12Stocks.com: Investing in Financial Sector using Exchange Traded Funds | |
|
The following table shows list of key exchange traded funds (ETF) that
help investors track Financial Index. For detailed view, check out our ETF Funds section of our website. Quick View: Move mouse or cursor over ETF symbol (ticker) to view short-term Technical chart and over ETF name to view long term chart. Click on ticker or stock name for detailed view. Click on to add stock symbol to your watchlist and to view watchlist. |
12Stocks.com List of ETFs that track Financial Index
| Ticker | ETF Name | Watchlist | Recent Price | Smart Investing & Trading Score | Change % | Week % | Year-to-date % |
| XLF | Financial | | 51.91 | 33 | 0.99 | 0.99 | 7.8% |
| IAI | Broker-Dealers & Secs | | 174.97 | 63 | 2.34 | 2.34 | 21.82% |
| KBE | Bank | | 55.98 | 43 | 1.3 | 1.3 | 1.64% |
| FAS | Financial Bull 3X | | 161.82 | 33 | 2.91 | 2.91 | 7.48% |
| FAZ | Financial Bear 3X | | 4.54 | 62 | -2.78 | -2.78 | -27.4% |
| UYG | Financials | | 92.87 | 26 | 1.72 | 1.72 | 9% |
| KIE | Insurance | | 56.42 | 25 | 1.27 | 1.27 | 0.32% |
| 12Stocks.com: Charts, Trends, Fundamental Data and Performances of Financial Stocks | |
|
We now take in-depth look at all Financial stocks including charts, multi-period performances and overall trends (as measured by Smart Investing & Trading Score). One can sort Financial stocks (click link to choose) by Daily, Weekly and by Year-to-Date performances. Also, one can sort by size of the company or by market capitalization. |
| Select Your Default Chart Type: | |||||
| |||||
| Click on stock symbol or name for detailed view. Click on to add stock symbol to your watchlist and to view watchlist. Quick View: Move mouse or cursor over "Daily" to quickly view daily Technical stock chart and over "Weekly" to view weekly Technical stock chart. | |||||

 | WFC Wells Fargo & Company |
| Sector: Financials | |
| SubSector: Money Center Banks | |
| MarketCap: 129138 Millions | |
| Recent Price: 77.58 Smart Investing & Trading Score: 26 | |
| Day Percent Change: -0.26% Day Change: -0.2 | |
| Week Change: -0.26% Year-to-date Change: 11.0% | |
| WFC Links: Profile News Message Board | |
| Charts:- Daily , Weekly | |
| Add WFC to Watchlist: View: Get Complete WFC Trend Analysis ➞ | |
 | DGICA Donegal Group Inc. |
| Sector: Financials | |
| SubSector: Property & Casualty Insurance | |
| MarketCap: 350.512 Millions | |
| Recent Price: 16.97 Smart Investing & Trading Score: 10 | |
| Day Percent Change: 1.31% Day Change: 0.22 | |
| Week Change: 1.31% Year-to-date Change: 11.0% | |
| DGICA Links: Profile News Message Board | |
| Charts:- Daily , Weekly | |
| Add DGICA to Watchlist: View: Get Complete DGICA Trend Analysis ➞ | |
 | FBP First BanCorp. |
| Sector: Financials | |
| SubSector: Foreign Regional Banks | |
| MarketCap: 913.079 Millions | |
| Recent Price: 20.44 Smart Investing & Trading Score: 36 | |
| Day Percent Change: 0.59% Day Change: 0.12 | |
| Week Change: 0.59% Year-to-date Change: 10.9% | |
| FBP Links: Profile News Message Board | |
| Charts:- Daily , Weekly | |
| Add FBP to Watchlist: View: Get Complete FBP Trend Analysis ➞ | |
 | IBOC International Bancshares Corporation |
| Sector: Financials | |
| SubSector: Regional - Southwest Banks | |
| MarketCap: 1159.45 Millions | |
| Recent Price: 69.20 Smart Investing & Trading Score: 76 | |
| Day Percent Change: 2.61% Day Change: 1.76 | |
| Week Change: 2.61% Year-to-date Change: 10.8% | |
| IBOC Links: Profile News Message Board | |
| Charts:- Daily , Weekly | |
| Add IBOC to Watchlist: View: Get Complete IBOC Trend Analysis ➞ | |
 | CMA Comerica Incorporated |
| Sector: Financials | |
| SubSector: Money Center Banks | |
| MarketCap: 4449.49 Millions | |
| Recent Price: 67.39 Smart Investing & Trading Score: 70 | |
| Day Percent Change: 1.17% Day Change: 0.78 | |
| Week Change: 1.17% Year-to-date Change: 10.3% | |
| CMA Links: Profile News Message Board | |
| Charts:- Daily , Weekly | |
| Add CMA to Watchlist: View: Get Complete CMA Trend Analysis ➞ | |
 | UNTY Unity Bancorp, Inc. |
| Sector: Financials | |
| SubSector: Money Center Banks | |
| MarketCap: 149.099 Millions | |
| Recent Price: 47.88 Smart Investing & Trading Score: 36 | |
| Day Percent Change: 0.06% Day Change: 0.03 | |
| Week Change: 0.06% Year-to-date Change: 10.2% | |
| UNTY Links: Profile News Message Board | |
| Charts:- Daily , Weekly | |
| Add UNTY to Watchlist: View: Get Complete UNTY Trend Analysis ➞ | |
 | EFC Ellington Financial Inc. |
| Sector: Financials | |
| SubSector: Mortgage Investment | |
| MarketCap: 380.239 Millions | |
| Recent Price: 12.95 Smart Investing & Trading Score: 51 | |
| Day Percent Change: 1.97% Day Change: 0.25 | |
| Week Change: 1.97% Year-to-date Change: 10.1% | |
| EFC Links: Profile News Message Board | |
| Charts:- Daily , Weekly | |
| Add EFC to Watchlist: View: Get Complete EFC Trend Analysis ➞ | |
 | OZK Bank OZK |
| Sector: Financials | |
| SubSector: Regional - Southeast Banks | |
| MarketCap: 2518.35 Millions | |
| Recent Price: 47.97 Smart Investing & Trading Score: 36 | |
| Day Percent Change: 0.31% Day Change: 0.15 | |
| Week Change: 0.31% Year-to-date Change: 10.1% | |
| OZK Links: Profile News Message Board | |
| Charts:- Daily , Weekly | |
| Add OZK to Watchlist: View: Get Complete OZK Trend Analysis ➞ | |
 | CBNK Capital Bancorp, Inc. |
| Sector: Financials | |
| SubSector: Savings & Loans | |
| MarketCap: 174.93 Millions | |
| Recent Price: 31.22 Smart Investing & Trading Score: 10 | |
| Day Percent Change: 1% Day Change: 0.31 | |
| Week Change: 1% Year-to-date Change: 9.9% | |
| CBNK Links: Profile News Message Board | |
| Charts:- Daily , Weekly | |
| Add CBNK to Watchlist: View: Get Complete CBNK Trend Analysis ➞ | |
 | ACT Enact Holdings, Inc. |
| Sector: Financials | |
| SubSector: Insurance - Specialty | |
| MarketCap: 4010 Millions | |
| Recent Price: 35.36 Smart Investing & Trading Score: 70 | |
| Day Percent Change: 0.64% Day Change: 0.22 | |
| Week Change: 0.64% Year-to-date Change: 9.8% | |
| ACT Links: Profile News Message Board | |
| Charts:- Daily , Weekly | |
| Add ACT to Watchlist: View: Get Complete ACT Trend Analysis ➞ | |
 | L Loews Corporation |
| Sector: Financials | |
| SubSector: Property & Casualty Insurance | |
| MarketCap: 10768.2 Millions | |
| Recent Price: 92.82 Smart Investing & Trading Score: 83 | |
| Day Percent Change: 2.8% Day Change: 2.53 | |
| Week Change: 2.8% Year-to-date Change: 9.7% | |
| L Links: Profile News Message Board | |
| Charts:- Daily , Weekly | |
| Add L to Watchlist: View: Get Complete L Trend Analysis ➞ | |
 | CFG Citizens Financial Group, Inc. |
| Sector: Financials | |
| SubSector: Regional - Mid-Atlantic Banks | |
| MarketCap: 8225.19 Millions | |
| Recent Price: 47.58 Smart Investing & Trading Score: 53 | |
| Day Percent Change: 1.62% Day Change: 0.76 | |
| Week Change: 1.62% Year-to-date Change: 9.7% | |
| CFG Links: Profile News Message Board | |
| Charts:- Daily , Weekly | |
| Add CFG to Watchlist: View: Get Complete CFG Trend Analysis ➞ | |
 | O Realty Income Corporation |
| Sector: Financials | |
| SubSector: REIT - Retail | |
| MarketCap: 17647.4 Millions | |
| Recent Price: 57.45 Smart Investing & Trading Score: 88 | |
| Day Percent Change: 1.56% Day Change: 0.88 | |
| Week Change: 1.56% Year-to-date Change: 9.6% | |
| O Links: Profile News Message Board | |
| Charts:- Daily , Weekly | |
| Add O to Watchlist: View: Get Complete O Trend Analysis ➞ | |
 | TRV The Travelers Companies, Inc. |
| Sector: Financials | |
| SubSector: Property & Casualty Insurance | |
| MarketCap: 25155.9 Millions | |
| Recent Price: 263.00 Smart Investing & Trading Score: 42 | |
| Day Percent Change: 1.81% Day Change: 4.68 | |
| Week Change: 1.81% Year-to-date Change: 9.6% | |
| TRV Links: Profile News Message Board | |
| Charts:- Daily , Weekly | |
| Add TRV to Watchlist: View: Get Complete TRV Trend Analysis ➞ | |
 | BLK BlackRock, Inc. |
| Sector: Financials | |
| SubSector: Asset Management | |
| MarketCap: 61284.9 Millions | |
| Recent Price: 1116.06 Smart Investing & Trading Score: 76 | |
| Day Percent Change: 2.22% Day Change: 24.26 | |
| Week Change: 2.22% Year-to-date Change: 9.5% | |
| BLK Links: Profile News Message Board | |
| Charts:- Daily , Weekly | |
| Add BLK to Watchlist: View: Get Complete BLK Trend Analysis ➞ | |
 | OMF OneMain Holdings, Inc. |
| Sector: Financials | |
| SubSector: Credit Services | |
| MarketCap: 2753.38 Millions | |
| Recent Price: 55.84 Smart Investing & Trading Score: 31 | |
| Day Percent Change: -1.15% Day Change: -0.65 | |
| Week Change: -1.15% Year-to-date Change: 9.1% | |
| OMF Links: Profile News Message Board | |
| Charts:- Daily , Weekly | |
| Add OMF to Watchlist: View: Get Complete OMF Trend Analysis ➞ | |
 | ALX Alexander s, Inc. |
| Sector: Financials | |
| SubSector: REIT - Retail | |
| MarketCap: 1251.54 Millions | |
| Recent Price: 213.41 Smart Investing & Trading Score: 0 | |
| Day Percent Change: -12.98% Day Change: -31.84 | |
| Week Change: -12.98% Year-to-date Change: 9.1% | |
| ALX Links: Profile News Message Board | |
| Charts:- Daily , Weekly | |
| Add ALX to Watchlist: View: Get Complete ALX Trend Analysis ➞ | |
 | SMBK SmartFinancial, Inc. |
| Sector: Financials | |
| SubSector: Regional - Southeast Banks | |
| MarketCap: 174.035 Millions | |
| Recent Price: 33.71 Smart Investing & Trading Score: 36 | |
| Day Percent Change: 1.35% Day Change: 0.45 | |
| Week Change: 1.35% Year-to-date Change: 8.8% | |
| SMBK Links: Profile News Message Board | |
| Charts:- Daily , Weekly | |
| Add SMBK to Watchlist: View: Get Complete SMBK Trend Analysis ➞ | |
 | PDLB PDL Community Bancorp |
| Sector: Financials | |
| SubSector: REIT - Retail | |
| MarketCap: 206.114 Millions | |
| Recent Price: 14.12 Smart Investing & Trading Score: 66 | |
| Day Percent Change: 1.51% Day Change: 0.21 | |
| Week Change: 1.51% Year-to-date Change: 8.6% | |
| PDLB Links: Profile News Message Board | |
| Charts:- Daily , Weekly | |
| Add PDLB to Watchlist: View: Get Complete PDLB Trend Analysis ➞ | |
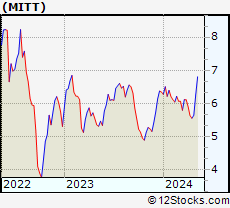 | MITT AG Mortgage Investment Trust, Inc. |
| Sector: Financials | |
| SubSector: Mortgage Investment | |
| MarketCap: 197.839 Millions | |
| Recent Price: 7.03 Smart Investing & Trading Score: 26 | |
| Day Percent Change: 0.86% Day Change: 0.06 | |
| Week Change: 0.86% Year-to-date Change: 8.6% | |
| MITT Links: Profile News Message Board | |
| Charts:- Daily , Weekly | |
| Add MITT to Watchlist: View: Get Complete MITT Trend Analysis ➞ | |
 | EQH Equitable Holdings, Inc. |
| Sector: Financials | |
| SubSector: Insurance Brokers | |
| MarketCap: 5520.07 Millions | |
| Recent Price: 50.99 Smart Investing & Trading Score: 32 | |
| Day Percent Change: 1.8% Day Change: 0.9 | |
| Week Change: 1.8% Year-to-date Change: 8.6% | |
| EQH Links: Profile News Message Board | |
| Charts:- Daily , Weekly | |
| Add EQH to Watchlist: View: Get Complete EQH Trend Analysis ➞ | |
 | EVR Evercore Inc. |
| Sector: Financials | |
| SubSector: Asset Management | |
| MarketCap: 1989.83 Millions | |
| Recent Price: 300.01 Smart Investing & Trading Score: 58 | |
| Day Percent Change: 2.04% Day Change: 6 | |
| Week Change: 2.04% Year-to-date Change: 8.6% | |
| EVR Links: Profile News Message Board | |
| Charts:- Daily , Weekly | |
| Add EVR to Watchlist: View: Get Complete EVR Trend Analysis ➞ | |
 | MA Mastercard Incorporated |
| Sector: Financials | |
| SubSector: Credit Services | |
| MarketCap: 234809 Millions | |
| Recent Price: 569.81 Smart Investing & Trading Score: 64 | |
| Day Percent Change: 1.77% Day Change: 9.92 | |
| Week Change: 1.77% Year-to-date Change: 8.6% | |
| MA Links: Profile News Message Board | |
| Charts:- Daily , Weekly | |
| Add MA to Watchlist: View: Get Complete MA Trend Analysis ➞ | |
 | HWC Hancock Whitney Corporation |
| Sector: Financials | |
| SubSector: Regional - Southeast Banks | |
| MarketCap: 1438.55 Millions | |
| Recent Price: 58.89 Smart Investing & Trading Score: 41 | |
| Day Percent Change: 2.17% Day Change: 1.25 | |
| Week Change: 2.17% Year-to-date Change: 8.5% | |
| HWC Links: Profile News Message Board | |
| Charts:- Daily , Weekly | |
| Add HWC to Watchlist: View: Get Complete HWC Trend Analysis ➞ | |
 | FHN First Horizon National Corporation |
| Sector: Financials | |
| SubSector: Regional - Southeast Banks | |
| MarketCap: 2661.05 Millions | |
| Recent Price: 21.67 Smart Investing & Trading Score: 43 | |
| Day Percent Change: 1.55% Day Change: 0.33 | |
| Week Change: 1.55% Year-to-date Change: 8.5% | |
| FHN Links: Profile News Message Board | |
| Charts:- Daily , Weekly | |
| Add FHN to Watchlist: View: Get Complete FHN Trend Analysis ➞ | |
| For tabular summary view of above stock list: Summary View ➞ 0 - 25 , 25 - 50 , 50 - 75 , 75 - 100 , 100 - 125 , 125 - 150 , 150 - 175 , 175 - 200 , 200 - 225 , 225 - 250 , 250 - 275 , 275 - 300 , 300 - 325 , 325 - 350 , 350 - 375 , 375 - 400 , 400 - 425 , 425 - 450 , 450 - 475 , 475 - 500 , 500 - 525 , 525 - 550 , 550 - 575 | ||
| Click To Change The Sort Order: By Market Cap or Company Size Performance: Year-to-date, Week and Day | |
| Select Chart Type: | ||
|
Best Stocks Today 12Stocks.com |
© 2025 12Stocks.com Terms & Conditions Privacy Contact Us
All Information Provided Only For Education And Not To Be Used For Investing or Trading. See Terms & Conditions


One More Thing ... Get Best Stocks Delivered Daily!
Never Ever Miss A Move With Our Top Ten Stocks Lists
Find Best Stocks In Any Market - Bull or Bear Market
Take A Peek At Our Top Ten Stocks Lists: Daily, Weekly, Year-to-Date & Top Trends
Find Best Stocks In Any Market - Bull or Bear Market
Take A Peek At Our Top Ten Stocks Lists: Daily, Weekly, Year-to-Date & Top Trends
Financial Stocks With Best Up Trends [0-bearish to 100-bullish]: Uniti [100], LendingTree [100], Mercury General[100], Perella Weinberg[100], Broadstone Net[100], LendingClub [100], TPG RE[100], CareTrust REIT[100], Stewart Information[100], Healthcare Realty[100], VICI Properties[100]
Best Financial Stocks Year-to-Date:
ESSA Bancorp[3207.77%], Easterly Government[108.45%], Mr. Cooper[86.58%], Heritage Insurance[75.29%], Root [65.29%], Industrial Logistics[64.89%], Rocket [58.42%], Diversified Healthcare[49.61%], ProAssurance [49.59%], Uniti [47.09%], SoFi Technologies[41.62%] Best Financial Stocks This Week:
Uniti [64.77%], Industrial Logistics[11.36%], LendingTree [7.32%], eXp World[7.27%], EverQuote [6.89%], Camping World[6.84%], First Foundation[6.69%], Diamond Hill[5.46%], Mercury General[5.36%], Cipher Mining[5.27%], AlTi Global[5.13%] Best Financial Stocks Daily:
Uniti [64.77%], Industrial Logistics[11.36%], LendingTree [7.32%], eXp World[7.27%], EverQuote [6.89%], Camping World[6.84%], First Foundation[6.69%], Diamond Hill[5.46%], Mercury General[5.36%], Cipher Mining[5.27%], AlTi Global[5.13%]