
![]()
Stocks with best trends & most momentum Starts at just $9.99/Mo Subscribe ➞
| Terms & Conditions | Follow @DozenStocks | 12Stocks.com - Best Performing Stocks |
|
 Login Sign Up


| More Screen Space? | ||
| Show Menu | Hide Menu |  |
| On This Page.. |
| Dividend Stocks & ETFs |
| Investing with Dividend Stocks |
| Performance & Trends |
| Top Dividend Stocks |
| Investing with Dividend ETF Funds |
| Detailed View: Dividend Stock Lists, Charts & More |
| 12Stocks.com |
| Dividend Stocks With Best Trends & Most Momentum Everyday |
| Get It Now |
 |
| Dividend Stocks SlideShow Here |
| Top Dow Stocks |
| Best S&P 500 Stocks |
| Best SmallCap Stocks |
| Top Sectors |
| Best Dividend Stocks |
 |
Best Dividend Stocks & ETFs
|
|
| Related Dividend Sector Pages: Technology, Nasdaq 100 & Web/Internet Stocks |
| ||||||||||||||||||
| Quick Read: Best Dividend Stocks List By Performances & Trends: Daily, Weekly, Year-to-Date, Market Cap (Size) & Technical Trends | ||||||||||||||||||
| Best Dividend Stocks Views: Quick Browse View, Summary View and Slide Show View | ||||||||||||||||||
| ||||||||||||||||||
| Dividend Index in Brief | ||||||||||||||||||
| Year-to-date Dividend is underperforming market by -3.45%. | ||||||||||||||||||
| Market Trend Chart View | ||||||||||||||||||
 |
||||||||||||||||||
| Year To Date Performance: 3.43 % | ||||||||||||||||||
| Weekly Performance: 1.22 % | ||||||||||||||||||
| Daily Performance: 0.46 % | ||||||||||||||||||
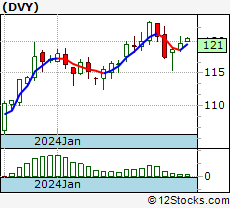
| 12Stocks.com Short Term Trend Analysis for DVY | ||||||||||||||||||
| 100 | ||||||||||||||||||
| The current technical trend score is 100 in a scale where 0 is bearish and 100 is bullish. The trend score in the session before was 100. Trend score updated daily. Not to be used for investing. | ||||||||||||||||||


| 12Stocks.com: Investing in Dividend Index with Stocks | |
|
The following table helps investors and traders sort through current performance and trends (as measured by market intelligence score) of various
stocks in the Dividend Index. Quick View: Move mouse or cursor over stock symbol (ticker) to view short-term technical chart and over stock name to view long term chart. Click on  to add stock symbol to your watchlist and to add stock symbol to your watchlist and  to view watchlist. Click on any ticker or stock name for detailed market intelligence report for that stock. to view watchlist. Click on any ticker or stock name for detailed market intelligence report for that stock. |
12Stocks.com Performance of Stocks in Dividend Index
| Ticker | Stock Name | Watchlist | Category | Recent Price | Market Intelligence Score | Change % | YTD Change% |
| GOOG | Alphabet Inc. |   | Internet Information Providers | 168.99 | 95 | 0.31% | 19.91% |
| T | AT&T Inc. | | Telecom Services - Domestic | 16.85 | 58 | 0.18% | 0.42% |
| MRK | Merck & Co., Inc. | | Drug Manufacturers - Major | 127.51 | 35 | -0.58% | 16.96% |
| HD | The Home Depot, Inc. | | Home Improvement Stores | 342.85 | 49 | 2.18% | -1.07% |
| KO | The Coca-Cola Company | | Beverages - Soft Drinks | 62.17 | 76 | 0.29% | 5.50% |
| PFE | Pfizer Inc. | | Drug Manufacturers - Major | 27.81 | 100 | 0.40% | -3.40% |
| LLY | Eli Lilly and Company | | Drug Manufacturers - Major | 734.97 | 7 | -2.77% | 26.08% |
| MCD | McDonald s Corporation | | Restaurants | 270.32 | 25 | -1.08% | -8.83% |
| CVX | Chevron Corporation | | Major Integrated Oil & Gas | 160.25 | 59 | -0.30% | 7.43% |
| BMY | Bristol-Myers Squibb Company | | Drug Manufacturers - Major | 43.99 | 28 | 0.66% | -14.27% |
| HON | Honeywell International Inc. | | Diversified Machinery | 195.81 | 57 | 1.12% | -6.63% |
| MO | Altria Group, Inc. | | Cigarettes | 43.59 | 76 | -0.89% | 8.06% |
| GE | General Electric Company | | Diversified Machinery | 164.11 | 90 | 0.90% | 28.58% |
| CAT | Caterpillar Inc. | | Farm & Construction Machinery | 336.75 | 51 | 0.39% | 13.89% |
| NOC | Northrop Grumman Corporation | | Aerospace/Defense - Major Diversified | 469.09 | 63 | -1.24% | 0.20% |
| WM | Waste Management, Inc. | | Waste Management | 207.88 | 54 | 0.35% | 16.07% |
| KMB | Kimberly-Clark Corporation | | Personal Products | 136.09 | 76 | -0.30% | 12.00% |
| AEP | American Electric Power Company, Inc. | | Electric Utilities | 88.60 | 95 | 0.40% | 9.09% |
| NU | Nu Holdings Ltd. | | Banks - Diversified | 11.69 | 95 | 6.13% | 40.17% |
| GD | General Dynamics Corporation | | Aerospace/Defense Products & Services | 288.14 | 63 | 0.27% | 10.96% |
| SRE | Sempra Energy | | Diversified Utilities | 72.92 | 90 | 0.07% | -2.42% |
| GIS | General Mills, Inc. | | Processed & Packaged Goods | 69.91 | 51 | -1.05% | 7.32% |
| EMR | Emerson Electric Co. | | Industrial Electrical Equipment | 106.54 | 23 | 0.12% | 9.46% |
| ETN | Eaton Corporation plc | | Diversified Machinery | 320.50 | 70 | 1.66% | 33.09% |
| RSG | Republic Services, Inc. | | Waste Management | 185.51 | 26 | -0.50% | 12.49% |
| To view more stocks, click on Next / Previous arrows or select different range: 0 - 25 , 25 - 50 , 50 - 75 , 75 - 100 | ||
 | Click To Change The Sort Order: By Market Cap or Company Size Performance: Year-to-date, Week and Day |  |
| Detailed Overview Of Dividend Stocks |
| Dividend Technical Overview, Leaders & Laggards, Top Dividend ETF Funds & Detailed Dividend Stocks List, Charts, Trends & More |
| Dividend: Technical Analysis, Trends & YTD Performance | |
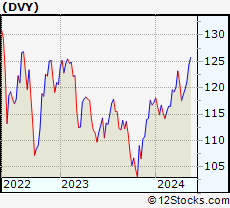
 DVY Weekly Chart |
|
| Long Term Trend: Very Good | |
| Medium Term Trend: Very Good | |
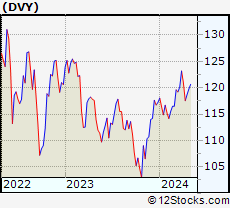
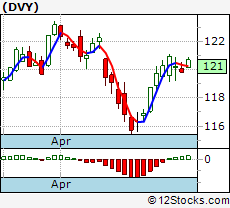 DVY Daily Chart |
|
| Short Term Trend: Very Good | |
| Overall Trend Score: 100 | |
| YTD Performance: 3.43% | |
| **Trend Scores & Views Are Only For Educational Purposes And Not For Investing | |
| 12Stocks.com: Top Performing Dividend Index Stocks | |
|
|
We try to spot trends by analyzing the performances of various stocks or
components within Dividend Index and try to find best performing
stocks. The movers and shakers. The winners and losers. The top performing Dividend stocks year to date are Mercury General [46.61%], Nu Holdings [40.17%], Eaton [33.09%], General Electric [28.58%], Eli Lilly [26.08%], Allstate [20.15%], Alphabet [19.91%], Pitney Bowes [19.77%], Merck [16.96%], Waste Management [16.07%], Public Service [15.21%]. More Now, more recently, over last week, the top performing Dividend stocks on the move are - Pitney Bowes [27.6%], Trinity Industries [12.16%], Pfizer [9.49%], Mercury General [5.88%], Nu Holdings [5.79%], Deluxe [5.75%], Valley National [5.6%], Cinnati Financial [5.47%], Sensient Technologies [5.17%], Universal [5.1%], Watsco [4.81%]. More The laggards stocks in this index year to date (YTD) are agilon health [-61.78%], Leggett & Platt [-46.69%], V.F [-32.93%], Valley National [-28.82%], Universal [-20.69%], Bank of Hawaii [-18.77%], Bristol-Myers [-14.27%], PPG Industries [-11.12%], United Bankshares [-9.56%], Darden Restaurants [-9.16%], McDonald s [-8.83%]. The best trending Dividend stocks currently are Watsco [1.86%], Trinity Industries [1.30%], F.N.B [1.10%], Universal [1.04%], Pinnacle West [1.00%], Entergy [0.86%], DTE Energy [0.75%], PPL [0.61%], Public Service [0.61%], Edison [0.51%], Pfizer [0.40%]. More |
| LEADING DIVIDEND STOCKS | |
| MERCURY GENERAL: 46.61% | |
| NU HOLDINGS: 40.17% | |
| EATON : 33.09% | |
| GENERAL ELECTRIC: 28.58% | |
| ELI LILLY: 26.08% | |
| ALLSTATE : 20.15% | |
| ALPHABET : 19.91% | |
| PITNEY BOWES: 19.77% | |
| MERCK : 16.96% | |
| WASTE MANAGEMENT: 16.07% | |

| 12Stocks.com: Investing in Dividend Index using Exchange Traded Funds | |
|
The following table shows list of key exchange traded funds (ETF) that
help investors track Dividend Index. The following list also includes leveraged ETF funds that track twice or thrice the daily returns of Dividend indices. Short or inverse ETF funds move in the opposite direction to the index they track and are useful during market pullbacks or during bear markets. Quick View: Move mouse or cursor over ETF symbol (ticker) to view short-term technical chart and over ETF name to view long term chart. Click on ticker or stock name for detailed view. Click on to add stock symbol to your watchlist and to view watchlist. |
12Stocks.com List of ETFs that track Dividend Index
| 12Stocks.com: Charts, Trends, Fundamental Data and Performances of Dividend Stocks | |
|
We now take in-depth look at all Dividend stocks including charts, multi-period performances and overall trends (as measured by market intelligence score). One can sort Dividend stocks (click link to choose) by Daily, Weekly and by Year-to-Date performances. Also, one can sort by size of the company or by market capitalization. |
| Select Your Default Chart Type: | |||||
| |||||
| Click on stock symbol or name for detailed view. Click on to add stock symbol to your watchlist and to view watchlist. Quick View: Move mouse or cursor over "Daily" to quickly view daily technical stock chart and over "Weekly" to view weekly technical stock chart. | |||||
 | GOOG Alphabet Inc. |
| Sector: Technology | |
| SubSector: Internet Information Providers | |
| MarketCap: 730159 Millions | |
| Recent Price: 168.99 Market Intelligence Score: 95 | |
| Day Percent Change: 0.31% Day Change: 0.53 | |
| Week Change: -2.71% Year-to-date Change: 19.9% | |
| GOOG Links: Profile News Message Board | |
| Charts:- Daily , Weekly | |
| Save GOOG for Review: | |
 | T AT&T Inc. |
| Sector: Technology | |
| SubSector: Telecom Services - Domestic | |
| MarketCap: 224847 Millions | |
| Recent Price: 16.85 Market Intelligence Score: 58 | |
| Day Percent Change: 0.18% Day Change: 0.03 | |
| Week Change: 0.6% Year-to-date Change: 0.4% | |
| T Links: Profile News Message Board | |
| Charts:- Daily , Weekly | |
| Save T for Review: | |
 | MRK Merck & Co., Inc. |
| Sector: Health Care | |
| SubSector: Drug Manufacturers - Major | |
| MarketCap: 192657 Millions | |
| Recent Price: 127.51 Market Intelligence Score: 35 | |
| Day Percent Change: -0.58% Day Change: -0.75 | |
| Week Change: -2.81% Year-to-date Change: 17.0% | |
| MRK Links: Profile News Message Board | |
| Charts:- Daily , Weekly | |
| Save MRK for Review: | |
 | HD The Home Depot, Inc. |
| Sector: Services & Goods | |
| SubSector: Home Improvement Stores | |
| MarketCap: 185389 Millions | |
| Recent Price: 342.85 Market Intelligence Score: 49 | |
| Day Percent Change: 2.18% Day Change: 7.32 | |
| Week Change: 2.32% Year-to-date Change: -1.1% | |
| HD Links: Profile News Message Board | |
| Charts:- Daily , Weekly | |
| Save HD for Review: | |
 | KO The Coca-Cola Company |
| Sector: Consumer Staples | |
| SubSector: Beverages - Soft Drinks | |
| MarketCap: 182046 Millions | |
| Recent Price: 62.17 Market Intelligence Score: 76 | |
| Day Percent Change: 0.29% Day Change: 0.18 | |
| Week Change: 0.7% Year-to-date Change: 5.5% | |
| KO Links: Profile News Message Board | |
| Charts:- Daily , Weekly | |
| Save KO for Review: | |
 | PFE Pfizer Inc. |
| Sector: Health Care | |
| SubSector: Drug Manufacturers - Major | |
| MarketCap: 172467 Millions | |
| Recent Price: 27.81 Market Intelligence Score: 100 | |
| Day Percent Change: 0.40% Day Change: 0.11 | |
| Week Change: 9.49% Year-to-date Change: -3.4% | |
| PFE Links: Profile News Message Board | |
| Charts:- Daily , Weekly | |
| Save PFE for Review: | |
 | LLY Eli Lilly and Company |
| Sector: Health Care | |
| SubSector: Drug Manufacturers - Major | |
| MarketCap: 130066 Millions | |
| Recent Price: 734.97 Market Intelligence Score: 7 | |
| Day Percent Change: -2.77% Day Change: -20.94 | |
| Week Change: 0.2% Year-to-date Change: 26.1% | |
| LLY Links: Profile News Message Board | |
| Charts:- Daily , Weekly | |
| Save LLY for Review: | |
 | MCD McDonald s Corporation |
| Sector: Services & Goods | |
| SubSector: Restaurants | |
| MarketCap: 122481 Millions | |
| Recent Price: 270.32 Market Intelligence Score: 25 | |
| Day Percent Change: -1.08% Day Change: -2.96 | |
| Week Change: -1.01% Year-to-date Change: -8.8% | |
| MCD Links: Profile News Message Board | |
| Charts:- Daily , Weekly | |
| Save MCD for Review: | |
 | CVX Chevron Corporation |
| Sector: Energy | |
| SubSector: Major Integrated Oil & Gas | |
| MarketCap: 121521 Millions | |
| Recent Price: 160.25 Market Intelligence Score: 59 | |
| Day Percent Change: -0.30% Day Change: -0.48 | |
| Week Change: -3.4% Year-to-date Change: 7.4% | |
| CVX Links: Profile News Message Board | |
| Charts:- Daily , Weekly | |
| Save CVX for Review: | |
 | BMY Bristol-Myers Squibb Company |
| Sector: Health Care | |
| SubSector: Drug Manufacturers - Major | |
| MarketCap: 117052 Millions | |
| Recent Price: 43.99 Market Intelligence Score: 28 | |
| Day Percent Change: 0.66% Day Change: 0.29 | |
| Week Change: -1.92% Year-to-date Change: -14.3% | |
| BMY Links: Profile News Message Board | |
| Charts:- Daily , Weekly | |
| Save BMY for Review: | |
 | HON Honeywell International Inc. |
| Sector: Industrials | |
| SubSector: Diversified Machinery | |
| MarketCap: 91189.1 Millions | |
| Recent Price: 195.81 Market Intelligence Score: 57 | |
| Day Percent Change: 1.12% Day Change: 2.17 | |
| Week Change: 1.22% Year-to-date Change: -6.6% | |
| HON Links: Profile News Message Board | |
| Charts:- Daily , Weekly | |
| Save HON for Review: | |
 | MO Altria Group, Inc. |
| Sector: Consumer Staples | |
| SubSector: Cigarettes | |
| MarketCap: 70806.3 Millions | |
| Recent Price: 43.59 Market Intelligence Score: 76 | |
| Day Percent Change: -0.89% Day Change: -0.39 | |
| Week Change: 0.48% Year-to-date Change: 8.1% | |
| MO Links: Profile News Message Board | |
| Charts:- Daily , Weekly | |
| Save MO for Review: | |
 | GE General Electric Company |
| Sector: Industrials | |
| SubSector: Diversified Machinery | |
| MarketCap: 64710.6 Millions | |
| Recent Price: 164.11 Market Intelligence Score: 90 | |
| Day Percent Change: 0.90% Day Change: 1.47 | |
| Week Change: 1.08% Year-to-date Change: 28.6% | |
| GE Links: Profile News Message Board | |
| Charts:- Daily , Weekly | |
| Save GE for Review: | |
 | CAT Caterpillar Inc. |
| Sector: Industrials | |
| SubSector: Farm & Construction Machinery | |
| MarketCap: 58636 Millions | |
| Recent Price: 336.75 Market Intelligence Score: 51 | |
| Day Percent Change: 0.39% Day Change: 1.31 | |
| Week Change: -1.93% Year-to-date Change: 13.9% | |
| CAT Links: Profile News Message Board | |
| Charts:- Daily , Weekly | |
| Save CAT for Review: | |
 | NOC Northrop Grumman Corporation |
| Sector: Industrials | |
| SubSector: Aerospace/Defense - Major Diversified | |
| MarketCap: 52094.9 Millions | |
| Recent Price: 469.09 Market Intelligence Score: 63 | |
| Day Percent Change: -1.24% Day Change: -5.91 | |
| Week Change: -2.36% Year-to-date Change: 0.2% | |
| NOC Links: Profile News Message Board | |
| Charts:- Daily , Weekly | |
| Save NOC for Review: | |
 | WM Waste Management, Inc. |
| Sector: Industrials | |
| SubSector: Waste Management | |
| MarketCap: 46977.4 Millions | |
| Recent Price: 207.88 Market Intelligence Score: 54 | |
| Day Percent Change: 0.35% Day Change: 0.72 | |
| Week Change: -1.06% Year-to-date Change: 16.1% | |
| WM Links: Profile News Message Board | |
| Charts:- Daily , Weekly | |
| Save WM for Review: | |
 | KMB Kimberly-Clark Corporation |
| Sector: Consumer Staples | |
| SubSector: Personal Products | |
| MarketCap: 44300.5 Millions | |
| Recent Price: 136.09 Market Intelligence Score: 76 | |
| Day Percent Change: -0.30% Day Change: -0.41 | |
| Week Change: 0.63% Year-to-date Change: 12.0% | |
| KMB Links: Profile News Message Board | |
| Charts:- Daily , Weekly | |
| Save KMB for Review: | |
 | AEP American Electric Power Company, Inc. |
| Sector: Utilities | |
| SubSector: Electric Utilities | |
| MarketCap: 38380 Millions | |
| Recent Price: 88.60 Market Intelligence Score: 95 | |
| Day Percent Change: 0.40% Day Change: 0.35 | |
| Week Change: 3.92% Year-to-date Change: 9.1% | |
| AEP Links: Profile News Message Board | |
| Charts:- Daily , Weekly | |
| Save AEP for Review: | |
 | NU Nu Holdings Ltd. |
| Sector: Financials | |
| SubSector: Banks - Diversified | |
| MarketCap: 37240 Millions | |
| Recent Price: 11.69 Market Intelligence Score: 95 | |
| Day Percent Change: 6.13% Day Change: 0.67 | |
| Week Change: 5.79% Year-to-date Change: 40.2% | |
| NU Links: Profile News Message Board | |
| Charts:- Daily , Weekly | |
| Save NU for Review: | |
 | GD General Dynamics Corporation |
| Sector: Industrials | |
| SubSector: Aerospace/Defense Products & Services | |
| MarketCap: 37063.8 Millions | |
| Recent Price: 288.14 Market Intelligence Score: 63 | |
| Day Percent Change: 0.27% Day Change: 0.78 | |
| Week Change: 1.31% Year-to-date Change: 11.0% | |
| GD Links: Profile News Message Board | |
| Charts:- Daily , Weekly | |
| Save GD for Review: | |
 | SRE Sempra Energy |
| Sector: Utilities | |
| SubSector: Diversified Utilities | |
| MarketCap: 34339.9 Millions | |
| Recent Price: 72.92 Market Intelligence Score: 90 | |
| Day Percent Change: 0.07% Day Change: 0.05 | |
| Week Change: 2.24% Year-to-date Change: -2.4% | |
| SRE Links: Profile News Message Board | |
| Charts:- Daily , Weekly | |
| Save SRE for Review: | |
 | GIS General Mills, Inc. |
| Sector: Consumer Staples | |
| SubSector: Processed & Packaged Goods | |
| MarketCap: 34131.7 Millions | |
| Recent Price: 69.91 Market Intelligence Score: 51 | |
| Day Percent Change: -1.05% Day Change: -0.74 | |
| Week Change: -1.3% Year-to-date Change: 7.3% | |
| GIS Links: Profile News Message Board | |
| Charts:- Daily , Weekly | |
| Save GIS for Review: | |
 | EMR Emerson Electric Co. |
| Sector: Industrials | |
| SubSector: Industrial Electrical Equipment | |
| MarketCap: 30457.9 Millions | |
| Recent Price: 106.54 Market Intelligence Score: 23 | |
| Day Percent Change: 0.12% Day Change: 0.13 | |
| Week Change: -3.05% Year-to-date Change: 9.5% | |
| EMR Links: Profile News Message Board | |
| Charts:- Daily , Weekly | |
| Save EMR for Review: | |
 | ETN Eaton Corporation plc |
| Sector: Industrials | |
| SubSector: Diversified Machinery | |
| MarketCap: 29829.4 Millions | |
| Recent Price: 320.50 Market Intelligence Score: 70 | |
| Day Percent Change: 1.66% Day Change: 5.23 | |
| Week Change: -1.17% Year-to-date Change: 33.1% | |
| ETN Links: Profile News Message Board | |
| Charts:- Daily , Weekly | |
| Save ETN for Review: | |
 | RSG Republic Services, Inc. |
| Sector: Industrials | |
| SubSector: Waste Management | |
| MarketCap: 26178.6 Millions | |
| Recent Price: 185.51 Market Intelligence Score: 26 | |
| Day Percent Change: -0.50% Day Change: -0.93 | |
| Week Change: -3.34% Year-to-date Change: 12.5% | |
| RSG Links: Profile News Message Board | |
| Charts:- Daily , Weekly | |
| Save RSG for Review: | |
| To view more stocks, click on Next / Previous arrows or select different range: 0 - 25 , 25 - 50 , 50 - 75 , 75 - 100 | ||
| Click To Change The Sort Order: By Market Cap or Company Size Performance: Year-to-date, Week and Day | |
| Select Chart Type: | ||

|


List of Dividend Stocks
 |
|
US Stock Market Performance Year-to-Date: 6% |
 View More Stocks In The List
| Stock | Price | YTD | Week | Day% |
| GOOG | 168.99 | 19.9 | -2.7 | 0.3 |
| T | 16.85 | 0.4 | 0.6 | 0.2 |
| MRK | 127.51 | 17.0 | -2.8 | -0.6 |
| HD | 342.85 | -1.1 | 2.3 | 2.2 |
| KO | 62.17 | 5.5 | 0.7 | 0.3 |
| PFE | 27.81 | -3.4 | 9.5 | 0.4 |
| LLY | 734.97 | 26.1 | 0.2 | -2.8 |
| MCD | 270.32 | -8.8 | -1.0 | -1.1 |
| CVX | 160.25 | 7.4 | -3.4 | -0.3 |
| BMY | 43.99 | -14.3 | -1.9 | 0.7 |
| HON | 195.81 | -6.6 | 1.2 | 1.1 |
| MO | 43.59 | 8.1 | 0.5 | -0.9 |
| GE | 164.11 | 28.6 | 1.1 | 0.9 |
| CAT | 336.75 | 13.9 | -1.9 | 0.4 |
| NOC | 469.09 | 0.2 | -2.4 | -1.2 |
| WM | 207.88 | 16.1 | -1.1 | 0.4 |
| KMB | 136.09 | 12.0 | 0.6 | -0.3 |
| AEP | 88.60 | 9.1 | 3.9 | 0.4 |
| NU | 11.69 | 40.2 | 5.8 | 6.1 |
| GD | 288.14 | 11.0 | 1.3 | 0.3 |
| SRE | 72.92 | -2.4 | 2.2 | 0.1 |
| GIS | 69.91 | 7.3 | -1.3 | -1.1 |
| EMR | 106.54 | 9.5 | -3.1 | 0.1 |
| ETN | 320.50 | 33.1 | -1.2 | 1.7 |
| RSG | 185.51 | 12.5 | -3.3 | -0.5 |
View More Stocks In The List | WatchList | my12Stocks |
| Market Trends | |
| (0-bearish to 100-bullish) | |
| Major Market Segments | |
    | |
| Click Sector To View Market Intelligence | |
One More Thing ... Get Best Stocks Delivered Daily!
Never Ever Miss A Move With Our Top Ten Stocks Lists
Find Best Stocks In Any Market - Bull or Bear Market
Take A Peek At Our Top Ten Stocks Lists: Daily, Weekly, Year-to-Date & Top Trends
Find Best Stocks In Any Market - Bull or Bear Market
Take A Peek At Our Top Ten Stocks Lists: Daily, Weekly, Year-to-Date & Top Trends
Dividend Stocks With Best Up Trends [0-bearish to 100-bullish]: Watsco [100], Trinity Industries[100], F.N.B [100], Universal [100], Pinnacle West[100], Entergy [100], DTE Energy[100], PPL [100], Public Service[100], Edison [100], Pfizer [100]
Best Dividend Stocks Year-to-Date:
Mercury General[46.61%], Nu Holdings[40.17%], Eaton [33.09%], General Electric[28.58%], Eli Lilly[26.08%], Allstate [20.15%], Alphabet [19.91%], Pitney Bowes[19.77%], Merck [16.96%], Waste Management[16.07%], Public Service[15.21%] Best Dividend Stocks This Week:
Tupperware Brands[27.88%], Pitney Bowes[27.6%], Trinity Industries[12.16%], Pfizer [9.49%], Mercury General[5.88%], Nu Holdings[5.79%], Deluxe [5.75%], Valley National[5.6%], Cinnati Financial[5.47%], Sensient Technologies[5.17%], Universal [5.1%] Best Dividend Stocks Daily:
Tupperware Brands[17.70%], Nu Holdings[6.13%], Valaris [4.92%], Steel Dynamics[3.58%], Valley National[3.07%], Leggett & Platt[2.88%], Home Depot[2.18%], Sonoco Products[2.14%], Watsco [1.86%], Eaton [1.66%], Eastman Chemical[1.65%]
© 2024 12Stocks.com Terms & Conditions Privacy Contact Us
All Information Provided Only For Education And Not To Be Used For Investing or Trading. See Terms & Conditions