
 Login Sign Up


| |||||
 |  | ||||

| 12Stocks.com Market Intelligence |
Best Consumer Staples Stocks
| In a hurry? Consumer Staples Stocks: Performance Trends Table, Stock Charts
Sort Consumer Staples : Daily, Weekly, Year-to-Date, Market Cap & Trends. Filter Consumer Staples stocks list by size: All Large Mid-Range Small |
| 12Stocks.com Consumer Staples Stocks Performances & Trends Daily | |||||||||
|
|  The overall Smart Investing & Trading Score is 30 (0-bearish to 100-bullish) which puts Consumer Staples sector in short term bearish to neutral trend. The Smart Investing & Trading Score from previous trading session is 40 and a deterioration of trend continues.
| ||||||||
| Here are the Smart Investing & Trading Scores of the most requested Consumer Staples stocks at 12Stocks.com (click stock name for detailed review): |


| 12Stocks.com: Investing in Consumer Staples sector with Stocks | |
|
The following table helps investors and traders sort through current performance and trends (as measured by Smart Investing & Trading Score) of various
stocks in the Consumer Staples sector. Quick View: Move mouse or cursor over stock symbol (ticker) to view short-term Technical chart and over stock name to view long term chart. Click on  to add stock symbol to your watchlist and to add stock symbol to your watchlist and  to view watchlist. Click on any ticker or stock name for detailed market intelligence report for that stock. to view watchlist. Click on any ticker or stock name for detailed market intelligence report for that stock. |
12Stocks.com Performance of Stocks in Consumer Staples Sector
| Ticker | Stock Name | Watchlist | Category | Recent Price | Smart Investing & Trading Score | Change % | YTD Change% |
| PF | Pinnacle Foods |   | Food | 166.49 | 60 | 0.33% | 0.00% |
| VSTO | Vista Outdoor | | Sporting Goods | 44.63 | 90 | 0.54% | 0.00% |
| VRTV | Veritiv | | Packaging & Containers | 6.92 | 0 | -9.90% | 0.00% |
| WRK | WestRock | | Packaging & Containers | 35.99 | 0 | -0.03% | 0.00% |
| LTRPA | Liberty TripAdvisor | | Recreational Goods, Other | 0.26 | 0 | 0.00% | 0.00% |
| TWNK | Hostess Brands | | Processed | 19.87 | 0 | 0.91% | 0.00% |
| MHG | Marine Harvest | | Farm | 74.15 | 30 | -0.12% | 0.00% |
| FCAU | Fiat Chrysler | | Auto Manufacturers - Major | 191.51 | 70 | -0.70% | 0.00% |
| CLXT | Calyxt | | Farm | 6.30 | 10 | 0.00% | 0.00% |
| NBEV | New Age | | Beverages | 0.01 | 40 | 25.00% | 0.00% |
| CTRC | Centric Brands | | Textile - Apparel Clothing | 7.08 | 30 | -4.97% | 0.00% |
| YGYI | Youngevity | | Processed | 0.01 | 50 | 0.00% | 0.00% |
| NTCO | Natura &Co | | Household & Household | 6.55 | 10 | -2.96% | 0.00% |
| SOLO | Electrameccanica Vehicles | | Auto Manufacturers - Major | 0.21 | 20 | -3.55% | 0.00% |
| AFYA | Afya | | Education & Training | 15.35 | 30 | -0.84% | -0.51% |
| GO | Grocery Outlet | | Grocery Stores | 16.18 | 50 | -0.12% | -0.74% |
| DOLE | Dole | | Farm | 13.26 | 10 | -1.04% | -0.92% |
| SJM | J.M. Smucker | | Packaged Foods | 107.80 | 50 | -0.66% | -1.25% |
| FARM | Farmer Bros. | | Packaged Foods | 1.76 | 40 | 0.57% | -1.68% |
| NGVC | Natural Grocers | | Grocery Stores | 40.21 | 90 | -1.83% | -2.06% |
| PPC | Pilgrim's Pride | | Packaged Foods | 40.91 | 50 | -0.80% | -2.24% |
| PEP | PepsiCo | | Beverages - Non-Alcoholic | 142.31 | 70 | -0.58% | -3.37% |
| CHGG | Chegg | | Education & Training | 1.62 | 90 | 3.85% | -3.57% |
| LW | Lamb Weston | | Packaged Foods | 62.14 | 100 | 0.21% | -4.04% |
| KMB | Kimberly-Clark Corp | | Household & Household | 122.62 | 10 | -0.50% | -4.40% |
| For chart view version of above stock list: Chart View ➞ 0 - 25 , 25 - 50 , 50 - 75 , 75 - 100 , 100 - 125 , 125 - 150 , 150 - 175 , 175 - 200 , 200 - 225 , 225 - 250 | ||
 | Click To Change The Sort Order: By Market Cap or Company Size Performance: Year-to-date, Week and Day |  |
|
Get the most comprehensive stock market coverage daily at 12Stocks.com ➞ Best Stocks Today ➞ Best Stocks Weekly ➞ Best Stocks Year-to-Date ➞ Best Stocks Trends ➞  Best Stocks Today 12Stocks.com Best Nasdaq Stocks ➞ Best S&P 500 Stocks ➞ Best Tech Stocks ➞ Best Biotech Stocks ➞ |
| Detailed Overview of Consumer Staples Stocks |
| Consumer Staples Technical Overview, Leaders & Laggards, Top Consumer Staples ETF Funds & Detailed Consumer Staples Stocks List, Charts, Trends & More |
| Consumer Staples Sector: Technical Analysis, Trends & YTD Performance | |
| Consumer Staples sector is composed of stocks
from household consumer products, food, farm, cosmetics, tobacco,
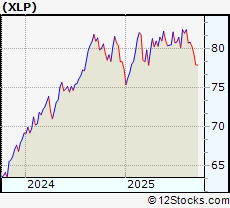
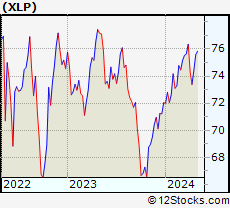
and beverages subsectors. Consumer Staples sector, as represented by XLP, an exchange-traded fund [ETF] that holds basket of Consumer Staples stocks (e.g, Proctor & Gamble, Pepsi) is up by 0.66399% and is currently underperforming the overall market by -14.09391% year-to-date. Below is a quick view of Technical charts and trends: |
|
 XLP Weekly Chart |
|
| Long Term Trend: Not Good | |
| Medium Term Trend: Not Good | |
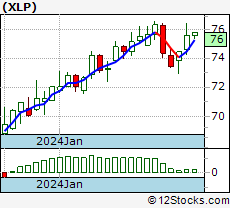
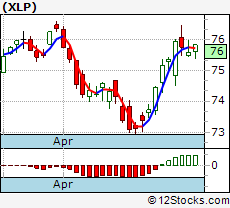 XLP Daily Chart |
|
| Short Term Trend: Deteriorating | |
| Overall Trend Score: 30 | |
| YTD Performance: 0.66399% | |
| **Trend Scores & Views Are Only For Educational Purposes And Not For Investing | |
| 12Stocks.com: Top Performing Consumer Staples Sector Stocks | ||||||||||||||||||||||||||||||||||||||||||||||||
 The top performing Consumer Staples sector stocks year to date are
Now, more recently, over last week, the top performing Consumer Staples sector stocks on the move are


|
||||||||||||||||||||||||||||||||||||||||||||||||
| 12Stocks.com: Investing in Consumer Staples Sector using Exchange Traded Funds | |
|
The following table shows list of key exchange traded funds (ETF) that
help investors track Consumer Staples Index. For detailed view, check out our ETF Funds section of our website. Quick View: Move mouse or cursor over ETF symbol (ticker) to view short-term Technical chart and over ETF name to view long term chart. Click on ticker or stock name for detailed view. Click on to add stock symbol to your watchlist and to view watchlist. |
12Stocks.com List of ETFs that track Consumer Staples Index
| Ticker | ETF Name | Watchlist | Recent Price | Smart Investing & Trading Score | Change % | Week % | Year-to-date % |
| 12Stocks.com: Charts, Trends, Fundamental Data and Performances of Consumer Staples Stocks | |
|
We now take in-depth look at all Consumer Staples stocks including charts, multi-period performances and overall trends (as measured by Smart Investing & Trading Score). One can sort Consumer Staples stocks (click link to choose) by Daily, Weekly and by Year-to-Date performances. Also, one can sort by size of the company or by market capitalization. |
| Select Your Default Chart Type: | |||||
| |||||
| Click on stock symbol or name for detailed view. Click on to add stock symbol to your watchlist and to view watchlist. Quick View: Move mouse or cursor over "Daily" to quickly view daily Technical stock chart and over "Weekly" to view weekly Technical stock chart. | |||||
 | PF Pinnacle Foods Inc. |
| Sector: Consumer Staples | |
| SubSector: Food - Major Diversified | |
| MarketCap: 6894.29 Millions | |
| Recent Price: 166.49 Smart Investing & Trading Score: 60 | |
| Day Percent Change: 0.331445% Day Change: -9999 | |
| Week Change: 55.0908% Year-to-date Change: 0.0% | |
| PF Links: Profile News Message Board | |
| Charts:- Daily , Weekly | |
| Add PF to Watchlist: View: Get Complete PF Trend Analysis ➞ | |
 | VSTO Vista Outdoor Inc. |
| Sector: Consumer Staples | |
| SubSector: Sporting Goods | |
| MarketCap: 405.144 Millions | |
| Recent Price: 44.63 Smart Investing & Trading Score: 90 | |
| Day Percent Change: 0.540662% Day Change: -9999 | |
| Week Change: 1.20181% Year-to-date Change: 0.0% | |
| VSTO Links: Profile News Message Board | |
| Charts:- Daily , Weekly | |
| Add VSTO to Watchlist: View: Get Complete VSTO Trend Analysis ➞ | |
 | VRTV Veritiv Corporation |
| Sector: Consumer Staples | |
| SubSector: Packaging & Containers | |
| MarketCap: 143.253 Millions | |
| Recent Price: 6.92 Smart Investing & Trading Score: 0 | |
| Day Percent Change: -9.89583% Day Change: -9999 | |
| Week Change: -95.9285% Year-to-date Change: 0.0% | |
| VRTV Links: Profile News Message Board | |
| Charts:- Daily , Weekly | |
| Add VRTV to Watchlist: View: Get Complete VRTV Trend Analysis ➞ | |
 | WRK WestRock Company |
| Sector: Consumer Staples | |
| SubSector: Packaging & Containers | |
| MarketCap: 7835.43 Millions | |
| Recent Price: 35.99 Smart Investing & Trading Score: 0 | |
| Day Percent Change: -0.0277778% Day Change: -9999 | |
| Week Change: -26.2349% Year-to-date Change: 0.0% | |
| WRK Links: Profile News Message Board | |
| Charts:- Daily , Weekly | |
| Add WRK to Watchlist: View: Get Complete WRK Trend Analysis ➞ | |
 | LTRPA Liberty TripAdvisor Holdings, Inc. |
| Sector: Consumer Staples | |
| SubSector: Recreational Goods, Other | |
| MarketCap: 219.059 Millions | |
| Recent Price: 0.26 Smart Investing & Trading Score: 0 | |
| Day Percent Change: 0% Day Change: -9999 | |
| Week Change: 0% Year-to-date Change: 0.0% | |
| LTRPA Links: Profile News Message Board | |
| Charts:- Daily , Weekly | |
| Add LTRPA to Watchlist: View: Get Complete LTRPA Trend Analysis ➞ | |
 | TWNK Hostess Brands, Inc. |
| Sector: Consumer Staples | |
| SubSector: Processed & Packaged Goods | |
| MarketCap: 1397.58 Millions | |
| Recent Price: 19.87 Smart Investing & Trading Score: 0 | |
| Day Percent Change: 0.91417% Day Change: -9999 | |
| Week Change: -40.3303% Year-to-date Change: 0.0% | |
| TWNK Links: Profile News Message Board | |
| Charts:- Daily , Weekly | |
| Add TWNK to Watchlist: View: Get Complete TWNK Trend Analysis ➞ | |
 | MHG Marine Harvest ASA |
| Sector: Consumer Staples | |
| SubSector: Farm Products | |
| MarketCap: 7300.39 Millions | |
| Recent Price: 74.15 Smart Investing & Trading Score: 30 | |
| Day Percent Change: -0.121228% Day Change: -9999 | |
| Week Change: 0.311147% Year-to-date Change: 0.0% | |
| MHG Links: Profile News Message Board | |
| Charts:- Daily , Weekly | |
| Add MHG to Watchlist: View: Get Complete MHG Trend Analysis ➞ | |
 | FCAU Fiat Chrysler Automobiles N.V. |
| Sector: Consumer Staples | |
| SubSector: Auto Manufacturers - Major | |
| MarketCap: 9953.71 Millions | |
| Recent Price: 191.51 Smart Investing & Trading Score: 70 | |
| Day Percent Change: -0.69999% Day Change: -9999 | |
| Week Change: 10.3931% Year-to-date Change: 0.0% | |
| FCAU Links: Profile News Message Board | |
| Charts:- Daily , Weekly | |
| Add FCAU to Watchlist: View: Get Complete FCAU Trend Analysis ➞ | |
 | CLXT Calyxt, Inc. |
| Sector: Consumer Staples | |
| SubSector: Farm Products | |
| MarketCap: 120.087 Millions | |
| Recent Price: 6.30 Smart Investing & Trading Score: 10 | |
| Day Percent Change: 0% Day Change: -9999 | |
| Week Change: 0% Year-to-date Change: 0.0% | |
| CLXT Links: Profile News Message Board | |
| Charts:- Daily , Weekly | |
| Add CLXT to Watchlist: View: Get Complete CLXT Trend Analysis ➞ | |
 | NBEV New Age Beverages Corporation |
| Sector: Consumer Staples | |
| SubSector: Beverages - Soft Drinks | |
| MarketCap: 105.72 Millions | |
| Recent Price: 0.01 Smart Investing & Trading Score: 40 | |
| Day Percent Change: 25% Day Change: -9999 | |
| Week Change: 2.04082% Year-to-date Change: 0.0% | |
| NBEV Links: Profile News Message Board | |
| Charts:- Daily , Weekly | |
| Add NBEV to Watchlist: View: Get Complete NBEV Trend Analysis ➞ | |
 | CTRC Centric Brands Inc. |
| Sector: Consumer Staples | |
| SubSector: Textile - Apparel Clothing | |
| MarketCap: 104.365 Millions | |
| Recent Price: 7.08 Smart Investing & Trading Score: 30 | |
| Day Percent Change: -4.96644% Day Change: -9999 | |
| Week Change: -21.9405% Year-to-date Change: 0.0% | |
| CTRC Links: Profile News Message Board | |
| Charts:- Daily , Weekly | |
| Add CTRC to Watchlist: View: Get Complete CTRC Trend Analysis ➞ | |
 | YGYI Youngevity International, Inc. |
| Sector: Consumer Staples | |
| SubSector: Processed & Packaged Goods | |
| MarketCap: 43.1748 Millions | |
| Recent Price: 0.01 Smart Investing & Trading Score: 50 | |
| Day Percent Change: 0% Day Change: -9999 | |
| Week Change: 362.5% Year-to-date Change: 0.0% | |
| YGYI Links: Profile News Message Board | |
| Charts:- Daily , Weekly | |
| Add YGYI to Watchlist: View: Get Complete YGYI Trend Analysis ➞ | |
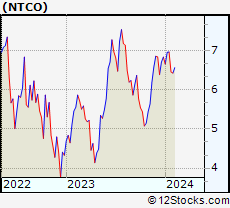 | NTCO Natura &Co Holding S.A. |
| Sector: Consumer Staples | |
| SubSector: Household & Personal Products | |
| MarketCap: 13047 Millions | |
| Recent Price: 6.55 Smart Investing & Trading Score: 10 | |
| Day Percent Change: -2.96296% Day Change: -9999 | |
| Week Change: -8.50677% Year-to-date Change: 0.0% | |
| NTCO Links: Profile News Message Board | |
| Charts:- Daily , Weekly | |
| Add NTCO to Watchlist: View: Get Complete NTCO Trend Analysis ➞ | |
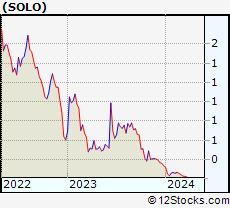 | SOLO Electrameccanica Vehicles Corp. |
| Sector: Consumer Staples | |
| SubSector: Auto Manufacturers - Major | |
| MarketCap: 61.6471 Millions | |
| Recent Price: 0.21 Smart Investing & Trading Score: 20 | |
| Day Percent Change: -3.54545% Day Change: -9999 | |
| Week Change: -6.06463% Year-to-date Change: 0.0% | |
| SOLO Links: Profile News Message Board | |
| Charts:- Daily , Weekly | |
| Add SOLO to Watchlist: View: Get Complete SOLO Trend Analysis ➞ | |
 | AFYA Afya Ltd |
| Sector: Consumer Staples | |
| SubSector: Education & Training Services | |
| MarketCap: 1359.45 Millions | |
| Recent Price: 15.35 Smart Investing & Trading Score: 30 | |
| Day Percent Change: -0.839793% Day Change: -0.04 | |
| Week Change: -5.94363% Year-to-date Change: -0.5% | |
| AFYA Links: Profile News Message Board | |
| Charts:- Daily , Weekly | |
| Add AFYA to Watchlist: View: Get Complete AFYA Trend Analysis ➞ | |
 | GO Grocery Outlet Holding Corp |
| Sector: Consumer Staples | |
| SubSector: Grocery Stores | |
| MarketCap: 1797.25 Millions | |
| Recent Price: 16.18 Smart Investing & Trading Score: 50 | |
| Day Percent Change: -0.123457% Day Change: -0.11 | |
| Week Change: 4.05145% Year-to-date Change: -0.7% | |
| GO Links: Profile News Message Board | |
| Charts:- Daily , Weekly | |
| Add GO to Watchlist: View: Get Complete GO Trend Analysis ➞ | |
 | DOLE Dole plc |
| Sector: Consumer Staples | |
| SubSector: Farm Products | |
| MarketCap: 1290.07 Millions | |
| Recent Price: 13.26 Smart Investing & Trading Score: 10 | |
| Day Percent Change: -1.04478% Day Change: 0.08 | |
| Week Change: -0.748503% Year-to-date Change: -0.9% | |
| DOLE Links: Profile News Message Board | |
| Charts:- Daily , Weekly | |
| Add DOLE to Watchlist: View: Get Complete DOLE Trend Analysis ➞ | |
 | SJM J.M. Smucker Co |
| Sector: Consumer Staples | |
| SubSector: Packaged Foods | |
| MarketCap: 12003.2 Millions | |
| Recent Price: 107.80 Smart Investing & Trading Score: 50 | |
| Day Percent Change: -0.663472% Day Change: 0.03 | |
| Week Change: -2.28426% Year-to-date Change: -1.3% | |
| SJM Links: Profile News Message Board | |
| Charts:- Daily , Weekly | |
| Add SJM to Watchlist: View: Get Complete SJM Trend Analysis ➞ | |
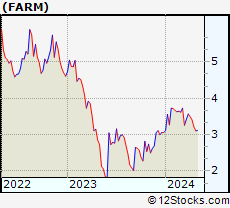 | FARM Farmer Bros. Co |
| Sector: Consumer Staples | |
| SubSector: Packaged Foods | |
| MarketCap: 43.54 Millions | |
| Recent Price: 1.76 Smart Investing & Trading Score: 40 | |
| Day Percent Change: 0.571429% Day Change: 0.02 | |
| Week Change: -3.82514% Year-to-date Change: -1.7% | |
| FARM Links: Profile News Message Board | |
| Charts:- Daily , Weekly | |
| Add FARM to Watchlist: View: Get Complete FARM Trend Analysis ➞ | |
 | NGVC Natural Grocers by Vitamin Cottage Inc |
| Sector: Consumer Staples | |
| SubSector: Grocery Stores | |
| MarketCap: 890.85 Millions | |
| Recent Price: 40.21 Smart Investing & Trading Score: 90 | |
| Day Percent Change: -1.83105% Day Change: -0.76 | |
| Week Change: 9.83338% Year-to-date Change: -2.1% | |
| NGVC Links: Profile News Message Board | |
| Charts:- Daily , Weekly | |
| Add NGVC to Watchlist: View: Get Complete NGVC Trend Analysis ➞ | |
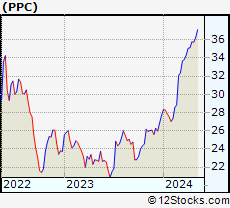 | PPC Pilgrim's Pride Corp |
| Sector: Consumer Staples | |
| SubSector: Packaged Foods | |
| MarketCap: 10521 Millions | |
| Recent Price: 40.91 Smart Investing & Trading Score: 50 | |
| Day Percent Change: -0.800194% Day Change: -0.58 | |
| Week Change: -0.968289% Year-to-date Change: -2.2% | |
| PPC Links: Profile News Message Board | |
| Charts:- Daily , Weekly | |
| Add PPC to Watchlist: View: Get Complete PPC Trend Analysis ➞ | |
 | PEP PepsiCo Inc |
| Sector: Consumer Staples | |
| SubSector: Beverages - Non-Alcoholic | |
| MarketCap: 200419 Millions | |
| Recent Price: 142.31 Smart Investing & Trading Score: 70 | |
| Day Percent Change: -0.579852% Day Change: -1.2 | |
| Week Change: 0.0984737% Year-to-date Change: -3.4% | |
| PEP Links: Profile News Message Board | |
| Charts:- Daily , Weekly | |
| Add PEP to Watchlist: View: Get Complete PEP Trend Analysis ➞ | |
 | CHGG Chegg Inc |
| Sector: Consumer Staples | |
| SubSector: Education & Training Services | |
| MarketCap: 185.24 Millions | |
| Recent Price: 1.62 Smart Investing & Trading Score: 90 | |
| Day Percent Change: 3.84615% Day Change: 0.01 | |
| Week Change: 3.18471% Year-to-date Change: -3.6% | |
| CHGG Links: Profile News Message Board | |
| Charts:- Daily , Weekly | |
| Add CHGG to Watchlist: View: Get Complete CHGG Trend Analysis ➞ | |
 | LW Lamb Weston Holdings Inc |
| Sector: Consumer Staples | |
| SubSector: Packaged Foods | |
| MarketCap: 8082.57 Millions | |
| Recent Price: 62.14 Smart Investing & Trading Score: 100 | |
| Day Percent Change: 0.209644% Day Change: 0.3 | |
| Week Change: 15.5663% Year-to-date Change: -4.0% | |
| LW Links: Profile News Message Board | |
| Charts:- Daily , Weekly | |
| Add LW to Watchlist: View: Get Complete LW Trend Analysis ➞ | |
 | KMB Kimberly-Clark Corp |
| Sector: Consumer Staples | |
| SubSector: Household & Personal Products | |
| MarketCap: 43094.9 Millions | |
| Recent Price: 122.62 Smart Investing & Trading Score: 10 | |
| Day Percent Change: -0.495009% Day Change: -0.62 | |
| Week Change: -1.05705% Year-to-date Change: -4.4% | |
| KMB Links: Profile News Message Board | |
| Charts:- Daily , Weekly | |
| Add KMB to Watchlist: View: Get Complete KMB Trend Analysis ➞ | |
| For tabular summary view of above stock list: Summary View ➞ 0 - 25 , 25 - 50 , 50 - 75 , 75 - 100 , 100 - 125 , 125 - 150 , 150 - 175 , 175 - 200 , 200 - 225 , 225 - 250 | ||
| Click To Change The Sort Order: By Market Cap or Company Size Performance: Year-to-date, Week and Day | |
| Select Chart Type: | ||
|
Best Stocks Today 12Stocks.com |
© 2025 12Stocks.com Terms & Conditions Privacy Contact Us
All Information Provided Only For Education And Not To Be Used For Investing or Trading. See Terms & Conditions


One More Thing ... Get Best Stocks Delivered Daily!
Never Ever Miss A Move With Our Top Ten Stocks Lists
Find Best Stocks In Any Market - Bull or Bear Market
Take A Peek At Our Top Ten Stocks Lists: Daily, Weekly, Year-to-Date & Top Trends
Find Best Stocks In Any Market - Bull or Bear Market
Take A Peek At Our Top Ten Stocks Lists: Daily, Weekly, Year-to-Date & Top Trends
Consumer Staples Stocks With Best Up Trends [0-bearish to 100-bullish]: Castle Brands[100], Revlon [100], Tootsie Roll[100], United Natural[100], Industrias Bachoco[100], Boston Beer[100], Tempur Sealy[100], Monster Beverage[100], Lamb Weston[100], Treehouse Foods[100], Chegg [90]
Best Consumer Staples Stocks Year-to-Date:
QuantaSing [269.91%], Village Farms[234.12%], Yatsen Holding[128.385%], Vasta Platform[119.556%], Celsius [116.544%], 51 Talk[104.387%], American Public[84.2924%], Nu Skin[81.3764%], Laureate Education[71.9008%], Adtalem Global[61.6537%], Turning Point[59.7923%] Best Consumer Staples Stocks This Week:
Revlon [1098.06%], Knoll [644.361%], Domtar [250.297%], Resolute Forest[115.465%], Ball [102.322%], Mobile Mini[82.4034%], EMBOT ANDINA-A[72.9437%], Reynolds American[68.6525%], Industrias Bachoco[59.3208%], Pinnacle Foods[55.0908%], Synutra [52.3585%] Best Consumer Staples Stocks Daily:
New Age[25%], Dean Foods[15.5909%], Navistar [7.57895%], Avon Products[5.06135%], QuantaSing [3.9%], Chegg [3.84615%], Neenah [3.50515%], WILEY (JOHN)[3.48859%], Castle Brands[3.38194%], Honest [3.38028%], Estee Lauder[2.98144%]