
 Login Sign Up


| |||||
 |  | ||||

| 12Stocks.com Market Intelligence |
Best Consumer Staples Stocks
| In a hurry? Consumer Staples Stocks: Performance Trends Table, Stock Charts
Sort Consumer Staples : Daily, Weekly, Year-to-Date, Market Cap & Trends. Filter Consumer Staples stocks list by size: All Large Mid-Range Small |
| 12Stocks.com Consumer Staples Stocks Performances & Trends Daily | |||||||||
|
|  The overall Smart Investing & Trading Score is 30 (0-bearish to 100-bullish) which puts Consumer Staples sector in short term bearish to neutral trend. The Smart Investing & Trading Score from previous trading session is 40 and a deterioration of trend continues.
| ||||||||
| Here are the Smart Investing & Trading Scores of the most requested Consumer Staples stocks at 12Stocks.com (click stock name for detailed review): |


| 12Stocks.com: Investing in Consumer Staples sector with Stocks | |
|
The following table helps investors and traders sort through current performance and trends (as measured by Smart Investing & Trading Score) of various
stocks in the Consumer Staples sector. Quick View: Move mouse or cursor over stock symbol (ticker) to view short-term Technical chart and over stock name to view long term chart. Click on  to add stock symbol to your watchlist and to add stock symbol to your watchlist and  to view watchlist. Click on any ticker or stock name for detailed market intelligence report for that stock. to view watchlist. Click on any ticker or stock name for detailed market intelligence report for that stock. |
12Stocks.com Performance of Stocks in Consumer Staples Sector
| Ticker | Stock Name | Watchlist | Category | Recent Price | Smart Investing & Trading Score | Change % | Weekly Change% |
| CLX | Clorox Co |   | Household & Household | 122.25 | 10 | -0.35% | -0.67% |
| UDMY | Udemy | | Education & Training | 6.83 | 40 | 1.04% | -0.73% |
| DOLE | Dole | | Farm | 13.26 | 10 | -1.04% | -0.75% |
| PPC | Pilgrim's Pride | | Packaged Foods | 40.91 | 50 | -0.80% | -0.97% |
| HSY | Hershey | | Confectioners | 189.02 | 80 | 0.10% | -0.98% |
| AKO.B | EMBOT ANDINA-B | | BEVERAGES-SOFT | 10.70 | 20 | 0.75% | -1.02% |
| KMB | Kimberly-Clark Corp | | Household & Household | 122.62 | 10 | -0.50% | -1.06% |
| VLGEA | Village Super | | Grocery Stores | 36.91 | 40 | -1.91% | -1.07% |
| LMNR | Limoneira Co | | Farm | 14.82 | 30 | -0.67% | -1.07% |
| FBHS | Fortune Brands | | Home Furnishings & Fixtures | 60.80 | 30 | -2.81% | -1.07% |
| LND | Brasilagro Companhia | | Farm | 3.81 | 50 | -1.86% | -1.09% |
| WMT | Walmart | | Discount Stores | 101.57 | 20 | -0.38% | -1.13% |
| CVGW | Calavo Growers | | Food Distribution | 25.99 | 20 | 0.30% | -1.14% |
| WEST | Westrock Coffee | | Packaged Foods | 4.89 | 60 | 2.73% | -1.21% |
| NUS | Nu Skin | | Household & Household | 11.72 | 40 | -2.41% | -1.26% |
| DDL | Dingdong (Cayman) | | Grocery Stores | 2.06 | 10 | 0.00% | -1.44% |
| JJSF | J&J Snack | | Packaged Foods | 96.76 | 50 | -1.59% | -1.50% |
| FMX | Fomento Economico | | Beverages | 96.32 | 50 | 0.80% | -1.53% |
| GIS | General Mills | | Packaged Foods | 50.32 | 90 | -0.75% | -1.55% |
| VITL | Vital Farms | | Farm | 41.23 | 50 | 1.40% | -1.60% |
| WBC | WABCO | | Auto Parts | 46.70 | 30 | -0.53% | -1.62% |
| KOF | Coca-Cola Femsa | | Beverages - Non-Alcoholic | 82.27 | 0 | 0.00% | -1.88% |
| UL | Unilever | | Household & Household | 58.94 | 20 | 0.22% | -1.91% |
| BRBR | Bellring Brands | | Packaged Foods | 35.86 | 30 | -1.02% | -1.91% |
| CCU | Compania Cervecerias | | Beverages | 11.65 | 10 | -1.44% | -1.94% |
| For chart view version of above stock list: Chart View ➞ 0 - 25 , 25 - 50 , 50 - 75 , 75 - 100 , 100 - 125 , 125 - 150 , 150 - 175 , 175 - 200 , 200 - 225 , 225 - 250 | ||
 | Click To Change The Sort Order: By Market Cap or Company Size Performance: Year-to-date, Week and Day |  |
|
Get the most comprehensive stock market coverage daily at 12Stocks.com ➞ Best Stocks Today ➞ Best Stocks Weekly ➞ Best Stocks Year-to-Date ➞ Best Stocks Trends ➞  Best Stocks Today 12Stocks.com Best Nasdaq Stocks ➞ Best S&P 500 Stocks ➞ Best Tech Stocks ➞ Best Biotech Stocks ➞ |
| Detailed Overview of Consumer Staples Stocks |
| Consumer Staples Technical Overview, Leaders & Laggards, Top Consumer Staples ETF Funds & Detailed Consumer Staples Stocks List, Charts, Trends & More |
| Consumer Staples Sector: Technical Analysis, Trends & YTD Performance | |
| Consumer Staples sector is composed of stocks
from household consumer products, food, farm, cosmetics, tobacco,
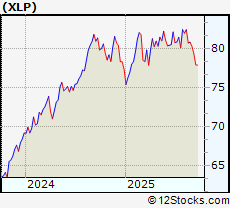
and beverages subsectors. Consumer Staples sector, as represented by XLP, an exchange-traded fund [ETF] that holds basket of Consumer Staples stocks (e.g, Proctor & Gamble, Pepsi) is up by 0.66399% and is currently underperforming the overall market by -14.09391% year-to-date. Below is a quick view of Technical charts and trends: |
|
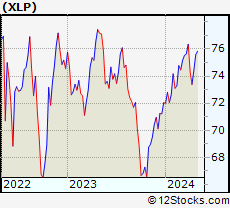
 XLP Weekly Chart |
|
| Long Term Trend: Not Good | |
| Medium Term Trend: Not Good | |
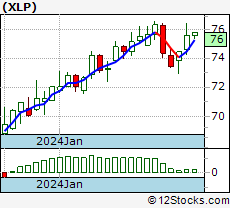
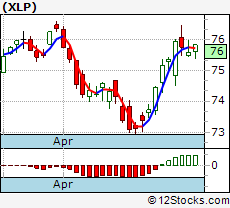 XLP Daily Chart |
|
| Short Term Trend: Deteriorating | |
| Overall Trend Score: 30 | |
| YTD Performance: 0.66399% | |
| **Trend Scores & Views Are Only For Educational Purposes And Not For Investing | |
| 12Stocks.com: Top Performing Consumer Staples Sector Stocks | ||||||||||||||||||||||||||||||||||||||||||||||||
 The top performing Consumer Staples sector stocks year to date are
Now, more recently, over last week, the top performing Consumer Staples sector stocks on the move are


|
||||||||||||||||||||||||||||||||||||||||||||||||
| 12Stocks.com: Investing in Consumer Staples Sector using Exchange Traded Funds | |
|
The following table shows list of key exchange traded funds (ETF) that
help investors track Consumer Staples Index. For detailed view, check out our ETF Funds section of our website. Quick View: Move mouse or cursor over ETF symbol (ticker) to view short-term Technical chart and over ETF name to view long term chart. Click on ticker or stock name for detailed view. Click on to add stock symbol to your watchlist and to view watchlist. |
12Stocks.com List of ETFs that track Consumer Staples Index
| Ticker | ETF Name | Watchlist | Recent Price | Smart Investing & Trading Score | Change % | Week % | Year-to-date % |
| 12Stocks.com: Charts, Trends, Fundamental Data and Performances of Consumer Staples Stocks | |
|
We now take in-depth look at all Consumer Staples stocks including charts, multi-period performances and overall trends (as measured by Smart Investing & Trading Score). One can sort Consumer Staples stocks (click link to choose) by Daily, Weekly and by Year-to-Date performances. Also, one can sort by size of the company or by market capitalization. |
| Select Your Default Chart Type: | |||||
| |||||
| Click on stock symbol or name for detailed view. Click on to add stock symbol to your watchlist and to view watchlist. Quick View: Move mouse or cursor over "Daily" to quickly view daily Technical stock chart and over "Weekly" to view weekly Technical stock chart. | |||||
 | CLX Clorox Co |
| Sector: Consumer Staples | |
| SubSector: Household & Personal Products | |
| MarketCap: 15537 Millions | |
| Recent Price: 122.25 Smart Investing & Trading Score: 10 | |
| Day Percent Change: -0.350505% Day Change: -0.33 | |
| Week Change: -0.674358% Year-to-date Change: -23.2% | |
| CLX Links: Profile News Message Board | |
| Charts:- Daily , Weekly | |
| Add CLX to Watchlist: View: Get Complete CLX Trend Analysis ➞ | |
 | UDMY Udemy Inc |
| Sector: Consumer Staples | |
| SubSector: Education & Training Services | |
| MarketCap: 1004.3 Millions | |
| Recent Price: 6.83 Smart Investing & Trading Score: 40 | |
| Day Percent Change: 1.04% Day Change: 0.07 | |
| Week Change: -0.73% Year-to-date Change: -17.6% | |
| UDMY Links: Profile News Message Board | |
| Charts:- Daily , Weekly | |
| Add UDMY to Watchlist: View: Get Complete UDMY Trend Analysis ➞ | |
 | DOLE Dole plc |
| Sector: Consumer Staples | |
| SubSector: Farm Products | |
| MarketCap: 1290.07 Millions | |
| Recent Price: 13.26 Smart Investing & Trading Score: 10 | |
| Day Percent Change: -1.04478% Day Change: 0.08 | |
| Week Change: -0.748503% Year-to-date Change: -0.9% | |
| DOLE Links: Profile News Message Board | |
| Charts:- Daily , Weekly | |
| Add DOLE to Watchlist: View: Get Complete DOLE Trend Analysis ➞ | |
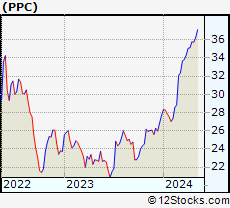 | PPC Pilgrim's Pride Corp |
| Sector: Consumer Staples | |
| SubSector: Packaged Foods | |
| MarketCap: 10521 Millions | |
| Recent Price: 40.91 Smart Investing & Trading Score: 50 | |
| Day Percent Change: -0.800194% Day Change: -0.58 | |
| Week Change: -0.968289% Year-to-date Change: -2.2% | |
| PPC Links: Profile News Message Board | |
| Charts:- Daily , Weekly | |
| Add PPC to Watchlist: View: Get Complete PPC Trend Analysis ➞ | |
 | HSY Hershey Company |
| Sector: Consumer Staples | |
| SubSector: Confectioners | |
| MarketCap: 37601.3 Millions | |
| Recent Price: 189.02 Smart Investing & Trading Score: 80 | |
| Day Percent Change: 0.10062% Day Change: 0.68 | |
| Week Change: -0.979622% Year-to-date Change: 13.9% | |
| HSY Links: Profile News Message Board | |
| Charts:- Daily , Weekly | |
| Add HSY to Watchlist: View: Get Complete HSY Trend Analysis ➞ | |
 | AKO.B EMBOT ANDINA-B |
| Sector: Consumer Staples | |
| SubSector: BEVERAGES-SOFT | |
| MarketCap: 1216.41 Millions | |
| Recent Price: 10.70 Smart Investing & Trading Score: 20 | |
| Day Percent Change: 0.753296% Day Change: -9999 | |
| Week Change: -1.01758% Year-to-date Change: 0.0% | |
| AKO.B Links: Profile News Message Board | |
| Charts:- Daily , Weekly | |
| Add AKO.B to Watchlist: View: Get Complete AKO.B Trend Analysis ➞ | |
 | KMB Kimberly-Clark Corp |
| Sector: Consumer Staples | |
| SubSector: Household & Personal Products | |
| MarketCap: 43094.9 Millions | |
| Recent Price: 122.62 Smart Investing & Trading Score: 10 | |
| Day Percent Change: -0.495009% Day Change: -0.62 | |
| Week Change: -1.05705% Year-to-date Change: -4.4% | |
| KMB Links: Profile News Message Board | |
| Charts:- Daily , Weekly | |
| Add KMB to Watchlist: View: Get Complete KMB Trend Analysis ➞ | |
 | VLGEA Village Super Market, Inc |
| Sector: Consumer Staples | |
| SubSector: Grocery Stores | |
| MarketCap: 495.11 Millions | |
| Recent Price: 36.91 Smart Investing & Trading Score: 40 | |
| Day Percent Change: -1.91337% Day Change: -0.31 | |
| Week Change: -1.0721% Year-to-date Change: 19.1% | |
| VLGEA Links: Profile News Message Board | |
| Charts:- Daily , Weekly | |
| Add VLGEA to Watchlist: View: Get Complete VLGEA Trend Analysis ➞ | |
 | LMNR Limoneira Co |
| Sector: Consumer Staples | |
| SubSector: Farm Products | |
| MarketCap: 284.95 Millions | |
| Recent Price: 14.82 Smart Investing & Trading Score: 30 | |
| Day Percent Change: -0.670241% Day Change: 0.28 | |
| Week Change: -1.06809% Year-to-date Change: -38.6% | |
| LMNR Links: Profile News Message Board | |
| Charts:- Daily , Weekly | |
| Add LMNR to Watchlist: View: Get Complete LMNR Trend Analysis ➞ | |
 | FBHS Fortune Brands Home & Security, Inc. |
| Sector: Consumer Staples | |
| SubSector: Home Furnishings & Fixtures | |
| MarketCap: 5906.85 Millions | |
| Recent Price: 60.80 Smart Investing & Trading Score: 30 | |
| Day Percent Change: -2.8133% Day Change: -9999 | |
| Week Change: -1.07387% Year-to-date Change: 0.0% | |
| FBHS Links: Profile News Message Board | |
| Charts:- Daily , Weekly | |
| Add FBHS to Watchlist: View: Get Complete FBHS Trend Analysis ➞ | |
 | LND Brasilagro Companhia Brasileira De Propriedade Agricola ADR |
| Sector: Consumer Staples | |
| SubSector: Farm Products | |
| MarketCap: 397.44 Millions | |
| Recent Price: 3.81 Smart Investing & Trading Score: 50 | |
| Day Percent Change: -1.85567% Day Change: 0 | |
| Week Change: -1.09091% Year-to-date Change: 3.8% | |
| LND Links: Profile News Message Board | |
| Charts:- Daily , Weekly | |
| Add LND to Watchlist: View: Get Complete LND Trend Analysis ➞ | |
 | WMT Walmart Inc |
| Sector: Consumer Staples | |
| SubSector: Discount Stores | |
| MarketCap: 801351 Millions | |
| Recent Price: 101.57 Smart Investing & Trading Score: 20 | |
| Day Percent Change: -0.382503% Day Change: 0.05 | |
| Week Change: -1.12917% Year-to-date Change: 13.4% | |
| WMT Links: Profile News Message Board | |
| Charts:- Daily , Weekly | |
| Add WMT to Watchlist: View: Get Complete WMT Trend Analysis ➞ | |
 | CVGW Calavo Growers, Inc |
| Sector: Consumer Staples | |
| SubSector: Food Distribution | |
| MarketCap: 484.81 Millions | |
| Recent Price: 25.99 Smart Investing & Trading Score: 20 | |
| Day Percent Change: 0.304902% Day Change: 0.13 | |
| Week Change: -1.14492% Year-to-date Change: 4.4% | |
| CVGW Links: Profile News Message Board | |
| Charts:- Daily , Weekly | |
| Add CVGW to Watchlist: View: Get Complete CVGW Trend Analysis ➞ | |
 | WEST Westrock Coffee Company |
| Sector: Consumer Staples | |
| SubSector: Packaged Foods | |
| MarketCap: 498.16 Millions | |
| Recent Price: 4.89 Smart Investing & Trading Score: 60 | |
| Day Percent Change: 2.73109% Day Change: -0.03 | |
| Week Change: -1.21212% Year-to-date Change: -23.0% | |
| WEST Links: Profile News Message Board | |
| Charts:- Daily , Weekly | |
| Add WEST to Watchlist: View: Get Complete WEST Trend Analysis ➞ | |
 | NUS Nu Skin Enterprises, Inc |
| Sector: Consumer Staples | |
| SubSector: Household & Personal Products | |
| MarketCap: 568.73 Millions | |
| Recent Price: 11.72 Smart Investing & Trading Score: 40 | |
| Day Percent Change: -2.41465% Day Change: -0.38 | |
| Week Change: -1.26369% Year-to-date Change: 81.4% | |
| NUS Links: Profile News Message Board | |
| Charts:- Daily , Weekly | |
| Add NUS to Watchlist: View: Get Complete NUS Trend Analysis ➞ | |
 | DDL Dingdong (Cayman) Ltd ADR |
| Sector: Consumer Staples | |
| SubSector: Grocery Stores | |
| MarketCap: 391.49 Millions | |
| Recent Price: 2.06 Smart Investing & Trading Score: 10 | |
| Day Percent Change: 0% Day Change: -0.11 | |
| Week Change: -1.43541% Year-to-date Change: -36.4% | |
| DDL Links: Profile News Message Board | |
| Charts:- Daily , Weekly | |
| Add DDL to Watchlist: View: Get Complete DDL Trend Analysis ➞ | |
 | JJSF J&J Snack Foods Corp |
| Sector: Consumer Staples | |
| SubSector: Packaged Foods | |
| MarketCap: 2121.98 Millions | |
| Recent Price: 96.76 Smart Investing & Trading Score: 50 | |
| Day Percent Change: -1.58666% Day Change: 0.09 | |
| Week Change: -1.49649% Year-to-date Change: -36.3% | |
| JJSF Links: Profile News Message Board | |
| Charts:- Daily , Weekly | |
| Add JJSF to Watchlist: View: Get Complete JJSF Trend Analysis ➞ | |
 | FMX Fomento Economico Mexicano S.A.B. de C.V. ADR |
| Sector: Consumer Staples | |
| SubSector: Beverages - Brewers | |
| MarketCap: 17575.6 Millions | |
| Recent Price: 96.32 Smart Investing & Trading Score: 50 | |
| Day Percent Change: 0.795312% Day Change: -0.63 | |
| Week Change: -1.53343% Year-to-date Change: 18.3% | |
| FMX Links: Profile News Message Board | |
| Charts:- Daily , Weekly | |
| Add FMX to Watchlist: View: Get Complete FMX Trend Analysis ➞ | |
 | GIS General Mills, Inc |
| Sector: Consumer Staples | |
| SubSector: Packaged Foods | |
| MarketCap: 27044.4 Millions | |
| Recent Price: 50.32 Smart Investing & Trading Score: 90 | |
| Day Percent Change: -0.749507% Day Change: -0.41 | |
| Week Change: -1.54569% Year-to-date Change: -18.2% | |
| GIS Links: Profile News Message Board | |
| Charts:- Daily , Weekly | |
| Add GIS to Watchlist: View: Get Complete GIS Trend Analysis ➞ | |
 | VITL Vital Farms Inc |
| Sector: Consumer Staples | |
| SubSector: Farm Products | |
| MarketCap: 2284.35 Millions | |
| Recent Price: 41.23 Smart Investing & Trading Score: 50 | |
| Day Percent Change: 1.40187% Day Change: 0.4 | |
| Week Change: -1.59905% Year-to-date Change: 6.2% | |
| VITL Links: Profile News Message Board | |
| Charts:- Daily , Weekly | |
| Add VITL to Watchlist: View: Get Complete VITL Trend Analysis ➞ | |
 | WBC WABCO Holdings Inc. |
| Sector: Consumer Staples | |
| SubSector: Auto Parts | |
| MarketCap: 6775.79 Millions | |
| Recent Price: 46.70 Smart Investing & Trading Score: 30 | |
| Day Percent Change: -0.532481% Day Change: -9999 | |
| Week Change: -1.62208% Year-to-date Change: 0.0% | |
| WBC Links: Profile News Message Board | |
| Charts:- Daily , Weekly | |
| Add WBC to Watchlist: View: Get Complete WBC Trend Analysis ➞ | |
 | KOF Coca-Cola Femsa S.A.B. DE C.V. ADR |
| Sector: Consumer Staples | |
| SubSector: Beverages - Non-Alcoholic | |
| MarketCap: 4385.42 Millions | |
| Recent Price: 82.27 Smart Investing & Trading Score: 0 | |
| Day Percent Change: 0% Day Change: 2 | |
| Week Change: -1.88432% Year-to-date Change: 8.0% | |
| KOF Links: Profile News Message Board | |
| Charts:- Daily , Weekly | |
| Add KOF to Watchlist: View: Get Complete KOF Trend Analysis ➞ | |
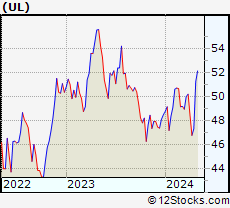 | UL Unilever plc ADR |
| Sector: Consumer Staples | |
| SubSector: Household & Personal Products | |
| MarketCap: 157678 Millions | |
| Recent Price: 58.94 Smart Investing & Trading Score: 20 | |
| Day Percent Change: 0.221051% Day Change: -0.02 | |
| Week Change: -1.9138% Year-to-date Change: 6.0% | |
| UL Links: Profile News Message Board | |
| Charts:- Daily , Weekly | |
| Add UL to Watchlist: View: Get Complete UL Trend Analysis ➞ | |
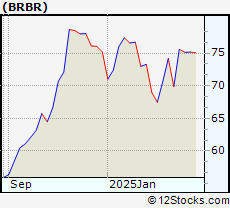 | BRBR Bellring Brands Inc |
| Sector: Consumer Staples | |
| SubSector: Packaged Foods | |
| MarketCap: 4971.14 Millions | |
| Recent Price: 35.86 Smart Investing & Trading Score: 30 | |
| Day Percent Change: -1.02125% Day Change: -0.91 | |
| Week Change: -1.91466% Year-to-date Change: -51.9% | |
| BRBR Links: Profile News Message Board | |
| Charts:- Daily , Weekly | |
| Add BRBR to Watchlist: View: Get Complete BRBR Trend Analysis ➞ | |
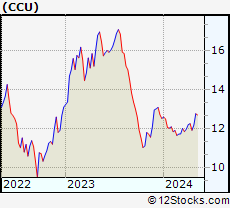 | CCU Compania Cervecerias Unidas S.A. ADR |
| Sector: Consumer Staples | |
| SubSector: Beverages - Brewers | |
| MarketCap: 2287.21 Millions | |
| Recent Price: 11.65 Smart Investing & Trading Score: 10 | |
| Day Percent Change: -1.43824% Day Change: -0.07 | |
| Week Change: -1.93603% Year-to-date Change: 3.5% | |
| CCU Links: Profile News Message Board | |
| Charts:- Daily , Weekly | |
| Add CCU to Watchlist: View: Get Complete CCU Trend Analysis ➞ | |
| For tabular summary view of above stock list: Summary View ➞ 0 - 25 , 25 - 50 , 50 - 75 , 75 - 100 , 100 - 125 , 125 - 150 , 150 - 175 , 175 - 200 , 200 - 225 , 225 - 250 | ||
| Click To Change The Sort Order: By Market Cap or Company Size Performance: Year-to-date, Week and Day | |
| Select Chart Type: | ||
|
Best Stocks Today 12Stocks.com |
© 2025 12Stocks.com Terms & Conditions Privacy Contact Us
All Information Provided Only For Education And Not To Be Used For Investing or Trading. See Terms & Conditions


One More Thing ... Get Best Stocks Delivered Daily!
Never Ever Miss A Move With Our Top Ten Stocks Lists
Find Best Stocks In Any Market - Bull or Bear Market
Take A Peek At Our Top Ten Stocks Lists: Daily, Weekly, Year-to-Date & Top Trends
Find Best Stocks In Any Market - Bull or Bear Market
Take A Peek At Our Top Ten Stocks Lists: Daily, Weekly, Year-to-Date & Top Trends
Consumer Staples Stocks With Best Up Trends [0-bearish to 100-bullish]: Castle Brands[100], Revlon [100], Tootsie Roll[100], United Natural[100], Industrias Bachoco[100], Boston Beer[100], Tempur Sealy[100], Monster Beverage[100], Lamb Weston[100], Treehouse Foods[100], Chegg [90]
Best Consumer Staples Stocks Year-to-Date:
QuantaSing [269.91%], Village Farms[234.12%], Yatsen Holding[128.385%], Vasta Platform[119.556%], Celsius [116.544%], 51 Talk[104.387%], American Public[84.2924%], Nu Skin[81.3764%], Laureate Education[71.9008%], Adtalem Global[61.6537%], Turning Point[59.7923%] Best Consumer Staples Stocks This Week:
Revlon [1098.06%], Knoll [644.361%], Domtar [250.297%], Resolute Forest[115.465%], Ball [102.322%], Mobile Mini[82.4034%], EMBOT ANDINA-A[72.9437%], Reynolds American[68.6525%], Industrias Bachoco[59.3208%], Pinnacle Foods[55.0908%], Synutra [52.3585%] Best Consumer Staples Stocks Daily:
New Age[25%], Dean Foods[15.5909%], Navistar [7.57895%], Avon Products[5.06135%], QuantaSing [3.9%], Chegg [3.84615%], Neenah [3.50515%], WILEY (JOHN)[3.48859%], Castle Brands[3.38194%], Honest [3.38028%], Estee Lauder[2.98144%]