
 Login Sign Up


| |||||
 |  | ||||

| 12Stocks.com Market Intelligence |
Best China Stocks
|
On this page, you will find the most comprehensive analysis of Chinese stocks and ETFs - from latest trends to performances to charts ➞. First, here are the year-to-date (YTD) performances of the most requested China stocks at 12Stocks.com (click stock for review):
| Alibaba 34% | ||
| Weibo 32% | ||
| NetEase 32% | ||
| Vipshop 31% | ||
| Sohu.com 18% | ||
| Baidu 8% | ||
| JD.com -22% | ||
| New Oriental -26% | ||
| In a hurry? China Stocks Lists: Performance Trends Table, Stock Charts
Sort China stocks: Daily, Weekly, Year-to-Date, Market Cap & Trends. Filter China stocks list by sector: Show all, Tech, Finance, Energy, Staples, Retail, Industrial, Materials, Utilities and HealthCare Filter China stocks list by size: All China Large Medium Small and MicroCap |
| September 5, 2025 - 12Stocks.com China Stocks Performances & Trends Daily | |||||||||
|
|  The overall Smart Investing & Trading Score is 40 (0-bearish to 100-bullish) which puts China index in short term bearish to neutral trend. The Smart Investing & Trading Score from previous trading session is 90 and hence a deterioration of trend.
| ||||||||
Here are the Smart Investing & Trading Scores of the most requested China stocks at 12Stocks.com (click stock name for detailed review):
|


| 12Stocks.com: Top Performing China Index Stocks | |||||||||||||||||||||||||||||||||||||||||||||||
 The top performing China Index stocks year to date are
Now, more recently, over last week, the top performing China Index stocks on the move are


|
|||||||||||||||||||||||||||||||||||||||||||||||
| 12Stocks.com: Investing in China Index with Stocks | |
|
The following table helps investors and traders sort through current performance and trends (as measured by Smart Investing & Trading Score) of various
stocks in the China Index. Quick View: Move mouse or cursor over stock symbol (ticker) to view short-term technical chart and over stock name to view long term chart. Click on  to add stock symbol to your watchlist and to add stock symbol to your watchlist and  to view watchlist. Click on any ticker or stock name for detailed market intelligence report for that stock. to view watchlist. Click on any ticker or stock name for detailed market intelligence report for that stock. |
12Stocks.com Performance of Stocks in China Index
| Ticker | Stock Name | Watchlist | Category | Recent Price | Smart Investing & Trading Score | Change % | YTD Change% |
| TUYA | Tuya |   | Technology | 2.66 | 40 | 3.02 | 35.17% |
| EDTK | Skillful Craftsman | | Consumer Staples | 1.14 | 20 | 2.97 | 2.97% |
| SFWL | Shengfeng Development | | Industrials | 1.13 | 59 | 2.94 | -3.73% |
| JG | Aurora Mobile | | Technology | 10.39 | 20 | 2.90 | 30.43% |
| UXIN | Uxin | | Technology | 3.49 | 40 | 2.77 | -19.87% |
| CMCM | Cheetah Mobile | | Technology | 6.01 | 80 | 2.75 | 21.74% |
| LX | LexinFintech | | Financials | 6.32 | 0 | 2.66 | 14.89% |
| YGMZ | MingZhu Logistics | | Industrials | 1.01 | 30 | 2.52 | -30.70% |
| BZUN | Baozun | | Services & Goods | 3.39 | 100 | 2.51 | 5.15% |
| NIU | Niu | | Consumer Staples | 4.37 | 30 | 2.42 | 159.78% |
| MOGU | MOGU | | Services & Goods | 2.39 | 90 | 2.36 | 0.00% |
| HTHT | Huazhu | | Services & Goods | 36.85 | 80 | 2.19 | 12.31% |
| CANG | Cango | | Technology | 4.77 | 30 | 2.18 | 6.59% |
| STG | Sunlands | | Services & Goods | 9.51 | 20 | 2.18 | 74.16% |
| IQ | iQIYI | | Technology | 2.65 | 100 | 2.17 | 16.92% |
| UCAR | U Power | | Services & Goods | 1.99 | 68 | 2.06 | -70.14% |
| API | Agora | | Technology | 3.45 | 10 | 2.02 | -14.90% |
| AGMH | AGM | | Technology | 1.96 | 30 | 1.98 | -97.27% |
| RERE | ATRenew | | Services & Goods | 4.72 | 50 | 1.97 | 61.46% |
| BIDU | Baidu | | Technology | 98.21 | 100 | 1.88 | 8.40% |
| RGC | Regencell Bioscience | | Health Care | 14.05 | 20 | 1.87 | NA |
| VIPS | Vipshop | | Services & Goods | 16.74 | 80 | 1.80 | 30.68% |
| SOHU | Sohu.com | | Technology | 16.07 | 50 | 1.77 | 17.83% |
| MOMO | Momo | | Technology | 8.30 | 60 | 1.63 | 11.50% |
| ATAT | Atour Lifestyle | | Services & Goods | 38.92 | 51 | 1.56 | 30.01% |
| For chart view version of above stock list: Chart View ➞ 0 - 25 , 25 - 50 , 50 - 75 , 75 - 100 , 100 - 125 | ||
 | Click To Change The Sort Order: By Market Cap or Company Size Performance: Year-to-date, Week and Day |  |
|
Get the most comprehensive stock market coverage daily at 12Stocks.com ➞ Best Stocks Today ➞ Best Stocks Weekly ➞ Best Stocks Year-to-Date ➞ Best Stocks Trends ➞  Best Stocks Today 12Stocks.com Best Nasdaq Stocks ➞ Best S&P 500 Stocks ➞ Best Tech Stocks ➞ Best Biotech Stocks ➞ |
| Detailed Overview of China Stocks |
| China Technical Overview, Leaders & Laggards, Top China ETF Funds & Detailed China Stocks List, Charts, Trends & More |
| China: Technical Analysis, Trends & YTD Performance | |
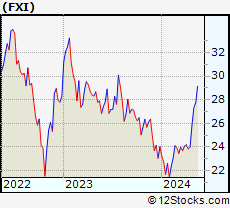
 FXI Weekly Chart |
|
| Long Term Trend: Very Good | |
| Medium Term Trend: Deteriorating | |
 FXI Daily Chart |
|
| Short Term Trend: Not Good | |
| Overall Trend Score: 40 | |
| YTD Performance: 20.19% | |
| **Trend Scores & Views Are Only For Educational Purposes And Not For Investing | |
| 12Stocks.com: Investing in China Index using Exchange Traded Funds | |
|
The following table shows list of key exchange traded funds (ETF) that
help investors play China stock market. For detailed view, check out our ETF Funds section of our website. Quick View: Move mouse or cursor over ETF symbol (ticker) to view short-term technical chart and over ETF name to view long term chart. Click on ticker or stock name for detailed view. Click on to add stock symbol to your watchlist and to view watchlist. |
12Stocks.com List of ETFs that track China Index
| Ticker | ETF Name | Watchlist | Recent Price | Smart Investing & Trading Score | Change % | Week % | Year-to-date % |
| FXI | China Large-Cap | | 38.33 | 40 | -1.49 | -1.49 | 20.19% |
| EWH | Hong Kong | | 21.16 | 30 | 1.46 | 1.37 | 33% |
| HAO | China Small Cap | | 1.17 | 20 | 3.42 | 1.68 | -51.6% |
| YINN | China Bull 3X | | 46.80 | 30 | 6.42 | 6.3 | 55.38% |
| YANG | China Bear 3X | | 25.72 | 60 | 0.49 | -0.15 | -60.96% |
| XPP | China 50 | | 27.62 | 30 | 4.34 | 4.3 | 42.61% |
| MCHI | China | | 61.31 | 60 | 0.13 | 1.18 | 29.31% |
| GXC | China | | 98.55 | 60 | 0.22 | 1.96 | 26.85% |
| CBON | ChinaAMC China Bond | | 22.51 | 70 | 0.02 | -0.22 | 1.79% |
| 12Stocks.com: Charts, Trends, Fundamental Data and Performances of China Stocks | |
|
We now take in-depth look at all China stocks including charts, multi-period performances and overall trends (as measured by Smart Investing & Trading Score). One can sort China stocks (click link to choose) by Daily, Weekly and by Year-to-Date performances. Also, one can sort by size of the company or by market capitalization. |
| Select Your Default Chart Type: | |||||
| |||||
| Click on stock symbol or name for detailed view. Click on to add stock symbol to your watchlist and to view watchlist. Quick View: Move mouse or cursor over "Daily" to quickly view daily technical stock chart and over "Weekly" to view weekly technical stock chart. | |||||

 | TUYA Tuya Inc. |
| Sector: Technology | |
| SubSector: Software - Infrastructure | |
| MarketCap: 1050 Millions | |
| Recent Price: 2.66 Smart Investing & Trading Score: 40 | |
| Day Percent Change: 3.02% Day Change: 0.07 | |
| Week Change: -1.24% Year-to-date Change: 35.2% | |
| TUYA Links: Profile News Message Board | |
| Charts:- Daily , Weekly | |
| Add TUYA to Watchlist: View: Get Complete TUYA Trend Analysis ➞ | |
 | EDTK Skillful Craftsman Education Technology Limited |
| Sector: Consumer Staples | |
| SubSector: Education & Training Services | |
| MarketCap: 32347 Millions | |
| Recent Price: 1.14 Smart Investing & Trading Score: 20 | |
| Day Percent Change: 2.97% Day Change: 0.03 | |
| Week Change: 0.97% Year-to-date Change: 3.0% | |
| EDTK Links: Profile News Message Board | |
| Charts:- Daily , Weekly | |
| Add EDTK to Watchlist: View: Get Complete EDTK Trend Analysis ➞ | |
 | SFWL Shengfeng Development Limited |
| Sector: Industrials | |
| SubSector: Integrated Freight & Logistics | |
| MarketCap: 747 Millions | |
| Recent Price: 1.13 Smart Investing & Trading Score: 59 | |
| Day Percent Change: 2.94% Day Change: 0.03 | |
| Week Change: 0.94% Year-to-date Change: -3.7% | |
| SFWL Links: Profile News Message Board | |
| Charts:- Daily , Weekly | |
| Add SFWL to Watchlist: View: Get Complete SFWL Trend Analysis ➞ | |
 | JG Aurora Mobile Limited |
| Sector: Technology | |
| SubSector: Application Software | |
| MarketCap: 268.762 Millions | |
| Recent Price: 10.39 Smart Investing & Trading Score: 20 | |
| Day Percent Change: 2.9% Day Change: 0.26 | |
| Week Change: 2.93% Year-to-date Change: 30.4% | |
| JG Links: Profile News Message Board | |
| Charts:- Daily , Weekly | |
| Add JG to Watchlist: View: Get Complete JG Trend Analysis ➞ | |
 | UXIN Uxin Limited |
| Sector: Technology | |
| SubSector: Internet Information Providers | |
| MarketCap: 414.58 Millions | |
| Recent Price: 3.49 Smart Investing & Trading Score: 40 | |
| Day Percent Change: 2.77% Day Change: 0.1 | |
| Week Change: -2.24% Year-to-date Change: -19.9% | |
| UXIN Links: Profile News Message Board | |
| Charts:- Daily , Weekly | |
| Add UXIN to Watchlist: View: Get Complete UXIN Trend Analysis ➞ | |
 | CMCM Cheetah Mobile Inc. |
| Sector: Technology | |
| SubSector: Application Software | |
| MarketCap: 343.362 Millions | |
| Recent Price: 6.01 Smart Investing & Trading Score: 80 | |
| Day Percent Change: 2.75% Day Change: 0.15 | |
| Week Change: 13.59% Year-to-date Change: 21.7% | |
| CMCM Links: Profile News Message Board | |
| Charts:- Daily , Weekly | |
| Add CMCM to Watchlist: View: Get Complete CMCM Trend Analysis ➞ | |
 | LX LexinFintech Holdings Ltd. |
| Sector: Financials | |
| SubSector: Credit Services | |
| MarketCap: 1674.18 Millions | |
| Recent Price: 6.32 Smart Investing & Trading Score: 0 | |
| Day Percent Change: 2.66% Day Change: 0.17 | |
| Week Change: -1.35% Year-to-date Change: 14.9% | |
| LX Links: Profile News Message Board | |
| Charts:- Daily , Weekly | |
| Add LX to Watchlist: View: Get Complete LX Trend Analysis ➞ | |
 | YGMZ MingZhu Logistics Holdings Limited |
| Sector: Industrials | |
| SubSector: Trucking | |
| MarketCap: 41627 Millions | |
| Recent Price: 1.01 Smart Investing & Trading Score: 30 | |
| Day Percent Change: 2.52% Day Change: 0.02 | |
| Week Change: -12.31% Year-to-date Change: -30.7% | |
| YGMZ Links: Profile News Message Board | |
| Charts:- Daily , Weekly | |
| Add YGMZ to Watchlist: View: Get Complete YGMZ Trend Analysis ➞ | |
 | BZUN Baozun Inc. |
| Sector: Services & Goods | |
| SubSector: Catalog & Mail Order Houses | |
| MarketCap: 1668.92 Millions | |
| Recent Price: 3.39 Smart Investing & Trading Score: 100 | |
| Day Percent Change: 2.51% Day Change: 0.07 | |
| Week Change: 4% Year-to-date Change: 5.2% | |
| BZUN Links: Profile News Message Board | |
| Charts:- Daily , Weekly | |
| Add BZUN to Watchlist: View: Get Complete BZUN Trend Analysis ➞ | |
 | NIU Niu Technologies |
| Sector: Consumer Staples | |
| SubSector: Auto Manufacturers - Major | |
| MarketCap: 543.271 Millions | |
| Recent Price: 4.37 Smart Investing & Trading Score: 30 | |
| Day Percent Change: 2.42% Day Change: 0.11 | |
| Week Change: -7.19% Year-to-date Change: 159.8% | |
| NIU Links: Profile News Message Board | |
| Charts:- Daily , Weekly | |
| Add NIU to Watchlist: View: Get Complete NIU Trend Analysis ➞ | |
 | MOGU MOGU Inc. |
| Sector: Services & Goods | |
| SubSector: Specialty Retail, Other | |
| MarketCap: 168.844 Millions | |
| Recent Price: 2.39 Smart Investing & Trading Score: 90 | |
| Day Percent Change: 2.36% Day Change: 0.05 | |
| Week Change: -8.82% Year-to-date Change: 0.0% | |
| MOGU Links: Profile News Message Board | |
| Charts:- Daily , Weekly | |
| Add MOGU to Watchlist: View: Get Complete MOGU Trend Analysis ➞ | |
 | HTHT Huazhu Group Limited |
| Sector: Services & Goods | |
| SubSector: Lodging | |
| MarketCap: 9164.46 Millions | |
| Recent Price: 36.85 Smart Investing & Trading Score: 80 | |
| Day Percent Change: 2.19% Day Change: 0.77 | |
| Week Change: 8.16% Year-to-date Change: 12.3% | |
| HTHT Links: Profile News Message Board | |
| Charts:- Daily , Weekly | |
| Add HTHT to Watchlist: View: Get Complete HTHT Trend Analysis ➞ | |
 | CANG Cango Inc. |
| Sector: Technology | |
| SubSector: Internet Information Providers | |
| MarketCap: 947.48 Millions | |
| Recent Price: 4.77 Smart Investing & Trading Score: 30 | |
| Day Percent Change: 2.18% Day Change: 0.1 | |
| Week Change: -2.9% Year-to-date Change: 6.6% | |
| CANG Links: Profile News Message Board | |
| Charts:- Daily , Weekly | |
| Add CANG to Watchlist: View: Get Complete CANG Trend Analysis ➞ | |
 | STG Sunlands Technology Group |
| Sector: Services & Goods | |
| SubSector: Education & Training Services | |
| MarketCap: 295.706 Millions | |
| Recent Price: 9.51 Smart Investing & Trading Score: 20 | |
| Day Percent Change: 2.18% Day Change: 0.21 | |
| Week Change: -2.57% Year-to-date Change: 74.2% | |
| STG Links: Profile News Message Board | |
| Charts:- Daily , Weekly | |
| Add STG to Watchlist: View: Get Complete STG Trend Analysis ➞ | |
 | IQ iQIYI, Inc. |
| Sector: Technology | |
| SubSector: Internet Information Providers | |
| MarketCap: 13591.5 Millions | |
| Recent Price: 2.65 Smart Investing & Trading Score: 100 | |
| Day Percent Change: 2.17% Day Change: 0.05 | |
| Week Change: 23.04% Year-to-date Change: 16.9% | |
| IQ Links: Profile News Message Board | |
| Charts:- Daily , Weekly | |
| Add IQ to Watchlist: View: Get Complete IQ Trend Analysis ➞ | |
 | UCAR U Power Limited |
| Sector: Services & Goods | |
| SubSector: Auto & Truck Dealerships | |
| MarketCap: 372 Millions | |
| Recent Price: 1.99 Smart Investing & Trading Score: 68 | |
| Day Percent Change: 2.06% Day Change: 0.04 | |
| Week Change: -0.5% Year-to-date Change: -70.1% | |
| UCAR Links: Profile News Message Board | |
| Charts:- Daily , Weekly | |
| Add UCAR to Watchlist: View: Get Complete UCAR Trend Analysis ➞ | |
 | API Agora, Inc. |
| Sector: Technology | |
| SubSector: Software Application | |
| MarketCap: 42787 Millions | |
| Recent Price: 3.45 Smart Investing & Trading Score: 10 | |
| Day Percent Change: 2.02% Day Change: 0.07 | |
| Week Change: -3.01% Year-to-date Change: -14.9% | |
| API Links: Profile News Message Board | |
| Charts:- Daily , Weekly | |
| Add API to Watchlist: View: Get Complete API Trend Analysis ➞ | |
 | AGMH AGM Group Holdings Inc. |
| Sector: Technology | |
| SubSector: Application Software | |
| MarketCap: 320.362 Millions | |
| Recent Price: 1.96 Smart Investing & Trading Score: 30 | |
| Day Percent Change: 1.98% Day Change: 0.04 | |
| Week Change: -10.43% Year-to-date Change: -97.3% | |
| AGMH Links: Profile News Message Board | |
| Charts:- Daily , Weekly | |
| Add AGMH to Watchlist: View: Get Complete AGMH Trend Analysis ➞ | |
 | RERE ATRenew Inc. |
| Sector: Services & Goods | |
| SubSector: Internet Retail | |
| MarketCap: 672 Millions | |
| Recent Price: 4.72 Smart Investing & Trading Score: 50 | |
| Day Percent Change: 1.97% Day Change: 0.09 | |
| Week Change: 9.67% Year-to-date Change: 61.5% | |
| RERE Links: Profile News Message Board | |
| Charts:- Daily , Weekly | |
| Add RERE to Watchlist: View: Get Complete RERE Trend Analysis ➞ | |
 | BIDU Baidu, Inc. |
| Sector: Technology | |
| SubSector: Internet Information Providers | |
| MarketCap: 33525.9 Millions | |
| Recent Price: 98.21 Smart Investing & Trading Score: 100 | |
| Day Percent Change: 1.88% Day Change: 1.81 | |
| Week Change: 3.05% Year-to-date Change: 8.4% | |
| BIDU Links: Profile News Message Board | |
| Charts:- Daily , Weekly | |
| Add BIDU to Watchlist: View: Get Complete BIDU Trend Analysis ➞ | |
 | RGC Regencell Bioscience Holdings Limited |
| Sector: Health Care | |
| SubSector: Drug Manufacturers - Specialty & Generic | |
| MarketCap: 284 Millions | |
| Recent Price: 14.05 Smart Investing & Trading Score: 20 | |
| Day Percent Change: 1.87% Day Change: 0.23 | |
| Week Change: -1.1% Year-to-date Change: 9,561.5% | |
| RGC Links: Profile News Message Board | |
| Charts:- Daily , Weekly | |
| Add RGC to Watchlist: View: Get Complete RGC Trend Analysis ➞ | |
 | VIPS Vipshop Holdings Limited |
| Sector: Services & Goods | |
| SubSector: Catalog & Mail Order Houses | |
| MarketCap: 10496.2 Millions | |
| Recent Price: 16.74 Smart Investing & Trading Score: 80 | |
| Day Percent Change: 1.8% Day Change: 0.3 | |
| Week Change: -2.14% Year-to-date Change: 30.7% | |
| VIPS Links: Profile News Message Board | |
| Charts:- Daily , Weekly | |
| Add VIPS to Watchlist: View: Get Complete VIPS Trend Analysis ➞ | |
 | SOHU Sohu.com Limited |
| Sector: Technology | |
| SubSector: Internet Information Providers | |
| MarketCap: 243.48 Millions | |
| Recent Price: 16.07 Smart Investing & Trading Score: 50 | |
| Day Percent Change: 1.77% Day Change: 0.27 | |
| Week Change: -0.19% Year-to-date Change: 17.8% | |
| SOHU Links: Profile News Message Board | |
| Charts:- Daily , Weekly | |
| Add SOHU to Watchlist: View: Get Complete SOHU Trend Analysis ➞ | |
 | MOMO Momo Inc. |
| Sector: Technology | |
| SubSector: Internet Software & Services | |
| MarketCap: 4796.71 Millions | |
| Recent Price: 8.30 Smart Investing & Trading Score: 60 | |
| Day Percent Change: 1.63% Day Change: 0.13 | |
| Week Change: 0.99% Year-to-date Change: 11.5% | |
| MOMO Links: Profile News Message Board | |
| Charts:- Daily , Weekly | |
| Add MOMO to Watchlist: View: Get Complete MOMO Trend Analysis ➞ | |
 | ATAT Atour Lifestyle Holdings Limited |
| Sector: Services & Goods | |
| SubSector: Lodging | |
| MarketCap: 2120 Millions | |
| Recent Price: 38.92 Smart Investing & Trading Score: 51 | |
| Day Percent Change: 1.56% Day Change: 0.53 | |
| Week Change: 0.03% Year-to-date Change: 30.0% | |
| ATAT Links: Profile News Message Board | |
| Charts:- Daily , Weekly | |
| Add ATAT to Watchlist: View: Get Complete ATAT Trend Analysis ➞ | |
| For tabular summary view of above stock list: Summary View ➞ 0 - 25 , 25 - 50 , 50 - 75 , 75 - 100 , 100 - 125 | ||
| Click To Change The Sort Order: By Market Cap or Company Size Performance: Year-to-date, Week and Day | |
| Select Chart Type: | ||
|
Best Stocks Today 12Stocks.com |
© 2025 12Stocks.com Terms & Conditions Privacy Contact Us
All Information Provided Only For Education And Not To Be Used For Investing or Trading. See Terms & Conditions


One More Thing ... Get Best Stocks Delivered Daily!
Never Ever Miss A Move With Our Top Ten Stocks Lists
Find Best Stocks In Any Market - Bull or Bear Market
Take A Peek At Our Top Ten Stocks Lists: Daily, Weekly, Year-to-Date & Top Trends
Find Best Stocks In Any Market - Bull or Bear Market
Take A Peek At Our Top Ten Stocks Lists: Daily, Weekly, Year-to-Date & Top Trends
China Stocks With Best Up Trends [0-bearish to 100-bullish]: Full Truck[100], Kanzhun [100], Baozun [100], iQIYI [100], Baidu [100], Smart Share[100], 17 Education[100], China Online[100], RLX [100], Melco Resorts[100], Daqo New[100]
Best China Stocks Year-to-Date:
Regencell Bioscience[9561.54%], I Mab[454.12%], So-Young [384.74%], QuantaSing [269.91%], Xunlei [264.32%], OneConnect Financial[205.35%], Niu [159.78%], Viomi [154.48%], Yatsen Holding[141.21%], Tencent Music[120.18%], XPeng [92.47%] Best China Stocks This Week:
Xunlei [43.56%], Burning Rock[41.87%], NIO [24.49%], iQIYI [23.04%], Zhihu [18.1%], XPeng [17.39%], Smart Share[14.53%], Cheetah Mobile[13.59%], MINISO [13.58%], QuantaSing [13.01%], Full Truck[12.26%] Best China Stocks Daily:
X Financial[15.73%], XPeng [11.68%], Full Truck[9.81%], Viomi [9.39%], NIO [9.27%], CNFinance [7.77%], Lixiang Education[7.32%], Kanzhun [6.61%], MINISO [6.38%], Burning Rock[6.02%], FinVolution [5.55%]