
 Login Sign Up


| |||||
 |  | ||||

| 12Stocks.com Market Intelligence |
Best China Stocks
|
On this page, you will find the most comprehensive analysis of Chinese stocks and ETFs - from latest trends to performances to charts ➞. First, here are the year-to-date (YTD) performances of the most requested China stocks at 12Stocks.com (click stock for review):
| Alibaba 41% | ||
| NetEase 34% | ||
| Weibo 32% | ||
| Vipshop 31% | ||
| Sohu.com 18% | ||
| Baidu 6% | ||
| JD.com -20% | ||
| New Oriental -26% | ||
| In a hurry? China Stocks Lists: Performance Trends Table, Stock Charts
Sort China stocks: Daily, Weekly, Year-to-Date, Market Cap & Trends. Filter China stocks list by sector: Show all, Tech, Finance, Energy, Staples, Retail, Industrial, Materials, Utilities and HealthCare Filter China stocks list by size: All China Large Medium Small and MicroCap |
| September 3, 2025 - 12Stocks.com China Stocks Performances & Trends Daily | |||||||||
|
|  The overall Smart Investing & Trading Score is 100 (0-bearish to 100-bullish) which puts China index in short term bullish trend. The Smart Investing & Trading Score from previous trading session is 90 and hence an improvement of trend.
| ||||||||
Here are the Smart Investing & Trading Scores of the most requested China stocks at 12Stocks.com (click stock name for detailed review):
|


| 12Stocks.com: Top Performing China Index Stocks | ||||||||||||||||||||||||||||||||||||||||||||||||
 The top performing China Index stocks year to date are
Now, more recently, over last week, the top performing China Index stocks on the move are


|
||||||||||||||||||||||||||||||||||||||||||||||||
| 12Stocks.com: Investing in China Index with Stocks | |
|
The following table helps investors and traders sort through current performance and trends (as measured by Smart Investing & Trading Score) of various
stocks in the China Index. Quick View: Move mouse or cursor over stock symbol (ticker) to view short-term technical chart and over stock name to view long term chart. Click on  to add stock symbol to your watchlist and to add stock symbol to your watchlist and  to view watchlist. Click on any ticker or stock name for detailed market intelligence report for that stock. to view watchlist. Click on any ticker or stock name for detailed market intelligence report for that stock. |
12Stocks.com Performance of Stocks in China Index
| Ticker | Stock Name | Watchlist | Category | Recent Price | Smart Investing & Trading Score | Change % | YTD Change% |
| ATHM | Autohome |   | Technology | 28.88 | 80 | 0.99% | 10.48% |
| BILI | Bilibili | | Technology | 23.26 | 20 | -6.11% | 31.20% |
| MLCO | Melco Resorts | | Services & Goods | 9.94 | 100 | -0.45% | 54.06% |
| YMM | Full Truck | | Technology | 13.05 | 100 | 9.81% | 11.74% |
| BZ | Kanzhun | | Industrials | 23.63 | 100 | 6.61% | 70.58% |
| MOMO | Momo | | Technology | 8.30 | 60 | 1.63% | 11.50% |
| ZLAB | Zai Lab | | Health Care | 33.10 | 50 | 1.46% | 29.78% |
| HUYA | HUYA | | Services & Goods | 3.58 | 90 | 4.08% | 85.69% |
| RLX | RLX | | Consumer Staples | 2.54 | 100 | 0.00% | 3.70% |
| SDA | SunCar | | Services & Goods | 2.60 | 90 | -0.87% | -76.27% |
| NIO | NIO | | Consumer Staples | 6.38 | 100 | 9.27% | 27.06% |
| DOYU | DouYu | | Technology | 7.72 | 40 | -1.51% | -27.48% |
| HCM | Hutchison China | | Health Care | 15.01 | 60 | 1.45% | 11.80% |
| ATAT | Atour Lifestyle | | Services & Goods | 38.92 | 51 | 1.56% | 30.01% |
| DAO | Youdao | | Technology | 8.97 | 10 | 0.33% | 24.05% |
| VNET | 21Vianet | | Technology | 8.66 | 40 | -8.02% | 54.85% |
| LX | LexinFintech | | Financials | 6.32 | 10 | 2.66% | 14.89% |
| BZUN | Baozun | | Services & Goods | 3.39 | 100 | 2.51% | 5.15% |
| NOAH | Noah | | Financials | 12.45 | 70 | 0.59% | 11.64% |
| MSC | Studio City | | Services & Goods | 4.82 | 80 | -4.75% | -14.87% |
| HSAI | Hesai | | Services & Goods | 25.77 | 61 | -11.00% | 66.86% |
| HKD | AMTD Digital | | Technology | 1.62 | 26 | 0.00% | -46.28% |
| GHG | GreenTree Hospitality | | Services & Goods | 2.10 | 60 | 0.00% | -16.80% |
| TSL | Trina Solar | | Technology | 13.20 | 40 | -1.34% | -30.55% |
| TUYA | Tuya | | Technology | 2.66 | 60 | 3.02% | 35.17% |
| For chart view version of above stock list: Chart View ➞ 0 - 25 , 25 - 50 | ||
 | Click To Change The Sort Order: By Market Cap or Company Size Performance: Year-to-date, Week and Day |  |
|
Get the most comprehensive stock market coverage daily at 12Stocks.com ➞ Best Stocks Today ➞ Best Stocks Weekly ➞ Best Stocks Year-to-Date ➞ Best Stocks Trends ➞  Best Stocks Today 12Stocks.com Best Nasdaq Stocks ➞ Best S&P 500 Stocks ➞ Best Tech Stocks ➞ Best Biotech Stocks ➞ |
| Detailed Overview of China Stocks |
| China Technical Overview, Leaders & Laggards, Top China ETF Funds & Detailed China Stocks List, Charts, Trends & More |
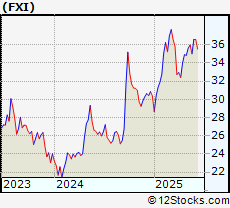
| China: Technical Analysis, Trends & YTD Performance | |
 FXI Weekly Chart |
|
| Long Term Trend: Very Good | |
| Medium Term Trend: Very Good | |
 FXI Daily Chart |
|
| Short Term Trend: Very Good | |
| Overall Trend Score: 100 | |
| YTD Performance: 23.11% | |
| **Trend Scores & Views Are Only For Educational Purposes And Not For Investing | |
| 12Stocks.com: Investing in China Index using Exchange Traded Funds | |
|
The following table shows list of key exchange traded funds (ETF) that
help investors play China stock market. For detailed view, check out our ETF Funds section of our website. Quick View: Move mouse or cursor over ETF symbol (ticker) to view short-term technical chart and over ETF name to view long term chart. Click on ticker or stock name for detailed view. Click on to add stock symbol to your watchlist and to view watchlist. |
12Stocks.com List of ETFs that track China Index
| Ticker | ETF Name | Watchlist | Recent Price | Smart Investing & Trading Score | Change % | Week % | Year-to-date % |
| FXI | China Large-Cap | | 39.26 | 100 | 0.9 | 0.9 | 23.11% |
| EWH | Hong Kong | | 21.16 | 60 | 1.46 | 1.37 | 33% |
| HAO | China Small Cap | | 1.17 | 30 | 3.42 | 1.68 | -51.6% |
| YINN | China Bull 3X | | 46.80 | 90 | 6.42 | 6.3 | 55.38% |
| YANG | China Bear 3X | | 25.72 | 20 | 0.49 | -0.15 | -60.96% |
| XPP | China 50 | | 27.62 | 90 | 4.34 | 4.3 | 42.61% |
| MCHI | China | | 61.31 | 100 | 0.13 | 1.18 | 29.31% |
| GXC | China | | 98.55 | 100 | 0.22 | 1.96 | 26.85% |
| CBON | ChinaAMC China Bond | | 22.51 | 90 | 0.02 | -0.22 | 1.79% |
| 12Stocks.com: Charts, Trends, Fundamental Data and Performances of China Stocks | |
|
We now take in-depth look at all China stocks including charts, multi-period performances and overall trends (as measured by Smart Investing & Trading Score). One can sort China stocks (click link to choose) by Daily, Weekly and by Year-to-Date performances. Also, one can sort by size of the company or by market capitalization. |
| Select Your Default Chart Type: | |||||
| |||||
| Click on stock symbol or name for detailed view. Click on to add stock symbol to your watchlist and to view watchlist. Quick View: Move mouse or cursor over "Daily" to quickly view daily technical stock chart and over "Weekly" to view weekly technical stock chart. | |||||

 | ATHM Autohome Inc. |
| Sector: Technology | |
| SubSector: Internet Information Providers | |
| MarketCap: 7984.2 Millions | |
| Recent Price: 28.88 Smart Investing & Trading Score: 80 | |
| Day Percent Change: 0.99% Day Change: 0.28 | |
| Week Change: -0.62% Year-to-date Change: 10.5% | |
| ATHM Links: Profile News Message Board | |
| Charts:- Daily , Weekly | |
| Add ATHM to Watchlist: View: Get Complete ATHM Trend Analysis ➞ | |
 | BILI Bilibili Inc. |
| Sector: Technology | |
| SubSector: Internet Information Providers | |
| MarketCap: 7043.1 Millions | |
| Recent Price: 23.26 Smart Investing & Trading Score: 20 | |
| Day Percent Change: -6.11% Day Change: -1.54 | |
| Week Change: -0.25% Year-to-date Change: 31.2% | |
| BILI Links: Profile News Message Board | |
| Charts:- Daily , Weekly | |
| Add BILI to Watchlist: View: Get Complete BILI Trend Analysis ➞ | |
 | MLCO Melco Resorts & Entertainment Limited |
| Sector: Services & Goods | |
| SubSector: Resorts & Casinos | |
| MarketCap: 7031.14 Millions | |
| Recent Price: 9.94 Smart Investing & Trading Score: 100 | |
| Day Percent Change: -0.45% Day Change: -0.04 | |
| Week Change: 4.69% Year-to-date Change: 54.1% | |
| MLCO Links: Profile News Message Board | |
| Charts:- Daily , Weekly | |
| Add MLCO to Watchlist: View: Get Complete MLCO Trend Analysis ➞ | |
 | YMM Full Truck Alliance Co. Ltd. |
| Sector: Technology | |
| SubSector: Software - Application | |
| MarketCap: 6960 Millions | |
| Recent Price: 13.05 Smart Investing & Trading Score: 100 | |
| Day Percent Change: 9.81% Day Change: 1.08 | |
| Week Change: 12.26% Year-to-date Change: 11.7% | |
| YMM Links: Profile News Message Board | |
| Charts:- Daily , Weekly | |
| Add YMM to Watchlist: View: Get Complete YMM Trend Analysis ➞ | |
 | BZ Kanzhun Limited |
| Sector: Industrials | |
| SubSector: Staffing & Employment Services | |
| MarketCap: 6680 Millions | |
| Recent Price: 23.63 Smart Investing & Trading Score: 100 | |
| Day Percent Change: 6.61% Day Change: 1.46 | |
| Week Change: 10.41% Year-to-date Change: 70.6% | |
| BZ Links: Profile News Message Board | |
| Charts:- Daily , Weekly | |
| Add BZ to Watchlist: View: Get Complete BZ Trend Analysis ➞ | |
 | MOMO Momo Inc. |
| Sector: Technology | |
| SubSector: Internet Software & Services | |
| MarketCap: 4796.71 Millions | |
| Recent Price: 8.30 Smart Investing & Trading Score: 60 | |
| Day Percent Change: 1.63% Day Change: 0.13 | |
| Week Change: 0.99% Year-to-date Change: 11.5% | |
| MOMO Links: Profile News Message Board | |
| Charts:- Daily , Weekly | |
| Add MOMO to Watchlist: View: Get Complete MOMO Trend Analysis ➞ | |
 | ZLAB Zai Lab Limited |
| Sector: Health Care | |
| SubSector: Biotechnology | |
| MarketCap: 3970.35 Millions | |
| Recent Price: 33.10 Smart Investing & Trading Score: 50 | |
| Day Percent Change: 1.46% Day Change: 0.49 | |
| Week Change: -2.69% Year-to-date Change: 29.8% | |
| ZLAB Links: Profile News Message Board | |
| Charts:- Daily , Weekly | |
| Add ZLAB to Watchlist: View: Get Complete ZLAB Trend Analysis ➞ | |
 | HUYA HUYA Inc. |
| Sector: Services & Goods | |
| SubSector: Entertainment - Diversified | |
| MarketCap: 3358.17 Millions | |
| Recent Price: 3.58 Smart Investing & Trading Score: 90 | |
| Day Percent Change: 4.08% Day Change: 0.13 | |
| Week Change: 0.61% Year-to-date Change: 85.7% | |
| HUYA Links: Profile News Message Board | |
| Charts:- Daily , Weekly | |
| Add HUYA to Watchlist: View: Get Complete HUYA Trend Analysis ➞ | |
 | RLX RLX Technology Inc. |
| Sector: Consumer Staples | |
| SubSector: Tobacco | |
| MarketCap: 2800 Millions | |
| Recent Price: 2.54 Smart Investing & Trading Score: 100 | |
| Day Percent Change: 0% Day Change: 0 | |
| Week Change: 4.67% Year-to-date Change: 3.7% | |
| RLX Links: Profile News Message Board | |
| Charts:- Daily , Weekly | |
| Add RLX to Watchlist: View: Get Complete RLX Trend Analysis ➞ | |
 | SDA SunCar Technology Group Inc. |
| Sector: Services & Goods | |
| SubSector: Auto & Truck Dealerships | |
| MarketCap: 2680 Millions | |
| Recent Price: 2.60 Smart Investing & Trading Score: 90 | |
| Day Percent Change: -0.87% Day Change: -0.02 | |
| Week Change: -2.97% Year-to-date Change: -76.3% | |
| SDA Links: Profile News Message Board | |
| Charts:- Daily , Weekly | |
| Add SDA to Watchlist: View: Get Complete SDA Trend Analysis ➞ | |
 | NIO NIO Limited |
| Sector: Consumer Staples | |
| SubSector: Auto Manufacturers - Major | |
| MarketCap: 2679.71 Millions | |
| Recent Price: 6.38 Smart Investing & Trading Score: 100 | |
| Day Percent Change: 9.27% Day Change: 0.47 | |
| Week Change: 24.49% Year-to-date Change: 27.1% | |
| NIO Links: Profile News Message Board | |
| Charts:- Daily , Weekly | |
| Add NIO to Watchlist: View: Get Complete NIO Trend Analysis ➞ | |
 | DOYU DouYu International Holdings Limited |
| Sector: Technology | |
| SubSector: Internet Information Providers | |
| MarketCap: 2483 Millions | |
| Recent Price: 7.72 Smart Investing & Trading Score: 40 | |
| Day Percent Change: -1.51% Day Change: -0.13 | |
| Week Change: 11.68% Year-to-date Change: -27.5% | |
| DOYU Links: Profile News Message Board | |
| Charts:- Daily , Weekly | |
| Add DOYU to Watchlist: View: Get Complete DOYU Trend Analysis ➞ | |
 | HCM Hutchison China MediTech Limited |
| Sector: Health Care | |
| SubSector: Drug Manufacturers - Major | |
| MarketCap: 2324.43 Millions | |
| Recent Price: 15.01 Smart Investing & Trading Score: 60 | |
| Day Percent Change: 1.45% Day Change: 0.23 | |
| Week Change: 1.51% Year-to-date Change: 11.8% | |
| HCM Links: Profile News Message Board | |
| Charts:- Daily , Weekly | |
| Add HCM to Watchlist: View: Get Complete HCM Trend Analysis ➞ | |
 | ATAT Atour Lifestyle Holdings Limited |
| Sector: Services & Goods | |
| SubSector: Lodging | |
| MarketCap: 2120 Millions | |
| Recent Price: 38.92 Smart Investing & Trading Score: 51 | |
| Day Percent Change: 1.56% Day Change: 0.53 | |
| Week Change: 0.03% Year-to-date Change: 30.0% | |
| ATAT Links: Profile News Message Board | |
| Charts:- Daily , Weekly | |
| Add ATAT to Watchlist: View: Get Complete ATAT Trend Analysis ➞ | |
 | DAO Youdao, Inc. |
| Sector: Technology | |
| SubSector: Internet Information Providers | |
| MarketCap: 2073.2 Millions | |
| Recent Price: 8.97 Smart Investing & Trading Score: 10 | |
| Day Percent Change: 0.33% Day Change: 0.03 | |
| Week Change: -5.94% Year-to-date Change: 24.1% | |
| DAO Links: Profile News Message Board | |
| Charts:- Daily , Weekly | |
| Add DAO to Watchlist: View: Get Complete DAO Trend Analysis ➞ | |
 | VNET 21Vianet Group, Inc. |
| Sector: Technology | |
| SubSector: Information Technology Services | |
| MarketCap: 1846.98 Millions | |
| Recent Price: 8.66 Smart Investing & Trading Score: 40 | |
| Day Percent Change: -8.02% Day Change: -0.64 | |
| Week Change: -7.67% Year-to-date Change: 54.9% | |
| VNET Links: Profile News Message Board | |
| Charts:- Daily , Weekly | |
| Add VNET to Watchlist: View: Get Complete VNET Trend Analysis ➞ | |
 | LX LexinFintech Holdings Ltd. |
| Sector: Financials | |
| SubSector: Credit Services | |
| MarketCap: 1674.18 Millions | |
| Recent Price: 6.32 Smart Investing & Trading Score: 10 | |
| Day Percent Change: 2.66% Day Change: 0.17 | |
| Week Change: -1.35% Year-to-date Change: 14.9% | |
| LX Links: Profile News Message Board | |
| Charts:- Daily , Weekly | |
| Add LX to Watchlist: View: Get Complete LX Trend Analysis ➞ | |
 | BZUN Baozun Inc. |
| Sector: Services & Goods | |
| SubSector: Catalog & Mail Order Houses | |
| MarketCap: 1668.92 Millions | |
| Recent Price: 3.39 Smart Investing & Trading Score: 100 | |
| Day Percent Change: 2.51% Day Change: 0.07 | |
| Week Change: 4% Year-to-date Change: 5.2% | |
| BZUN Links: Profile News Message Board | |
| Charts:- Daily , Weekly | |
| Add BZUN to Watchlist: View: Get Complete BZUN Trend Analysis ➞ | |
 | NOAH Noah Holdings Limited |
| Sector: Financials | |
| SubSector: Asset Management | |
| MarketCap: 1495.33 Millions | |
| Recent Price: 12.45 Smart Investing & Trading Score: 70 | |
| Day Percent Change: 0.59% Day Change: 0.07 | |
| Week Change: -0.67% Year-to-date Change: 11.6% | |
| NOAH Links: Profile News Message Board | |
| Charts:- Daily , Weekly | |
| Add NOAH to Watchlist: View: Get Complete NOAH Trend Analysis ➞ | |
 | MSC Studio City International Holdings Limited |
| Sector: Services & Goods | |
| SubSector: Resorts & Casinos | |
| MarketCap: 1420.54 Millions | |
| Recent Price: 4.82 Smart Investing & Trading Score: 80 | |
| Day Percent Change: -4.75% Day Change: -0.24 | |
| Week Change: 3.44% Year-to-date Change: -14.9% | |
| MSC Links: Profile News Message Board | |
| Charts:- Daily , Weekly | |
| Add MSC to Watchlist: View: Get Complete MSC Trend Analysis ➞ | |
 | HSAI Hesai Group |
| Sector: Services & Goods | |
| SubSector: Auto Parts | |
| MarketCap: 1330 Millions | |
| Recent Price: 25.77 Smart Investing & Trading Score: 61 | |
| Day Percent Change: -11% Day Change: -2.85 | |
| Week Change: -1.11% Year-to-date Change: 66.9% | |
| HSAI Links: Profile News Message Board | |
| Charts:- Daily , Weekly | |
| Add HSAI to Watchlist: View: Get Complete HSAI Trend Analysis ➞ | |
 | HKD AMTD Digital Inc. |
| Sector: Technology | |
| SubSector: Software - Application | |
| MarketCap: 1200 Millions | |
| Recent Price: 1.62 Smart Investing & Trading Score: 26 | |
| Day Percent Change: 0% Day Change: 0 | |
| Week Change: -3.05% Year-to-date Change: -46.3% | |
| HKD Links: Profile News Message Board | |
| Charts:- Daily , Weekly | |
| Add HKD to Watchlist: View: Get Complete HKD Trend Analysis ➞ | |
 | GHG GreenTree Hospitality Group Ltd. |
| Sector: Services & Goods | |
| SubSector: Lodging | |
| MarketCap: 1195.36 Millions | |
| Recent Price: 2.10 Smart Investing & Trading Score: 60 | |
| Day Percent Change: 0% Day Change: 0 | |
| Week Change: -4.05% Year-to-date Change: -16.8% | |
| GHG Links: Profile News Message Board | |
| Charts:- Daily , Weekly | |
| Add GHG to Watchlist: View: Get Complete GHG Trend Analysis ➞ | |
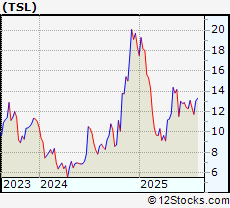 | TSL Trina Solar Limited |
| Sector: Technology | |
| SubSector: Semiconductor - Specialized | |
| MarketCap: 1066.99 Millions | |
| Recent Price: 13.20 Smart Investing & Trading Score: 40 | |
| Day Percent Change: -1.34% Day Change: -0.17 | |
| Week Change: -5.78% Year-to-date Change: -30.6% | |
| TSL Links: Profile News Message Board | |
| Charts:- Daily , Weekly | |
| Add TSL to Watchlist: View: Get Complete TSL Trend Analysis ➞ | |
 | TUYA Tuya Inc. |
| Sector: Technology | |
| SubSector: Software - Infrastructure | |
| MarketCap: 1050 Millions | |
| Recent Price: 2.66 Smart Investing & Trading Score: 60 | |
| Day Percent Change: 3.02% Day Change: 0.07 | |
| Week Change: -1.24% Year-to-date Change: 35.2% | |
| TUYA Links: Profile News Message Board | |
| Charts:- Daily , Weekly | |
| Add TUYA to Watchlist: View: Get Complete TUYA Trend Analysis ➞ | |
| For tabular summary view of above stock list: Summary View ➞ 0 - 25 , 25 - 50 | ||
| Click To Change The Sort Order: By Market Cap or Company Size Performance: Year-to-date, Week and Day | |
| Select Chart Type: | ||
|
Best Stocks Today 12Stocks.com |
© 2025 12Stocks.com Terms & Conditions Privacy Contact Us
All Information Provided Only For Education And Not To Be Used For Investing or Trading. See Terms & Conditions


One More Thing ... Get Best Stocks Delivered Daily!
Never Ever Miss A Move With Our Top Ten Stocks Lists
Find Best Stocks In Any Market - Bull or Bear Market
Take A Peek At Our Top Ten Stocks Lists: Daily, Weekly, Year-to-Date & Top Trends
Find Best Stocks In Any Market - Bull or Bear Market
Take A Peek At Our Top Ten Stocks Lists: Daily, Weekly, Year-to-Date & Top Trends
China Stocks With Best Up Trends [0-bearish to 100-bullish]: Full Truck[100], NIO [100], Kanzhun [100], Alibaba [100], Baozun [100], Huazhu [100], iQIYI [100], Sohu.com [100], Smart Share[100], Baidu [100], China Online[100]
Best China Stocks Year-to-Date:
Regencell Bioscience[9561.54%], I Mab[454.12%], So-Young [384.74%], QuantaSing [269.91%], Xunlei [264.32%], OneConnect Financial[205.35%], Niu [159.78%], Viomi [154.48%], Yatsen Holding[141.21%], Tencent Music[120.18%], XPeng [92.47%] Best China Stocks This Week:
Xunlei [43.56%], Burning Rock[41.87%], NIO [24.49%], iQIYI [23.04%], Zhihu [18.1%], XPeng [17.39%], Smart Share[14.53%], Cheetah Mobile[13.59%], MINISO [13.58%], QuantaSing [13.01%], Full Truck[12.26%] Best China Stocks Daily:
X Financial[15.73%], XPeng [11.68%], Full Truck[9.81%], Viomi [9.39%], NIO [9.27%], CNFinance [7.77%], Lixiang Education[7.32%], Kanzhun [6.61%], MINISO [6.38%], Burning Rock[6.02%], FinVolution [5.55%]