
 Login Sign Up


| |||||
 |  | ||||

| 12Stocks.com Market Intelligence |
Best China Stocks
|
On this page, you will find the most comprehensive analysis of Chinese stocks and ETFs - from latest trends to performances to charts ➞. First, here are the year-to-date (YTD) performances of the most requested China stocks at 12Stocks.com (click stock for review):
| Alibaba 34% | ||
| Weibo 32% | ||
| NetEase 32% | ||
| Vipshop 31% | ||
| Sohu.com 18% | ||
| Baidu 8% | ||
| JD.com -22% | ||
| New Oriental -26% | ||
| In a hurry? China Stocks Lists: Performance Trends Table, Stock Charts
Sort China stocks: Daily, Weekly, Year-to-Date, Market Cap & Trends. Filter China stocks list by sector: Show all, Tech, Finance, Energy, Staples, Retail, Industrial, Materials, Utilities and HealthCare Filter China stocks list by size: All China Large Medium Small and MicroCap |
| September 5, 2025 - 12Stocks.com China Stocks Performances & Trends Daily | |||||||||
|
|  The overall Smart Investing & Trading Score is 40 (0-bearish to 100-bullish) which puts China index in short term bearish to neutral trend. The Smart Investing & Trading Score from previous trading session is 90 and hence a deterioration of trend.
| ||||||||
Here are the Smart Investing & Trading Scores of the most requested China stocks at 12Stocks.com (click stock name for detailed review):
|


| 12Stocks.com: Top Performing China Index Stocks | ||||||||||||||||||||||||||||||||||||||||||||||||
 The top performing China Index stocks year to date are
Now, more recently, over last week, the top performing China Index stocks on the move are


|
||||||||||||||||||||||||||||||||||||||||||||||||
| 12Stocks.com: Investing in China Index with Stocks | |
|
The following table helps investors and traders sort through current performance and trends (as measured by Smart Investing & Trading Score) of various
stocks in the China Index. Quick View: Move mouse or cursor over stock symbol (ticker) to view short-term technical chart and over stock name to view long term chart. Click on  to add stock symbol to your watchlist and to add stock symbol to your watchlist and  to view watchlist. Click on any ticker or stock name for detailed market intelligence report for that stock. to view watchlist. Click on any ticker or stock name for detailed market intelligence report for that stock. |
12Stocks.com Performance of Stocks in China Index
| Ticker | Stock Name | Watchlist | Category | Recent Price | Smart Investing & Trading Score | Change % | Weekly Change% |
| APM | Aptorum |   | Health Care | 1.97 | 60 | 234.65% | 191.10% |
| CLPS | CLPS In | | Technology | 1.06 | 60 | 4.90% | 12.71% |
| FTFT | Future FinTech | | Consumer Staples | 2.22 | 40 | 9.39% | 11.86% |
| DSWL | Deswell Industries | | Consumer Staples | 3.80 | 100 | -0.86% | 9.97% |
| DOGZ | Dogness () | | Consumer Staples | 10.66 | 40 | 0.46% | 9.42% |
| PT | Pintec | | Technology | 0.95 | 40 | 6.40% | 7.53% |
| IMTE | Integrated Media | | Technology | 0.88 | 90 | 7.36% | 7.37% |
| CNET | ChinaNet Online | | Services & Goods | 1.59 | 80 | 0.00% | 6.15% |
| FAMI | Farmmi | | Consumer Staples | 1.69 | 30 | 1.75% | 6.01% |
| LITB | LightInTheBox Holding | | Services & Goods | 1.20 | 100 | 3.32% | 5.51% |
| GURE | Gulf Resources | | Materials | 0.72 | 80 | -3.18% | 5.14% |
| HIHO | Highway | | Industrials | 1.71 | 40 | -2.94% | 5.10% |
| CHNR | China Natural | | Materials | 3.76 | 100 | -0.37% | 3.56% |
| SEED | Origin Agritech | | Consumer Staples | 1.17 | 20 | 0.92% | 2.79% |
| KXIN | Kaixin Auto | | Industrials | 0.64 | 20 | -2.69% | 2.71% |
| TANH | Tantech | | Materials | 2.02 | 90 | 2.57% | 2.60% |
| CLWT | Euro Tech | | Industrials | 1.28 | 100 | -1.61% | 2.52% |
| WAFU | Wah Fu | | Services & Goods | 1.46 | 100 | 0.35% | 2.48% |
| CPHI | China Pharma | | Health Care | 1.39 | 60 | 3.50% | 1.37% |
| DTSS | Datasea | | Industrials | 2.06 | 50 | -2.76% | 0.98% |
| CBAT | CBAK Energy | | Health Care | 0.93 | 20 | 1.12% | 0.23% |
| CWS | AdvisorShares Focused | | Utilities | 69.00 | 30 | -0.29% | 0.02% |
| CALI | China Auto | | Services & Goods | 50.61 | 40 | -0.02% | 0.01% |
| UTSI | UTStarcom | | Technology | 2.63 | 40 | 0.00% | 0.00% |
| CPSL | China Precision | | Materials | 26.71 | 80 | 0.02% | -0.16% |
| For chart view version of above stock list: Chart View ➞ 0 - 25 , 25 - 50 | ||
 | Click To Change The Sort Order: By Market Cap or Company Size Performance: Year-to-date, Week and Day |  |
|
Get the most comprehensive stock market coverage daily at 12Stocks.com ➞ Best Stocks Today ➞ Best Stocks Weekly ➞ Best Stocks Year-to-Date ➞ Best Stocks Trends ➞  Best Stocks Today 12Stocks.com Best Nasdaq Stocks ➞ Best S&P 500 Stocks ➞ Best Tech Stocks ➞ Best Biotech Stocks ➞ |
| Detailed Overview of China Stocks |
| China Technical Overview, Leaders & Laggards, Top China ETF Funds & Detailed China Stocks List, Charts, Trends & More |
| China: Technical Analysis, Trends & YTD Performance | |
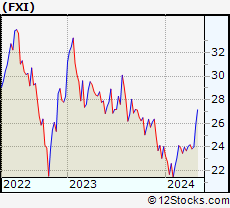
 FXI Weekly Chart |
|
| Long Term Trend: Very Good | |
| Medium Term Trend: Deteriorating | |
 FXI Daily Chart |
|
| Short Term Trend: Not Good | |
| Overall Trend Score: 40 | |
| YTD Performance: 20.19% | |
| **Trend Scores & Views Are Only For Educational Purposes And Not For Investing | |
| 12Stocks.com: Investing in China Index using Exchange Traded Funds | |
|
The following table shows list of key exchange traded funds (ETF) that
help investors play China stock market. For detailed view, check out our ETF Funds section of our website. Quick View: Move mouse or cursor over ETF symbol (ticker) to view short-term technical chart and over ETF name to view long term chart. Click on ticker or stock name for detailed view. Click on to add stock symbol to your watchlist and to view watchlist. |
12Stocks.com List of ETFs that track China Index
| Ticker | ETF Name | Watchlist | Recent Price | Smart Investing & Trading Score | Change % | Week % | Year-to-date % |
| FXI | China Large-Cap | | 38.33 | 40 | -1.49 | -1.49 | 20.19% |
| EWH | Hong Kong | | 21.16 | 30 | 1.46 | 1.37 | 33% |
| HAO | China Small Cap | | 1.17 | 20 | 3.42 | 1.68 | -51.6% |
| YINN | China Bull 3X | | 46.80 | 30 | 6.42 | 6.3 | 55.38% |
| YANG | China Bear 3X | | 25.72 | 60 | 0.49 | -0.15 | -60.96% |
| XPP | China 50 | | 27.62 | 30 | 4.34 | 4.3 | 42.61% |
| MCHI | China | | 61.31 | 60 | 0.13 | 1.18 | 29.31% |
| GXC | China | | 98.55 | 60 | 0.22 | 1.96 | 26.85% |
| CBON | ChinaAMC China Bond | | 22.51 | 70 | 0.02 | -0.22 | 1.79% |
| 12Stocks.com: Charts, Trends, Fundamental Data and Performances of China Stocks | |
|
We now take in-depth look at all China stocks including charts, multi-period performances and overall trends (as measured by Smart Investing & Trading Score). One can sort China stocks (click link to choose) by Daily, Weekly and by Year-to-Date performances. Also, one can sort by size of the company or by market capitalization. |
| Select Your Default Chart Type: | |||||
| |||||
| Click on stock symbol or name for detailed view. Click on to add stock symbol to your watchlist and to view watchlist. Quick View: Move mouse or cursor over "Daily" to quickly view daily technical stock chart and over "Weekly" to view weekly technical stock chart. | |||||

 | APM Aptorum Group Limited |
| Sector: Health Care | |
| SubSector: Biotechnology | |
| MarketCap: 88.7785 Millions | |
| Recent Price: 1.97 Smart Investing & Trading Score: 60 | |
| Day Percent Change: 234.65% Day Change: 2.98 | |
| Week Change: 191.1% Year-to-date Change: 51.8% | |
| APM Links: Profile News Message Board | |
| Charts:- Daily , Weekly | |
| Add APM to Watchlist: View: Get Complete APM Trend Analysis ➞ | |
 | CLPS CLPS Incorporation |
| Sector: Technology | |
| SubSector: Information Technology Services | |
| MarketCap: 23.7468 Millions | |
| Recent Price: 1.06 Smart Investing & Trading Score: 60 | |
| Day Percent Change: 4.9% Day Change: 0.05 | |
| Week Change: 12.71% Year-to-date Change: -12.8% | |
| CLPS Links: Profile News Message Board | |
| Charts:- Daily , Weekly | |
| Add CLPS to Watchlist: View: Get Complete CLPS Trend Analysis ➞ | |
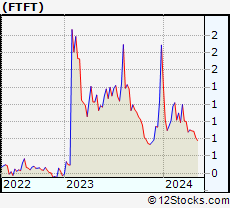 | FTFT Future FinTech Group Inc. |
| Sector: Consumer Staples | |
| SubSector: Beverages - Soft Drinks | |
| MarketCap: 29.472 Millions | |
| Recent Price: 2.22 Smart Investing & Trading Score: 40 | |
| Day Percent Change: 9.39% Day Change: 0.17 | |
| Week Change: 11.86% Year-to-date Change: -36.1% | |
| FTFT Links: Profile News Message Board | |
| Charts:- Daily , Weekly | |
| Add FTFT to Watchlist: View: Get Complete FTFT Trend Analysis ➞ | |
 | DSWL Deswell Industries, Inc. |
| Sector: Consumer Staples | |
| SubSector: Rubber & Plastics | |
| MarketCap: 38.357 Millions | |
| Recent Price: 3.80 Smart Investing & Trading Score: 100 | |
| Day Percent Change: -0.86% Day Change: -0.03 | |
| Week Change: 9.97% Year-to-date Change: 50.6% | |
| DSWL Links: Profile News Message Board | |
| Charts:- Daily , Weekly | |
| Add DSWL to Watchlist: View: Get Complete DSWL Trend Analysis ➞ | |
 | DOGZ Dogness (International) Corporation |
| Sector: Consumer Staples | |
| SubSector: Personal Products | |
| MarketCap: 36.4985 Millions | |
| Recent Price: 10.66 Smart Investing & Trading Score: 40 | |
| Day Percent Change: 0.46% Day Change: 0.07 | |
| Week Change: 9.42% Year-to-date Change: -66.0% | |
| DOGZ Links: Profile News Message Board | |
| Charts:- Daily , Weekly | |
| Add DOGZ to Watchlist: View: Get Complete DOGZ Trend Analysis ➞ | |
 | PT Pintec Technology Holdings Limited |
| Sector: Technology | |
| SubSector: Wireless Communications | |
| MarketCap: 87.7827 Millions | |
| Recent Price: 0.95 Smart Investing & Trading Score: 40 | |
| Day Percent Change: 6.4% Day Change: 0.06 | |
| Week Change: 7.53% Year-to-date Change: 10.2% | |
| PT Links: Profile News Message Board | |
| Charts:- Daily , Weekly | |
| Add PT to Watchlist: View: Get Complete PT Trend Analysis ➞ | |
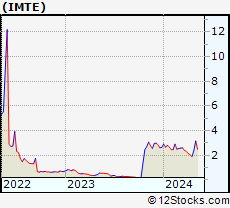 | IMTE Integrated Media Technology Limited |
| Sector: Technology | |
| SubSector: CATV Systems | |
| MarketCap: 9 Millions | |
| Recent Price: 0.88 Smart Investing & Trading Score: 90 | |
| Day Percent Change: 7.36% Day Change: 0.07 | |
| Week Change: 7.37% Year-to-date Change: -18.4% | |
| IMTE Links: Profile News Message Board | |
| Charts:- Daily , Weekly | |
| Add IMTE to Watchlist: View: Get Complete IMTE Trend Analysis ➞ | |
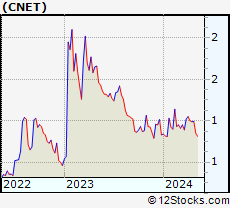 | CNET ChinaNet Online Holdings, Inc. |
| Sector: Services & Goods | |
| SubSector: Advertising Agencies | |
| MarketCap: 14.6 Millions | |
| Recent Price: 1.59 Smart Investing & Trading Score: 80 | |
| Day Percent Change: 0% Day Change: 0 | |
| Week Change: 6.15% Year-to-date Change: -23.3% | |
| CNET Links: Profile News Message Board | |
| Charts:- Daily , Weekly | |
| Add CNET to Watchlist: View: Get Complete CNET Trend Analysis ➞ | |
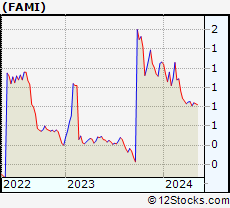 | FAMI Farmmi, Inc. |
| Sector: Consumer Staples | |
| SubSector: Processed & Packaged Goods | |
| MarketCap: 5.62748 Millions | |
| Recent Price: 1.69 Smart Investing & Trading Score: 30 | |
| Day Percent Change: 1.75% Day Change: 0.03 | |
| Week Change: 6.01% Year-to-date Change: -51.7% | |
| FAMI Links: Profile News Message Board | |
| Charts:- Daily , Weekly | |
| Add FAMI to Watchlist: View: Get Complete FAMI Trend Analysis ➞ | |
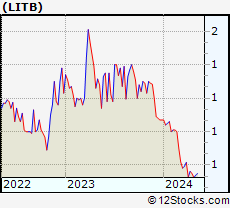 | LITB LightInTheBox Holding Co., Ltd. |
| Sector: Services & Goods | |
| SubSector: Catalog & Mail Order Houses | |
| MarketCap: 51.9592 Millions | |
| Recent Price: 1.20 Smart Investing & Trading Score: 100 | |
| Day Percent Change: 3.32% Day Change: 0.04 | |
| Week Change: 5.51% Year-to-date Change: -25.9% | |
| LITB Links: Profile News Message Board | |
| Charts:- Daily , Weekly | |
| Add LITB to Watchlist: View: Get Complete LITB Trend Analysis ➞ | |
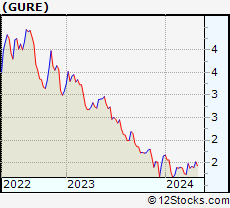 | GURE Gulf Resources, Inc. |
| Sector: Materials | |
| SubSector: Specialty Chemicals | |
| MarketCap: 40.8357 Millions | |
| Recent Price: 0.72 Smart Investing & Trading Score: 80 | |
| Day Percent Change: -3.18% Day Change: -0.02 | |
| Week Change: 5.14% Year-to-date Change: 23.4% | |
| GURE Links: Profile News Message Board | |
| Charts:- Daily , Weekly | |
| Add GURE to Watchlist: View: Get Complete GURE Trend Analysis ➞ | |
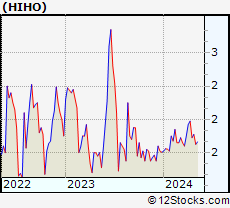 | HIHO Highway Holdings Limited |
| Sector: Industrials | |
| SubSector: Metal Fabrication | |
| MarketCap: 8.3225 Millions | |
| Recent Price: 1.71 Smart Investing & Trading Score: 40 | |
| Day Percent Change: -2.94% Day Change: -0.05 | |
| Week Change: 5.1% Year-to-date Change: -15.4% | |
| HIHO Links: Profile News Message Board | |
| Charts:- Daily , Weekly | |
| Add HIHO to Watchlist: View: Get Complete HIHO Trend Analysis ➞ | |
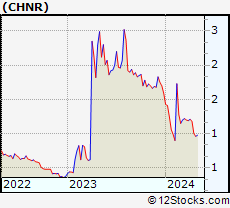 | CHNR China Natural Resources, Inc. |
| Sector: Materials | |
| SubSector: Industrial Metals & Minerals | |
| MarketCap: 21.691 Millions | |
| Recent Price: 3.76 Smart Investing & Trading Score: 100 | |
| Day Percent Change: -0.37% Day Change: -0.01 | |
| Week Change: 3.56% Year-to-date Change: -33.1% | |
| CHNR Links: Profile News Message Board | |
| Charts:- Daily , Weekly | |
| Add CHNR to Watchlist: View: Get Complete CHNR Trend Analysis ➞ | |
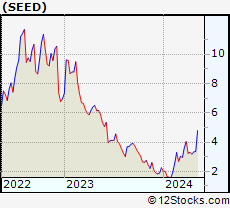 | SEED Origin Agritech Limited |
| Sector: Consumer Staples | |
| SubSector: Farm Products | |
| MarketCap: 21.6087 Millions | |
| Recent Price: 1.17 Smart Investing & Trading Score: 20 | |
| Day Percent Change: 0.92% Day Change: 0.01 | |
| Week Change: 2.79% Year-to-date Change: -47.6% | |
| SEED Links: Profile News Message Board | |
| Charts:- Daily , Weekly | |
| Add SEED to Watchlist: View: Get Complete SEED Trend Analysis ➞ | |
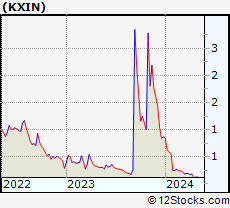 | KXIN Kaixin Auto Holdings |
| Sector: Industrials | |
| SubSector: Conglomerates | |
| MarketCap: 54.6848 Millions | |
| Recent Price: 0.64 Smart Investing & Trading Score: 20 | |
| Day Percent Change: -2.69% Day Change: -0.02 | |
| Week Change: 2.71% Year-to-date Change: -52.6% | |
| KXIN Links: Profile News Message Board | |
| Charts:- Daily , Weekly | |
| Add KXIN to Watchlist: View: Get Complete KXIN Trend Analysis ➞ | |
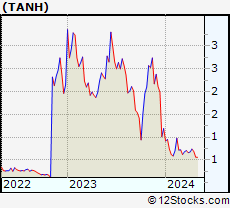 | TANH Tantech Holdings Ltd |
| Sector: Materials | |
| SubSector: Nonmetallic Mineral Mining | |
| MarketCap: 30.55 Millions | |
| Recent Price: 2.02 Smart Investing & Trading Score: 90 | |
| Day Percent Change: 2.57% Day Change: 0.05 | |
| Week Change: 2.6% Year-to-date Change: -77.1% | |
| TANH Links: Profile News Message Board | |
| Charts:- Daily , Weekly | |
| Add TANH to Watchlist: View: Get Complete TANH Trend Analysis ➞ | |
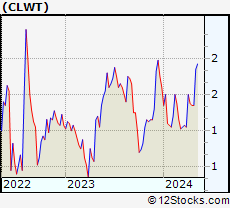 | CLWT Euro Tech Holdings Company Limited |
| Sector: Industrials | |
| SubSector: Pollution & Treatment Controls | |
| MarketCap: 6.18975 Millions | |
| Recent Price: 1.28 Smart Investing & Trading Score: 100 | |
| Day Percent Change: -1.61% Day Change: -0.02 | |
| Week Change: 2.52% Year-to-date Change: -12.2% | |
| CLWT Links: Profile News Message Board | |
| Charts:- Daily , Weekly | |
| Add CLWT to Watchlist: View: Get Complete CLWT Trend Analysis ➞ | |
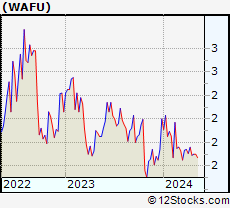 | WAFU Wah Fu Education Group Limited |
| Sector: Services & Goods | |
| SubSector: Education & Training Services | |
| MarketCap: 6 Millions | |
| Recent Price: 1.46 Smart Investing & Trading Score: 100 | |
| Day Percent Change: 0.35% Day Change: 0 | |
| Week Change: 2.48% Year-to-date Change: -14.0% | |
| WAFU Links: Profile News Message Board | |
| Charts:- Daily , Weekly | |
| Add WAFU to Watchlist: View: Get Complete WAFU Trend Analysis ➞ | |
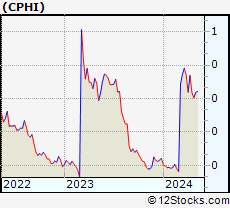 | CPHI China Pharma Holdings, Inc. |
| Sector: Health Care | |
| SubSector: Drug Manufacturers - Major | |
| MarketCap: 29.4543 Millions | |
| Recent Price: 1.39 Smart Investing & Trading Score: 60 | |
| Day Percent Change: 3.5% Day Change: 0.05 | |
| Week Change: 1.37% Year-to-date Change: -36.3% | |
| CPHI Links: Profile News Message Board | |
| Charts:- Daily , Weekly | |
| Add CPHI to Watchlist: View: Get Complete CPHI Trend Analysis ➞ | |
 | DTSS Datasea Inc. |
| Sector: Industrials | |
| SubSector: Conglomerates | |
| MarketCap: 36.8848 Millions | |
| Recent Price: 2.06 Smart Investing & Trading Score: 50 | |
| Day Percent Change: -2.76% Day Change: -0.05 | |
| Week Change: 0.98% Year-to-date Change: -19.8% | |
| DTSS Links: Profile News Message Board | |
| Charts:- Daily , Weekly | |
| Add DTSS to Watchlist: View: Get Complete DTSS Trend Analysis ➞ | |
 | CBAT CBAK Energy Technology, Inc. |
| Sector: Health Care | |
| SubSector: Medical Laboratories & Research | |
| MarketCap: 22.43 Millions | |
| Recent Price: 0.93 Smart Investing & Trading Score: 20 | |
| Day Percent Change: 1.12% Day Change: 0.01 | |
| Week Change: 0.23% Year-to-date Change: 5.3% | |
| CBAT Links: Profile News Message Board | |
| Charts:- Daily , Weekly | |
| Add CBAT to Watchlist: View: Get Complete CBAT Trend Analysis ➞ | |
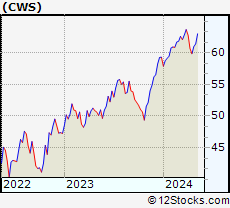 | CWS AdvisorShares Focused Equity ETF |
| Sector: Utilities | |
| SubSector: Exchange Traded Fund | |
| MarketCap: 0 Millions | |
| Recent Price: 69.00 Smart Investing & Trading Score: 30 | |
| Day Percent Change: -0.29% Day Change: -0.2 | |
| Week Change: 0.02% Year-to-date Change: 6.1% | |
| CWS Links: Profile News Message Board | |
| Charts:- Daily , Weekly | |
| Add CWS to Watchlist: View: Get Complete CWS Trend Analysis ➞ | |
 | CALI China Auto Logistics Inc. |
| Sector: Services & Goods | |
| SubSector: Auto Dealerships | |
| MarketCap: 6.86 Millions | |
| Recent Price: 50.61 Smart Investing & Trading Score: 40 | |
| Day Percent Change: -0.02% Day Change: -0.01 | |
| Week Change: 0.01% Year-to-date Change: 2.1% | |
| CALI Links: Profile News Message Board | |
| Charts:- Daily , Weekly | |
| Add CALI to Watchlist: View: Get Complete CALI Trend Analysis ➞ | |
 | UTSI UTStarcom Holdings Corp. |
| Sector: Technology | |
| SubSector: Communication Equipment | |
| MarketCap: 76.6539 Millions | |
| Recent Price: 2.63 Smart Investing & Trading Score: 40 | |
| Day Percent Change: 0% Day Change: -9996.6 | |
| Week Change: 0% Year-to-date Change: -17.2% | |
| UTSI Links: Profile News Message Board | |
| Charts:- Daily , Weekly | |
| Add UTSI to Watchlist: View: Get Complete UTSI Trend Analysis ➞ | |
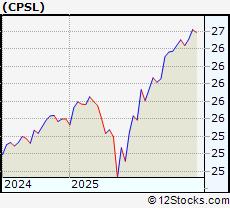 | CPSL China Precision Steel, Inc. |
| Sector: Materials | |
| SubSector: Steel & Iron | |
| MarketCap: 0 Millions | |
| Recent Price: 26.71 Smart Investing & Trading Score: 80 | |
| Day Percent Change: 0.02% Day Change: 0.01 | |
| Week Change: -0.16% Year-to-date Change: 4.0% | |
| CPSL Links: Profile News Message Board | |
| Charts:- Daily , Weekly | |
| Add CPSL to Watchlist: View: Get Complete CPSL Trend Analysis ➞ | |
| For tabular summary view of above stock list: Summary View ➞ 0 - 25 , 25 - 50 | ||
| Click To Change The Sort Order: By Market Cap or Company Size Performance: Year-to-date, Week and Day | |
| Select Chart Type: | ||
|
Best Stocks Today 12Stocks.com |
© 2025 12Stocks.com Terms & Conditions Privacy Contact Us
All Information Provided Only For Education And Not To Be Used For Investing or Trading. See Terms & Conditions


One More Thing ... Get Best Stocks Delivered Daily!
Never Ever Miss A Move With Our Top Ten Stocks Lists
Find Best Stocks In Any Market - Bull or Bear Market
Take A Peek At Our Top Ten Stocks Lists: Daily, Weekly, Year-to-Date & Top Trends
Find Best Stocks In Any Market - Bull or Bear Market
Take A Peek At Our Top Ten Stocks Lists: Daily, Weekly, Year-to-Date & Top Trends
China Stocks With Best Up Trends [0-bearish to 100-bullish]: Full Truck[100], Kanzhun [100], Baozun [100], iQIYI [100], Baidu [100], Smart Share[100], 17 Education[100], China Online[100], RLX [100], Melco Resorts[100], Daqo New[100]
Best China Stocks Year-to-Date:
Regencell Bioscience[9561.54%], I Mab[454.12%], So-Young [384.74%], QuantaSing [269.91%], Xunlei [264.32%], OneConnect Financial[205.35%], Niu [159.78%], Viomi [154.48%], Yatsen Holding[141.21%], Tencent Music[120.18%], XPeng [92.47%] Best China Stocks This Week:
Xunlei [43.56%], Burning Rock[41.87%], NIO [24.49%], iQIYI [23.04%], Zhihu [18.1%], XPeng [17.39%], Smart Share[14.53%], Cheetah Mobile[13.59%], MINISO [13.58%], QuantaSing [13.01%], Full Truck[12.26%] Best China Stocks Daily:
X Financial[15.73%], XPeng [11.68%], Full Truck[9.81%], Viomi [9.39%], NIO [9.27%], CNFinance [7.77%], Lixiang Education[7.32%], Kanzhun [6.61%], MINISO [6.38%], Burning Rock[6.02%], FinVolution [5.55%]