
 Login Sign Up


| |||||
 |  | ||||

| 12Stocks.com Market Intelligence |
Best China Stocks
|
On this page, you will find the most comprehensive analysis of Chinese stocks and ETFs - from latest trends to performances to charts ➞. First, here are the year-to-date (YTD) performances of the most requested China stocks at 12Stocks.com (click stock for review):
| New Oriental 16% | ||
| Sohu.com 10% | ||
| NetEase 0% | ||
| Alibaba -11% | ||
| JD.com -13% | ||
| Vipshop -15% | ||
| JOYY -18% | ||
| Baidu -20% | ||
| Weibo -28% | ||
| In a hurry? China Stocks Lists: Performance Trends Table, Stock Charts
Sort China stocks: Daily, Weekly, Year-to-Date, Market Cap & Trends. Filter China stocks list by sector: Show all, Tech, Finance, Energy, Staples, Retail, Industrial, Materials, Utilities and HealthCare Filter China stocks list by size: All China Large Medium Small and MicroCap |
| April 19, 2024 - 12Stocks.com China Stocks Performances & Trends Daily | |||||||||
|
|  The overall Smart Investing & Trading Score is 74 (0-bearish to 100-bullish) which puts China index in short term neutral to bullish trend. The Smart Investing & Trading Score from previous trading session is 73 and hence an improvement of trend.
| ||||||||
| Here are the Smart Investing & Trading Scores of the most requested China stocks at 12Stocks.com (click stock name for detailed review): |


| 12Stocks.com: Top Performing China Index Stocks | ||||||||||||||||||||||||||||||||||||||||||||||||
 The top performing China Index stocks year to date are
Now, more recently, over last week, the top performing China Index stocks on the move are


|
||||||||||||||||||||||||||||||||||||||||||||||||
| 12Stocks.com: Investing in China Index with Stocks | |
|
The following table helps investors and traders sort through current performance and trends (as measured by Smart Investing & Trading Score) of various
stocks in the China Index. Quick View: Move mouse or cursor over stock symbol (ticker) to view short-term technical chart and over stock name to view long term chart. Click on  to add stock symbol to your watchlist and to add stock symbol to your watchlist and  to view watchlist. Click on any ticker or stock name for detailed market intelligence report for that stock. to view watchlist. Click on any ticker or stock name for detailed market intelligence report for that stock. |
12Stocks.com Performance of Stocks in China Index
| Ticker | Stock Name | Watchlist | Category | Recent Price | Smart Investing & Trading Score | Change % | Weekly Change% |
| UCAR | U Power |   | Services & Goods | 5.22 | 76 | -2.06% | 2.35% |
| NTES | NetEase | | Technology | 93.30 | 32 | 0.86% | 1.25% |
| LKCO | Luokung | | Technology | 0.54 | 41 | -0.19% | 1.07% |
| YMM | Full Truck | | Technology | 7.72 | 93 | 1.38% | 0.19% |
| SY | So-Young | | Technology | 1.17 | 83 | -2.50% | 0.00% |
| SVA | Sinovac Biotech | | Health Care | 6.47 | 27 | 0.00% | 0.00% |
| SMI | Semiconductor | | Technology | 45.67 | 36 | -0.05% | -0.07% |
| JFIN | Jiayin | | Technology | 6.45 | 58 | 1.49% | -0.15% |
| RLX | RLX | | Consumer Staples | 1.75 | 10 | -1.68% | -0.28% |
| TOUR | Tuniu | | Consumer Staples | 0.78 | 95 | -8.51% | -0.28% |
| YUMC | Yum China | | Services & Goods | 37.22 | 68 | -0.01% | -0.33% |
| TME | Tencent Music | | Technology | 11.33 | 61 | -2.16% | -0.35% |
| JD | JD.com | | Technology | 25.27 | 61 | -0.73% | -0.45% |
| BEST | BEST | | Consumer Staples | 2.09 | 25 | 0.48% | -0.48% |
| EDTK | Skillful Craftsman | | Consumer Staples | 0.92 | 18 | -0.54% | -0.54% |
| CNF | CNFinance | | Financials | 1.84 | 10 | -0.54% | -0.54% |
| VIOT | Viomi | | Technology | 0.55 | 35 | 0.00% | -0.82% |
| IMAB | I Mab | | Health Care | 1.79 | 56 | -0.28% | -0.83% |
| ICG | Intchains | | Technology | 8.17 | 42 | 0.86% | -0.97% |
| EBON | Ebang | | Technology | 8.24 | 32 | 0.00% | -1.08% |
| ZLAB | Zai Lab | | Health Care | 14.14 | 20 | -0.56% | -1.19% |
| API | Agora | | Technology | 2.41 | 25 | -1.23% | -1.23% |
| KC | Kingsoft Cloud | | Technology | 2.67 | 58 | 0.19% | -1.30% |
| DADA | Dada Nexus | | Services & Goods | 1.89 | 27 | 2.17% | -1.31% |
| XIN | Xinyuan Real | | Financials | 2.63 | 17 | 1.35% | -1.31% |
| For chart view version of above stock list: Chart View ➞ 0 - 25 , 25 - 50 , 50 - 75 , 75 - 100 , 100 - 125 , 125 - 150 | ||
 | Click To Change The Sort Order: By Market Cap or Company Size Performance: Year-to-date, Week and Day |  |
|
Get the most comprehensive stock market coverage daily at 12Stocks.com ➞ Best Stocks Today ➞ Best Stocks Weekly ➞ Best Stocks Year-to-Date ➞ Best Stocks Trends ➞  Best Stocks Today 12Stocks.com Best Nasdaq Stocks ➞ Best S&P 500 Stocks ➞ Best Tech Stocks ➞ Best Biotech Stocks ➞ |
| Detailed Overview of China Stocks |
| China Technical Overview, Leaders & Laggards, Top China ETF Funds & Detailed China Stocks List, Charts, Trends & More |
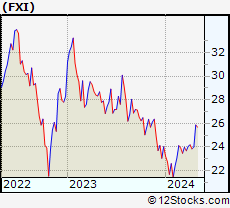
| China: Technical Analysis, Trends & YTD Performance | |
 FXI Weekly Chart |
|
| Long Term Trend: Very Good | |
| Medium Term Trend: Not Good | |
 FXI Daily Chart |
|
| Short Term Trend: Very Good | |
| Overall Trend Score: 74 | |
| YTD Performance: -0.27% | |
| **Trend Scores & Views Are Only For Educational Purposes And Not For Investing | |
| 12Stocks.com: Investing in China Index using Exchange Traded Funds | |
|
The following table shows list of key exchange traded funds (ETF) that
help investors play China stock market. For detailed view, check out our ETF Funds section of our website. Quick View: Move mouse or cursor over ETF symbol (ticker) to view short-term technical chart and over ETF name to view long term chart. Click on ticker or stock name for detailed view. Click on to add stock symbol to your watchlist and to view watchlist. |
12Stocks.com List of ETFs that track China Index
| Ticker | ETF Name | Watchlist | Recent Price | Smart Investing & Trading Score | Change % | Week % | Year-to-date % |
| FXI | China Large-Cap | | 23.97 | 74 | -0.48 | 0.52 | -0.27% |
| EWH | Hong Kong | | 14.67 | 10 | -0.47 | -3.23 | -15.54% |
| YINN | China Bull 3X | | 18.61 | 66 | -1.06 | 1.2 | -11.13% |
| YANG | China Bear 3X | | 11.74 | 39 | 1.42 | -1.22 | -8.24% |
| XPP | China 50 | | 12.95 | 73 | -0.31 | 1.33 | -5.78% |
| MCHI | China | | 39.33 | 59 | -0.53 | 0.13 | -3.46% |
| GXC | China | | 65.28 | 59 | -0.37 | 0.32 | -4.17% |
| CBON | ChinaAMC China Bond | | 21.93 | 60 | 0.05 | 0.3 | -0.79% |
| 12Stocks.com: Charts, Trends, Fundamental Data and Performances of China Stocks | |
|
We now take in-depth look at all China stocks including charts, multi-period performances and overall trends (as measured by Smart Investing & Trading Score). One can sort China stocks (click link to choose) by Daily, Weekly and by Year-to-Date performances. Also, one can sort by size of the company or by market capitalization. |
| Select Your Default Chart Type: | |||||
| |||||
| Click on stock symbol or name for detailed view. Click on to add stock symbol to your watchlist and to view watchlist. Quick View: Move mouse or cursor over "Daily" to quickly view daily technical stock chart and over "Weekly" to view weekly technical stock chart. | |||||

 | UCAR U Power Limited |
| Sector: Services & Goods | |
| SubSector: Auto & Truck Dealerships | |
| MarketCap: 372 Millions | |
| Recent Price: 5.22 Smart Investing & Trading Score: 76 | |
| Day Percent Change: -2.06% Day Change: -0.11 | |
| Week Change: 2.35% Year-to-date Change: 2,813.0% | |
| UCAR Links: Profile News Message Board | |
| Charts:- Daily , Weekly | |
| Add UCAR to Watchlist: View: Get Complete UCAR Trend Analysis ➞ | |
 | NTES NetEase, Inc. |
| Sector: Technology | |
| SubSector: Internet Software & Services | |
| MarketCap: 40105.1 Millions | |
| Recent Price: 93.30 Smart Investing & Trading Score: 32 | |
| Day Percent Change: 0.86% Day Change: 0.80 | |
| Week Change: 1.25% Year-to-date Change: 0.2% | |
| NTES Links: Profile News Message Board | |
| Charts:- Daily , Weekly | |
| Add NTES to Watchlist: View: Get Complete NTES Trend Analysis ➞ | |
 | LKCO Luokung Technology Corp. |
| Sector: Technology | |
| SubSector: Application Software | |
| MarketCap: 84 Millions | |
| Recent Price: 0.54 Smart Investing & Trading Score: 41 | |
| Day Percent Change: -0.19% Day Change: 0.00 | |
| Week Change: 1.07% Year-to-date Change: 8.7% | |
| LKCO Links: Profile News Message Board | |
| Charts:- Daily , Weekly | |
| Add LKCO to Watchlist: View: Get Complete LKCO Trend Analysis ➞ | |
 | YMM Full Truck Alliance Co. Ltd. |
| Sector: Technology | |
| SubSector: Software - Application | |
| MarketCap: 6960 Millions | |
| Recent Price: 7.72 Smart Investing & Trading Score: 93 | |
| Day Percent Change: 1.38% Day Change: 0.10 | |
| Week Change: 0.19% Year-to-date Change: 10.4% | |
| YMM Links: Profile News Message Board | |
| Charts:- Daily , Weekly | |
| Add YMM to Watchlist: View: Get Complete YMM Trend Analysis ➞ | |
 | SY So-Young International Inc. |
| Sector: Technology | |
| SubSector: Healthcare Information Services | |
| MarketCap: 1000.55 Millions | |
| Recent Price: 1.17 Smart Investing & Trading Score: 83 | |
| Day Percent Change: -2.50% Day Change: -0.03 | |
| Week Change: 0% Year-to-date Change: -9.3% | |
| SY Links: Profile News Message Board | |
| Charts:- Daily , Weekly | |
| Add SY to Watchlist: View: Get Complete SY Trend Analysis ➞ | |
 | SVA Sinovac Biotech Ltd. |
| Sector: Health Care | |
| SubSector: Biotechnology | |
| MarketCap: 336.88 Millions | |
| Recent Price: 6.47 Smart Investing & Trading Score: 27 | |
| Day Percent Change: 0.00% Day Change: 0.00 | |
| Week Change: 0% Year-to-date Change: 0.0% | |
| SVA Links: Profile News Message Board | |
| Charts:- Daily , Weekly | |
| Add SVA to Watchlist: View: Get Complete SVA Trend Analysis ➞ | |
 | SMI Semiconductor Manufacturing International Corporation |
| Sector: Technology | |
| SubSector: Semiconductor - Integrated Circuits | |
| MarketCap: 6287.56 Millions | |
| Recent Price: 45.67 Smart Investing & Trading Score: 36 | |
| Day Percent Change: -0.05% Day Change: -0.02 | |
| Week Change: -0.07% Year-to-date Change: -1.7% | |
| SMI Links: Profile News Message Board | |
| Charts:- Daily , Weekly | |
| Add SMI to Watchlist: View: Get Complete SMI Trend Analysis ➞ | |
 | JFIN Jiayin Group Inc. |
| Sector: Technology | |
| SubSector: Internet Information Providers | |
| MarketCap: 131.48 Millions | |
| Recent Price: 6.45 Smart Investing & Trading Score: 58 | |
| Day Percent Change: 1.49% Day Change: 0.09 | |
| Week Change: -0.15% Year-to-date Change: 24.5% | |
| JFIN Links: Profile News Message Board | |
| Charts:- Daily , Weekly | |
| Add JFIN to Watchlist: View: Get Complete JFIN Trend Analysis ➞ | |
 | RLX RLX Technology Inc. |
| Sector: Consumer Staples | |
| SubSector: Tobacco | |
| MarketCap: 2800 Millions | |
| Recent Price: 1.75 Smart Investing & Trading Score: 10 | |
| Day Percent Change: -1.68% Day Change: -0.03 | |
| Week Change: -0.28% Year-to-date Change: -11.4% | |
| RLX Links: Profile News Message Board | |
| Charts:- Daily , Weekly | |
| Add RLX to Watchlist: View: Get Complete RLX Trend Analysis ➞ | |
 | TOUR Tuniu Corporation |
| Sector: Consumer Staples | |
| SubSector: Recreational Goods, Other | |
| MarketCap: 124.459 Millions | |
| Recent Price: 0.78 Smart Investing & Trading Score: 95 | |
| Day Percent Change: -8.51% Day Change: -0.07 | |
| Week Change: -0.28% Year-to-date Change: 15.9% | |
| TOUR Links: Profile News Message Board | |
| Charts:- Daily , Weekly | |
| Add TOUR to Watchlist: View: Get Complete TOUR Trend Analysis ➞ | |
 | YUMC Yum China Holdings, Inc. |
| Sector: Services & Goods | |
| SubSector: Restaurants | |
| MarketCap: 16284.5 Millions | |
| Recent Price: 37.22 Smart Investing & Trading Score: 68 | |
| Day Percent Change: -0.01% Day Change: 0.00 | |
| Week Change: -0.33% Year-to-date Change: -12.3% | |
| YUMC Links: Profile News Message Board | |
| Charts:- Daily , Weekly | |
| Add YUMC to Watchlist: View: Get Complete YUMC Trend Analysis ➞ | |
 | TME Tencent Music Entertainment Group |
| Sector: Technology | |
| SubSector: Internet Information Providers | |
| MarketCap: 16195 Millions | |
| Recent Price: 11.33 Smart Investing & Trading Score: 61 | |
| Day Percent Change: -2.16% Day Change: -0.25 | |
| Week Change: -0.35% Year-to-date Change: 25.8% | |
| TME Links: Profile News Message Board | |
| Charts:- Daily , Weekly | |
| Add TME to Watchlist: View: Get Complete TME Trend Analysis ➞ | |
 | JD JD.com, Inc. |
| Sector: Technology | |
| SubSector: Internet Information Providers | |
| MarketCap: 59907.3 Millions | |
| Recent Price: 25.27 Smart Investing & Trading Score: 61 | |
| Day Percent Change: -0.73% Day Change: -0.19 | |
| Week Change: -0.45% Year-to-date Change: -12.5% | |
| JD Links: Profile News Message Board | |
| Charts:- Daily , Weekly | |
| Add JD to Watchlist: View: Get Complete JD Trend Analysis ➞ | |
 | BEST BEST Inc. |
| Sector: Consumer Staples | |
| SubSector: Packaging & Containers | |
| MarketCap: 1981.73 Millions | |
| Recent Price: 2.09 Smart Investing & Trading Score: 25 | |
| Day Percent Change: 0.48% Day Change: 0.01 | |
| Week Change: -0.48% Year-to-date Change: -18.1% | |
| BEST Links: Profile News Message Board | |
| Charts:- Daily , Weekly | |
| Add BEST to Watchlist: View: Get Complete BEST Trend Analysis ➞ | |
 | EDTK Skillful Craftsman Education Technology Limited |
| Sector: Consumer Staples | |
| SubSector: Education & Training Services | |
| MarketCap: 32347 Millions | |
| Recent Price: 0.92 Smart Investing & Trading Score: 18 | |
| Day Percent Change: -0.54% Day Change: -0.01 | |
| Week Change: -0.54% Year-to-date Change: -27.4% | |
| EDTK Links: Profile News Message Board | |
| Charts:- Daily , Weekly | |
| Add EDTK to Watchlist: View: Get Complete EDTK Trend Analysis ➞ | |
 | CNF CNFinance Holdings Limited |
| Sector: Financials | |
| SubSector: Credit Services | |
| MarketCap: 277.408 Millions | |
| Recent Price: 1.84 Smart Investing & Trading Score: 10 | |
| Day Percent Change: -0.54% Day Change: -0.01 | |
| Week Change: -0.54% Year-to-date Change: -17.1% | |
| CNF Links: Profile News Message Board | |
| Charts:- Daily , Weekly | |
| Add CNF to Watchlist: View: Get Complete CNF Trend Analysis ➞ | |
 | VIOT Viomi Technology Co., Ltd |
| Sector: Technology | |
| SubSector: Electronic Equipment | |
| MarketCap: 357.2 Millions | |
| Recent Price: 0.55 Smart Investing & Trading Score: 35 | |
| Day Percent Change: 0.00% Day Change: 0.00 | |
| Week Change: -0.82% Year-to-date Change: -45.5% | |
| VIOT Links: Profile News Message Board | |
| Charts:- Daily , Weekly | |
| Add VIOT to Watchlist: View: Get Complete VIOT Trend Analysis ➞ | |
 | IMAB I Mab |
| Sector: Health Care | |
| SubSector: Biotechnology | |
| MarketCap: 26187 Millions | |
| Recent Price: 1.79 Smart Investing & Trading Score: 56 | |
| Day Percent Change: -0.28% Day Change: -0.01 | |
| Week Change: -0.83% Year-to-date Change: -5.5% | |
| IMAB Links: Profile News Message Board | |
| Charts:- Daily , Weekly | |
| Add IMAB to Watchlist: View: Get Complete IMAB Trend Analysis ➞ | |
 | ICG Intchains Group Limited |
| Sector: Technology | |
| SubSector: Semiconductors | |
| MarketCap: 450 Millions | |
| Recent Price: 8.17 Smart Investing & Trading Score: 42 | |
| Day Percent Change: 0.86% Day Change: 0.07 | |
| Week Change: -0.97% Year-to-date Change: -33.6% | |
| ICG Links: Profile News Message Board | |
| Charts:- Daily , Weekly | |
| Add ICG to Watchlist: View: Get Complete ICG Trend Analysis ➞ | |
 | EBON Ebang International Holdings Inc. |
| Sector: Technology | |
| SubSector: Computer Hardware | |
| MarketCap: 33787 Millions | |
| Recent Price: 8.24 Smart Investing & Trading Score: 32 | |
| Day Percent Change: 0.00% Day Change: 0.00 | |
| Week Change: -1.08% Year-to-date Change: -46.1% | |
| EBON Links: Profile News Message Board | |
| Charts:- Daily , Weekly | |
| Add EBON to Watchlist: View: Get Complete EBON Trend Analysis ➞ | |
 | ZLAB Zai Lab Limited |
| Sector: Health Care | |
| SubSector: Biotechnology | |
| MarketCap: 3970.35 Millions | |
| Recent Price: 14.14 Smart Investing & Trading Score: 20 | |
| Day Percent Change: -0.56% Day Change: -0.08 | |
| Week Change: -1.19% Year-to-date Change: -48.3% | |
| ZLAB Links: Profile News Message Board | |
| Charts:- Daily , Weekly | |
| Add ZLAB to Watchlist: View: Get Complete ZLAB Trend Analysis ➞ | |
 | API Agora, Inc. |
| Sector: Technology | |
| SubSector: Software Application | |
| MarketCap: 42787 Millions | |
| Recent Price: 2.41 Smart Investing & Trading Score: 25 | |
| Day Percent Change: -1.23% Day Change: -0.03 | |
| Week Change: -1.23% Year-to-date Change: -8.7% | |
| API Links: Profile News Message Board | |
| Charts:- Daily , Weekly | |
| Add API to Watchlist: View: Get Complete API Trend Analysis ➞ | |
 | KC Kingsoft Cloud Holdings Limited |
| Sector: Technology | |
| SubSector: Software Application | |
| MarketCap: 98487 Millions | |
| Recent Price: 2.67 Smart Investing & Trading Score: 58 | |
| Day Percent Change: 0.19% Day Change: 0.00 | |
| Week Change: -1.3% Year-to-date Change: -29.6% | |
| KC Links: Profile News Message Board | |
| Charts:- Daily , Weekly | |
| Add KC to Watchlist: View: Get Complete KC Trend Analysis ➞ | |
 | DADA Dada Nexus Limited |
| Sector: Services & Goods | |
| SubSector: Internet Retail | |
| MarketCap: 98527 Millions | |
| Recent Price: 1.89 Smart Investing & Trading Score: 27 | |
| Day Percent Change: 2.17% Day Change: 0.04 | |
| Week Change: -1.31% Year-to-date Change: -43.2% | |
| DADA Links: Profile News Message Board | |
| Charts:- Daily , Weekly | |
| Add DADA to Watchlist: View: Get Complete DADA Trend Analysis ➞ | |
 | XIN Xinyuan Real Estate Co., Ltd. |
| Sector: Financials | |
| SubSector: Real Estate Development | |
| MarketCap: 136.119 Millions | |
| Recent Price: 2.63 Smart Investing & Trading Score: 17 | |
| Day Percent Change: 1.35% Day Change: 0.03 | |
| Week Change: -1.31% Year-to-date Change: -3.1% | |
| XIN Links: Profile News Message Board | |
| Charts:- Daily , Weekly | |
| Add XIN to Watchlist: View: Get Complete XIN Trend Analysis ➞ | |
| For tabular summary view of above stock list: Summary View ➞ 0 - 25 , 25 - 50 , 50 - 75 , 75 - 100 , 100 - 125 , 125 - 150 | ||
| Click To Change The Sort Order: By Market Cap or Company Size Performance: Year-to-date, Week and Day | |
| Select Chart Type: | ||
|
Best Stocks Today 12Stocks.com |
© 2024 12Stocks.com Terms & Conditions Privacy Contact Us
All Information Provided Only For Education And Not To Be Used For Investing or Trading. See Terms & Conditions


One More Thing ... Get Best Stocks Delivered Daily!
Never Ever Miss A Move With Our Top Ten Stocks Lists
Find Best Stocks In Any Market - Bull or Bear Market
Take A Peek At Our Top Ten Stocks Lists: Daily, Weekly, Year-to-Date & Top Trends
Find Best Stocks In Any Market - Bull or Bear Market
Take A Peek At Our Top Ten Stocks Lists: Daily, Weekly, Year-to-Date & Top Trends
China Stocks With Best Up Trends [0-bearish to 100-bullish]: Full Truck[93], Bright Scholar[90], DouYu [90], GigaCloud [88], GDS [88], Smart Share[86], Lufax Holding[83], So-Young [83], U Power[76], Yatsen Holding[76], MingZhu Logistics[74]
Best China Stocks Year-to-Date:
U Power[2812.95%], DouYu [746.84%], MicroCloud Hologram[664.03%], China Liberal[476.51%], Zhongchao [412.19%], Yatsen Holding[394.12%], Uxin [141.08%], QuantaSing [117.28%], GigaCloud [95.49%], Bright Scholar[68%], Yiren Digital[54.49%] Best China Stocks This Week:
Regencell Bioscience[37.01%], Yatsen Holding[20.1%], MingZhu Logistics[17.48%], Secoo Holding[15.24%], Bright Scholar[14.13%], Zhongchao [14.02%], TH [10%], Smart Share[9.26%], Quhuo [8.87%], EHang [7.46%], DouYu [6.56%] Best China Stocks Daily:
Hywin [17.78%], Bright Scholar[11.70%], MingZhu Logistics[10.31%], Lanvin [8.39%], Aesthetic Medical[6.77%], Dingdong (Cayman)[4.91%], GreenTree Hospitality[4.56%], Cheetah Mobile[4.15%], Fangdd Network[4.00%], Shengfeng Development[3.77%], Burning Rock[3.52%]