
 Login Sign Up


| |||||
 |  | ||||

| 12Stocks.com Market Intelligence |
Best Canada Stocks
|
|
| Quick Read: Top Canada Stocks By Performances & Trends: Daily, Weekly, Year-to-Date, Market Cap (Size) & Technical Trends | |||
| Best Canada Views: Quick Browse View, Summary & Slide Show | |||
| 12Stocks.com Canada Stocks Performances & Trends Daily | |||||||||
|
|  The overall market intelligence score is 21 (0-bearish to 100-bullish) which puts Canada index in short term bearish to neutral trend. The market intelligence score from previous trading session is 46 and hence a deterioration of trend.
| ||||||||
Here are the market intelligence trend scores of the most requested Canada stocks at 12Stocks.com (click stock name for detailed review):
| |||||||||||||||||
| Scroll down this page for most comprehensive review of Canada stocks by performance, trends, technical analysis, charts, fund plays & more | |||||||||||||||||


| 12Stocks.com: Top Performing Canada Index Stocks | ||||||||||||||||||||||||||||||||||||||||||||||||
 The top performing Canada Index stocks year to date are
Now, more recently, over last week, the top performing Canada Index stocks on the move are


|
||||||||||||||||||||||||||||||||||||||||||||||||
| 12Stocks.com: Investing in Canada Index with Stocks | |
|
The following table helps investors and traders sort through current performance and trends (as measured by market intelligence score) of various
stocks in the Canada Index. Quick View: Move mouse or cursor over stock symbol (ticker) to view short-term technical chart and over stock name to view long term chart. Click on  to add stock symbol to your watchlist and to add stock symbol to your watchlist and  to view watchlist. Click on any ticker or stock name for detailed market intelligence report for that stock. to view watchlist. Click on any ticker or stock name for detailed market intelligence report for that stock. |
12Stocks.com Performance of Stocks in Canada Index
| Ticker | Stock Name | Watchlist | Category | Recent Price | Market Intelligence Score | Change % | YTD Change% |
| FSM | Fortuna Silver |   | Materials | 4.69 | 75 | 3.30% | 21.50% |
| MIST | Milestone | | Health Care | 1.60 | 47 | -3.61% | -4.19% |
| VET | Vermilion Energy | | Energy | 11.26 | 36 | -2.34% | -6.63% |
| QBTS | D-Wave Quantum | | Technology | 1.41 | 22 | 2.92% | 60.70% |
| MUX | McEwen Mining | | Materials | 11.55 | 58 | 0.79% | 60.19% |
| OGI | OrganiGram | | Health Care | 1.92 | 29 | -9.67% | 46.18% |
| GROY | Gold Royalty | | Materials | 2.02 | 43 | -0.49% | 39.79% |
| EXK | Endeavour Silver | | Materials | 2.67 | 46 | 1.52% | 35.53% |
| LAC | Lithium Americas | | Materials | 4.35 | 20 | -1.36% | -32.03% |
| STKL | SunOpta | | Consumer Staples | 6.04 | 7 | -7.79% | 10.42% |
| NAK | Northern Dynasty | | Materials | 0.30 | 58 | -1.81% | -7.83% |
| NOA | Construction | | Energy | 21.12 | 15 | -2.58% | 1.29% |
| DNN | Denison Mines | | Materials | 2.04 | 50 | 3.03% | 15.25% |
| VOXR | Vox Royalty | | Materials | 1.99 | 43 | -2.45% | -3.40% |
| TMQ | Trilogy Metals | | Materials | 0.40 | 0 | 0.60% | -5.91% |
| APT | Alpha Tech | | Industrials | 5.91 | 51 | -1.01% | 11.72% |
| VFF | Village Farms | | Consumer Staples | 1.33 | 60 | -13.07% | 74.77% |
| THTX | Thera | | Health Care | 1.30 | 17 | 0.00% | -19.75% |
| PROF | Profound Medical | | Materials | 7.45 | 0 | 0.13% | -12.25% |
| WPRT | Westport Fuel | | Consumer Staples | 5.21 | 0 | -7.13% | -21.30% |
| EMX | EMX Royalty | | Materials | 1.80 | 36 | -2.70% | 11.11% |
| PDS | Precision Drilling | | Energy | 68.86 | 43 | -1.88% | 26.84% |
| VERO | Venus Concept | | Health Care | 0.67 | 35 | 1.11% | -43.50% |
| TRX | Tanzanian Gold | | Materials | 0.44 | 51 | 0.95% | 16.83% |
| SNDL | Sundial Growers | | Health Care | 2.22 | 95 | -10.12% | 35.37% |
| To view more stocks, click on Next / Previous arrows or select different range: 0 - 25 , 25 - 50 , 50 - 75 , 75 - 100 , 100 - 125 , 125 - 150 | ||
 | Click To Change The Sort Order: By Market Cap or Company Size Performance: Year-to-date, Week and Day |  |
| Detailed Overview Of Canada Stocks |
| Canada Technical Overview, Leaders & Laggards, Top Canada ETF Funds & Detailed Canada Stocks List, Charts, Trends & More |
| Canada: Technical Analysis, Trends & YTD Performance | |
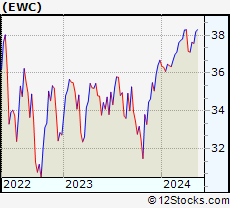
 EWC Weekly Chart |
|
| Long Term Trend: Good | |
| Medium Term Trend: Not Good | |
 EWC Daily Chart |
|
| Short Term Trend: Not Good | |
| Overall Trend Score: 21 | |
| YTD Performance: 0.71% | |
| **Trend Scores & Views Are Only For Educational Purposes And Not For Investing | |
| 12Stocks.com: Investing in Canada Index using Exchange Traded Funds | |
|
The following table shows list of key exchange traded funds (ETF) that
help investors play Canada stock market. For detailed view, check out our ETF Funds section of our website. Quick View: Move mouse or cursor over ETF symbol (ticker) to view short-term technical chart and over ETF name to view long term chart. Click on ticker or stock name for detailed view. Click on to add stock symbol to your watchlist and to view watchlist. |
12Stocks.com List of ETFs that track Canada Index
| Ticker | ETF Name | Watchlist | Recent Price | Market Intelligence Score | Change % | Week % | Year-to-date % |
| EWC | Canada | | 36.94 | 21 | 0.05 | -1.83 | 0.71% |
| 12Stocks.com: Charts, Trends, Fundamental Data and Performances of Canada Stocks | |
|
We now take in-depth look at all Canada stocks including charts, multi-period performances and overall trends (as measured by market intelligence score). One can sort Canada stocks (click link to choose) by Daily, Weekly and by Year-to-Date performances. Also, one can sort by size of the company or by market capitalization. |
| Select Your Default Chart Type: | |||||
| |||||
| Click on stock symbol or name for detailed view. Click on to add stock symbol to your watchlist and to view watchlist. Quick View: Move mouse or cursor over "Daily" to quickly view daily technical stock chart and over "Weekly" to view weekly technical stock chart. | |||||

 | FSM Fortuna Silver Mines Inc. |
| Sector: Materials | |
| SubSector: Silver | |
| MarketCap: 362.256 Millions | |
| Recent Price: 4.69 Market Intelligence Score: 75 | |
| Day Percent Change: 3.30% Day Change: 0.15 | |
| Week Change: -1.68% Year-to-date Change: 21.5% | |
| FSM Links: Profile News Message Board | |
| Charts:- Daily , Weekly | |
| Add FSM to Watchlist: View: Get Complete FSM Trend Analysis ➞ | |
 | MIST Milestone Pharmaceuticals Inc. |
| Sector: Health Care | |
| SubSector: Biotechnology | |
| MarketCap: 342.685 Millions | |
| Recent Price: 1.60 Market Intelligence Score: 47 | |
| Day Percent Change: -3.61% Day Change: -0.06 | |
| Week Change: 3.9% Year-to-date Change: -4.2% | |
| MIST Links: Profile News Message Board | |
| Charts:- Daily , Weekly | |
| Add MIST to Watchlist: View: Get Complete MIST Trend Analysis ➞ | |
 | VET Vermilion Energy Inc. |
| Sector: Energy | |
| SubSector: Oil & Gas Drilling & Exploration | |
| MarketCap: 335.839 Millions | |
| Recent Price: 11.26 Market Intelligence Score: 36 | |
| Day Percent Change: -2.34% Day Change: -0.27 | |
| Week Change: -6.87% Year-to-date Change: -6.6% | |
| VET Links: Profile News Message Board | |
| Charts:- Daily , Weekly | |
| Add VET to Watchlist: View: Get Complete VET Trend Analysis ➞ | |
 | QBTS D-Wave Quantum Inc. |
| Sector: Technology | |
| SubSector: Computer Hardware | |
| MarketCap: 290 Millions | |
| Recent Price: 1.41 Market Intelligence Score: 22 | |
| Day Percent Change: 2.92% Day Change: 0.04 | |
| Week Change: -2.08% Year-to-date Change: 60.7% | |
| QBTS Links: Profile News Message Board | |
| Charts:- Daily , Weekly | |
| Add QBTS to Watchlist: View: Get Complete QBTS Trend Analysis ➞ | |
 | MUX McEwen Mining Inc. |
| Sector: Materials | |
| SubSector: Gold | |
| MarketCap: 264.819 Millions | |
| Recent Price: 11.55 Market Intelligence Score: 58 | |
| Day Percent Change: 0.79% Day Change: 0.09 | |
| Week Change: -5.79% Year-to-date Change: 60.2% | |
| MUX Links: Profile News Message Board | |
| Charts:- Daily , Weekly | |
| Add MUX to Watchlist: View: Get Complete MUX Trend Analysis ➞ | |
 | OGI OrganiGram Holdings Inc. |
| Sector: Health Care | |
| SubSector: Drugs - Generic | |
| MarketCap: 256.885 Millions | |
| Recent Price: 1.92 Market Intelligence Score: 29 | |
| Day Percent Change: -9.67% Day Change: -0.21 | |
| Week Change: 2.96% Year-to-date Change: 46.2% | |
| OGI Links: Profile News Message Board | |
| Charts:- Daily , Weekly | |
| Add OGI to Watchlist: View: Get Complete OGI Trend Analysis ➞ | |
 | GROY Gold Royalty Corp. |
| Sector: Materials | |
| SubSector: Other Precious Metals & Mining | |
| MarketCap: 254 Millions | |
| Recent Price: 2.02 Market Intelligence Score: 43 | |
| Day Percent Change: -0.49% Day Change: -0.01 | |
| Week Change: -6.05% Year-to-date Change: 39.8% | |
| GROY Links: Profile News Message Board | |
| Charts:- Daily , Weekly | |
| Add GROY to Watchlist: View: Get Complete GROY Trend Analysis ➞ | |
 | EXK Endeavour Silver Corp. |
| Sector: Materials | |
| SubSector: Silver | |
| MarketCap: 204.456 Millions | |
| Recent Price: 2.67 Market Intelligence Score: 46 | |
| Day Percent Change: 1.52% Day Change: 0.04 | |
| Week Change: -3.96% Year-to-date Change: 35.5% | |
| EXK Links: Profile News Message Board | |
| Charts:- Daily , Weekly | |
| Add EXK to Watchlist: View: Get Complete EXK Trend Analysis ➞ | |
 | LAC Lithium Americas Corp. |
| Sector: Materials | |
| SubSector: Industrial Metals & Minerals | |
| MarketCap: 192.01 Millions | |
| Recent Price: 4.35 Market Intelligence Score: 20 | |
| Day Percent Change: -1.36% Day Change: -0.06 | |
| Week Change: -5.84% Year-to-date Change: -32.0% | |
| LAC Links: Profile News Message Board | |
| Charts:- Daily , Weekly | |
| Add LAC to Watchlist: View: Get Complete LAC Trend Analysis ➞ | |
 | STKL SunOpta Inc. |
| Sector: Consumer Staples | |
| SubSector: Processed & Packaged Goods | |
| MarketCap: 174.548 Millions | |
| Recent Price: 6.04 Market Intelligence Score: 7 | |
| Day Percent Change: -7.79% Day Change: -0.51 | |
| Week Change: -9.72% Year-to-date Change: 10.4% | |
| STKL Links: Profile News Message Board | |
| Charts:- Daily , Weekly | |
| Add STKL to Watchlist: View: Get Complete STKL Trend Analysis ➞ | |
 | NAK Northern Dynasty Minerals Ltd. |
| Sector: Materials | |
| SubSector: Industrial Metals & Minerals | |
| MarketCap: 167.01 Millions | |
| Recent Price: 0.30 Market Intelligence Score: 58 | |
| Day Percent Change: -1.81% Day Change: -0.01 | |
| Week Change: 1.02% Year-to-date Change: -7.8% | |
| NAK Links: Profile News Message Board | |
| Charts:- Daily , Weekly | |
| Add NAK to Watchlist: View: Get Complete NAK Trend Analysis ➞ | |
 | NOA North American Construction Group Ltd. |
| Sector: Energy | |
| SubSector: Oil & Gas Equipment & Services | |
| MarketCap: 160.461 Millions | |
| Recent Price: 21.12 Market Intelligence Score: 15 | |
| Day Percent Change: -2.58% Day Change: -0.56 | |
| Week Change: -4.3% Year-to-date Change: 1.3% | |
| NOA Links: Profile News Message Board | |
| Charts:- Daily , Weekly | |
| Add NOA to Watchlist: View: Get Complete NOA Trend Analysis ➞ | |
 | DNN Denison Mines Corp. |
| Sector: Materials | |
| SubSector: Industrial Metals & Minerals | |
| MarketCap: 154.11 Millions | |
| Recent Price: 2.04 Market Intelligence Score: 50 | |
| Day Percent Change: 3.03% Day Change: 0.06 | |
| Week Change: 0.49% Year-to-date Change: 15.3% | |
| DNN Links: Profile News Message Board | |
| Charts:- Daily , Weekly | |
| Add DNN to Watchlist: View: Get Complete DNN Trend Analysis ➞ | |
 | VOXR Vox Royalty Corp. |
| Sector: Materials | |
| SubSector: Other Precious Metals & Mining | |
| MarketCap: 154 Millions | |
| Recent Price: 1.99 Market Intelligence Score: 43 | |
| Day Percent Change: -2.45% Day Change: -0.05 | |
| Week Change: -6.13% Year-to-date Change: -3.4% | |
| VOXR Links: Profile News Message Board | |
| Charts:- Daily , Weekly | |
| Add VOXR to Watchlist: View: Get Complete VOXR Trend Analysis ➞ | |
 | TMQ Trilogy Metals Inc. |
| Sector: Materials | |
| SubSector: Industrial Metals & Minerals | |
| MarketCap: 151.21 Millions | |
| Recent Price: 0.40 Market Intelligence Score: 0 | |
| Day Percent Change: 0.60% Day Change: 0.00 | |
| Week Change: -1.32% Year-to-date Change: -5.9% | |
| TMQ Links: Profile News Message Board | |
| Charts:- Daily , Weekly | |
| Add TMQ to Watchlist: View: Get Complete TMQ Trend Analysis ➞ | |
 | APT Alpha Pro Tech, Ltd. |
| Sector: Industrials | |
| SubSector: General Building Materials | |
| MarketCap: 125.953 Millions | |
| Recent Price: 5.91 Market Intelligence Score: 51 | |
| Day Percent Change: -1.01% Day Change: -0.06 | |
| Week Change: -3.9% Year-to-date Change: 11.7% | |
| APT Links: Profile News Message Board | |
| Charts:- Daily , Weekly | |
| Add APT to Watchlist: View: Get Complete APT Trend Analysis ➞ | |
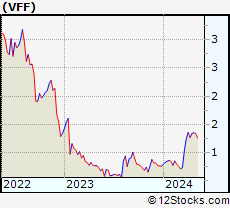 | VFF Village Farms International, Inc. |
| Sector: Consumer Staples | |
| SubSector: Farm Products | |
| MarketCap: 125.287 Millions | |
| Recent Price: 1.33 Market Intelligence Score: 60 | |
| Day Percent Change: -13.07% Day Change: -0.20 | |
| Week Change: -1.85% Year-to-date Change: 74.8% | |
| VFF Links: Profile News Message Board | |
| Charts:- Daily , Weekly | |
| Add VFF to Watchlist: View: Get Complete VFF Trend Analysis ➞ | |
 | THTX Theratechnologies Inc. |
| Sector: Health Care | |
| SubSector: Drugs - Generic | |
| MarketCap: 123.185 Millions | |
| Recent Price: 1.30 Market Intelligence Score: 17 | |
| Day Percent Change: 0.00% Day Change: 0.00 | |
| Week Change: 0% Year-to-date Change: -19.8% | |
| THTX Links: Profile News Message Board | |
| Charts:- Daily , Weekly | |
| Add THTX to Watchlist: View: Get Complete THTX Trend Analysis ➞ | |
 | PROF Profound Medical Corp. |
| Sector: Materials | |
| SubSector: Industrial Metals & Minerals | |
| MarketCap: 121.41 Millions | |
| Recent Price: 7.45 Market Intelligence Score: 0 | |
| Day Percent Change: 0.13% Day Change: 0.01 | |
| Week Change: -7.22% Year-to-date Change: -12.3% | |
| PROF Links: Profile News Message Board | |
| Charts:- Daily , Weekly | |
| Add PROF to Watchlist: View: Get Complete PROF Trend Analysis ➞ | |
 | WPRT Westport Fuel Systems Inc. |
| Sector: Consumer Staples | |
| SubSector: Auto Parts | |
| MarketCap: 108.939 Millions | |
| Recent Price: 5.21 Market Intelligence Score: 0 | |
| Day Percent Change: -7.13% Day Change: -0.40 | |
| Week Change: -7.95% Year-to-date Change: -21.3% | |
| WPRT Links: Profile News Message Board | |
| Charts:- Daily , Weekly | |
| Add WPRT to Watchlist: View: Get Complete WPRT Trend Analysis ➞ | |
 | EMX EMX Royalty Corporation |
| Sector: Materials | |
| SubSector: Industrial Metals & Minerals | |
| MarketCap: 103.91 Millions | |
| Recent Price: 1.80 Market Intelligence Score: 36 | |
| Day Percent Change: -2.70% Day Change: -0.05 | |
| Week Change: -6.25% Year-to-date Change: 11.1% | |
| EMX Links: Profile News Message Board | |
| Charts:- Daily , Weekly | |
| Add EMX to Watchlist: View: Get Complete EMX Trend Analysis ➞ | |
 | PDS Precision Drilling Corporation |
| Sector: Energy | |
| SubSector: Oil & Gas Equipment & Services | |
| MarketCap: 103.461 Millions | |
| Recent Price: 68.86 Market Intelligence Score: 43 | |
| Day Percent Change: -1.88% Day Change: -1.32 | |
| Week Change: -4.76% Year-to-date Change: 26.8% | |
| PDS Links: Profile News Message Board | |
| Charts:- Daily , Weekly | |
| Add PDS to Watchlist: View: Get Complete PDS Trend Analysis ➞ | |
 | VERO Venus Concept Inc. |
| Sector: Health Care | |
| SubSector: Medical Appliances & Equipment | |
| MarketCap: 101.08 Millions | |
| Recent Price: 0.67 Market Intelligence Score: 35 | |
| Day Percent Change: 1.11% Day Change: 0.01 | |
| Week Change: -2.57% Year-to-date Change: -43.5% | |
| VERO Links: Profile News Message Board | |
| Charts:- Daily , Weekly | |
| Add VERO to Watchlist: View: Get Complete VERO Trend Analysis ➞ | |
 | TRX Tanzanian Gold Corporation |
| Sector: Materials | |
| SubSector: Gold | |
| MarketCap: 95.9619 Millions | |
| Recent Price: 0.44 Market Intelligence Score: 51 | |
| Day Percent Change: 0.95% Day Change: 0.00 | |
| Week Change: -3.43% Year-to-date Change: 16.8% | |
| TRX Links: Profile News Message Board | |
| Charts:- Daily , Weekly | |
| Add TRX to Watchlist: View: Get Complete TRX Trend Analysis ➞ | |
 | SNDL Sundial Growers Inc. |
| Sector: Health Care | |
| SubSector: Drug Manufacturers - Other | |
| MarketCap: 94.4033 Millions | |
| Recent Price: 2.22 Market Intelligence Score: 95 | |
| Day Percent Change: -10.12% Day Change: -0.25 | |
| Week Change: 10.45% Year-to-date Change: 35.4% | |
| SNDL Links: Profile News Message Board | |
| Charts:- Daily , Weekly | |
| Add SNDL to Watchlist: View: Get Complete SNDL Trend Analysis ➞ | |
| To view more stocks, click on Next / Previous arrows or select different range: 0 - 25 , 25 - 50 , 50 - 75 , 75 - 100 , 100 - 125 , 125 - 150 | ||
| Click To Change The Sort Order: By Market Cap or Company Size Performance: Year-to-date, Week and Day | |
| Select Chart Type: | ||
 Best Stocks Today 12Stocks.com |
© 2024 12Stocks.com Terms & Conditions Privacy Contact Us
All Information Provided Only For Education And Not To Be Used For Investing or Trading. See Terms & Conditions


One More Thing ... Get Best Stocks Delivered Daily!
Never Ever Miss A Move With Our Top Ten Stocks Lists
Find Best Stocks In Any Market - Bull or Bear Market
Take A Peek At Our Top Ten Stocks Lists: Daily, Weekly, Year-to-Date & Top Trends
Find Best Stocks In Any Market - Bull or Bear Market
Take A Peek At Our Top Ten Stocks Lists: Daily, Weekly, Year-to-Date & Top Trends
Canada Stocks With Best Up Trends [0-bearish to 100-bullish]: Brookfield Renewable[100], Algonquin Power[100], CAE [100], City Office[100], New Gold[95], Mercer [95], Descartes Systems[93], Algonquin Power[85], Tilray [85], Cronos [83], Canopy Growth[83]
Best Canada Stocks Year-to-Date:
Aurora Cannabis[1445.57%], Canopy Growth[123.87%], Fusion [123.13%], D-Wave Quantum[60.7%], McEwen Mining[60.19%], Hudbay Minerals[50.91%], OrganiGram [46.18%], IAMGOLD [43.08%], Gold Royalty[39.79%], Endeavour Silver[35.53%], Cronos [29.67%] Best Canada Stocks This Week:
Canopy Growth[28.4%], Tilray [13.48%], Aurora Cannabis[9.85%], Brookfield Renewable[9.18%], Canadian Solar[7.92%], Zymeworks [6.05%], Aurinia [5.91%], Vision Marine[5.03%], Xenon [4.91%], Cronos [4.63%], New Gold[4.42%] Best Canada Stocks Daily:
Brookfield Renewable[10.90%], New Gold[8.62%], Repare [6.45%], NovaGold Resources[4.48%], Lion Electric[4.44%], Fortuna Silver[3.30%], Denison Mines[3.03%], Vision Marine[2.98%], D-Wave Quantum[2.92%], Cameco [2.83%], SilverCrest Metals[2.45%]