
 Login Sign Up


| |||||
 |  | ||||

| 12Stocks.com Market Intelligence |
Best Biotech Stocks
|
|
| Quick Read: Best Biotech Stocks List By Performances & Trends: Daily, Weekly, Year-to-Date, Market Cap (Size) & Technical Trends | |||
| Best Biotech Stocks Views: Quick Browse View, Summary & Slide Show View | |||
| 12Stocks.com Biotech Stocks Performances & Trends Daily | |||||||||
|
|  The overall market intelligence score is 60 (0-bearish to 100-bullish) which puts Biotech sector in short term neutral to bullish trend. The market intelligence score from previous trading session is 70 and a deterioration of trend continues.
| ||||||||
Here are the market intelligence trend scores of the most requested Biotech stocks at 12Stocks.com (click stock name for detailed review):
|


| 12Stocks.com: Investing in Biotech sector with Stocks | |
|
The following table helps investors and traders sort through current performance and trends (as measured by market intelligence score) of various
stocks in the Biotech sector. Quick View: Move mouse or cursor over stock symbol (ticker) to view short-term Technical chart and over stock name to view long term chart. Click on  to add stock symbol to your watchlist and to add stock symbol to your watchlist and  to view watchlist. Click on any ticker or stock name for detailed market intelligence report for that stock. to view watchlist. Click on any ticker or stock name for detailed market intelligence report for that stock. |
12Stocks.com Performance of Stocks in Biotech Sector
| Ticker | Stock Name | Watchlist | Category | Recent Price | Market Intelligence Score | Change % | YTD Change% |
| VTL | Vital Therapies |   | Biotechnology | 9.82 | 0 | -0.61% | 0.00% |
| BCLI | Brainstorm Cell | | Biotechnology | 0.65 | 60 | 0.03% | -69.85% |
| AGLE | Aeglea Bio | | Biotechnology | 27.60 | 60 | -0.29% | 0.00% |
| VBIV | VBI Vaccines | | Biotechnology | 56.81 | 70 | 0.28% | 0.00% |
| MEIP | MEI Pharma | | Biotechnology | 3.07 | 30 | 10.43% | 20.39% |
| LJPC | La Jolla | | Biotechnology | 6.22 | 30 | 0.00% | 0.00% |
| AGEN | Agenus | | Biotechnology | 4.55 | 40 | 1.79% | 47.25% |
| MOLN | Molecular Partners | | Biotechnology | 3.63 | 20 | -6.68% | -25.46% |
| CGEN | Compugen | | Biotechnology | 1.36 | 10 | -1.45% | -17.58% |
| OCX | OncoCyte | | Biotechnology | 3.16 | 50 | -1.25% | 35.62% |
| VXRT | Vaxart | | Biotechnology | 0.39 | 30 | -0.51% | -46.01% |
| GNLX | Genelux Corp | | Biotechnology | 3.91 | 53 | 2.38% | 45.76% |
| CFRX | ContraFect | | Biotechnology | 10.75 | 90 | 1.42% | 0.00% |
| MGNX | Macrogenics | | Biotechnology | 1.53 | 30 | 4.08% | -53.64% |
| ZNTL | Zentalis | | Biotechnology | 1.42 | 40 | 0.00% | -52.67% |
| SRRA | Sierra Oncology | | Biotechnology | 14.95 | 30 | 3.68% | 0.00% |
| OPHT | Ophthotech | | Biotechnology | 4.76 | 10 | -1.04% | 0.00% |
| SELB | Selecta | | Biotechnology | 2.70 | 60 | 0.00% | 0.00% |
| TYME | Tyme Technologies | | Biotechnology | 0.31 | 20 | 0.00% | 0.00% |
| OBSV | ObsEva SA | | Biotechnology | 0.08 | 20 | 1.20% | 0.00% |
| PLX | Protalix Bio | | Biotechnology | 1.87 | 100 | -2.09% | -5.08% |
| TARA | Protara | | Biotechnology | 3.03 | 0 | -1.30% | -45.70% |
| SPRO | Spero | | Biotechnology | 1.90 | 0 | 0.00% | 75.93% |
| CRBP | Corbus | | Biotechnology | 11.62 | 100 | 13.15% | -3.49% |
| ENOB | Enochian | | Biotechnology | 0.70 | 30 | 0.00% | 0.00% |
| To view more stocks, click on Next / Previous arrows or select different range: 0 - 25 , 25 - 50 , 50 - 75 , 75 - 100 , 100 - 125 , 125 - 150 , 150 - 175 , 175 - 200 , 200 - 225 , 225 - 250 , 250 - 275 , 275 - 300 , 300 - 325 , 325 - 350 , 350 - 375 , 375 - 400 , 400 - 425 , 425 - 450 , 450 - 475 | ||
 | Click To Change The Sort Order: By Market Cap or Company Size Performance: Year-to-date, Week and Day |  |
|
Get the most comprehensive stock market coverage daily at 12Stocks.com ➞ Best Stocks Today ➞ Best Stocks Weekly ➞ Best Stocks Year-to-Date ➞ Best Stocks Trends ➞  Best Stocks Today 12Stocks.com Best Nasdaq Stocks ➞ Best S&P 500 Stocks ➞ Best Tech Stocks ➞ Best Biotech Stocks ➞ |
| Detailed Overview of Biotech Stocks |
| Biotech Technical Overview, Leaders & Laggards, Top Biotech ETF Funds & Detailed Biotech Stocks List, Charts, Trends & More |
| Biotech Sector: Technical Analysis, Trends & YTD Performance | |
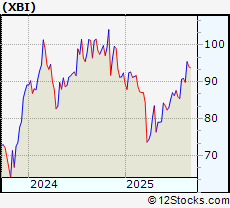
| Biotech sector, as represented by XBI, an exchange-traded fund [ETF] that holds basket of Biotech stocks (e.g, Amgen, Celgene) is up by 2.46251% and is currently underperforming the overall market by -10.68429% year-to-date. Below is a quick view of Technical charts and trends: | |
 XBI Weekly Chart |
|
| Long Term Trend: Very Good | |
| Medium Term Trend: Very Good | |
 XBI Daily Chart |
|
| Short Term Trend: Not Good | |
| Overall Trend Score: 60 | |
| YTD Performance: 2.46251% | |
| **Trend Scores & Views Are Only For Educational Purposes And Not For Investing | |
| 12Stocks.com: Top Performing Biotech Sector Stocks | ||||||||||||||||||||||||||||||||||||||||||||||
 The top performing Biotech sector stocks year to date are
Now, more recently, over last week, the top performing Biotech sector stocks on the move are


|
||||||||||||||||||||||||||||||||||||||||||||||
| 12Stocks.com: Investing in Biotech Sector using Exchange Traded Funds | |
|
The following table shows list of key exchange traded funds (ETF) that
help investors track Biotech Index. For detailed view, check out our ETF Funds section of our website. Quick View: Move mouse or cursor over ETF symbol (ticker) to view short-term Technical chart and over ETF name to view long term chart. Click on ticker or stock name for detailed view. Click on to add stock symbol to your watchlist and to view watchlist. |
12Stocks.com List of ETFs that track Biotech Index
| Ticker | ETF Name | Watchlist | Recent Price | Market Intelligence Score | Change % | Week % | Year-to-date % |
| UBIO | Biotechnology | | 73.34 | 80 | -0.0681292 | 260.748 | 0% |
| HCRF | Edge Multifactor | | 67.14 | 23 | 0 | 9999 | NA |
| SICK | Healthcare Bear 3X | | 37.90 | 36 | 0 | 9999 | NA |
| LABS | Biotech Bear 1X | | 24.18 | 56 | 0 | 9999 | NA |
| BTEC | Principal Healthcare Innovators | | 39.49 | 30 | 0 | 1.02328 | 0% |
| 12Stocks.com: Charts, Trends, Fundamental Data and Performances of Biotech Stocks | |
|
We now take in-depth look at all Biotech stocks including charts, multi-period performances and overall trends (as measured by market intelligence score). One can sort Biotech stocks (click link to choose) by Daily, Weekly and by Year-to-Date performances. Also, one can sort by size of the company or by market capitalization. |
| Select Your Default Chart Type: | |||||
| |||||
| Click on stock symbol or name for detailed view. Click on to add stock symbol to your watchlist and to view watchlist. Quick View: Move mouse or cursor over "Daily" to quickly view daily Technical stock chart and over "Weekly" to view weekly Technical stock chart. | |||||

 | VTL Vital Therapies, Inc. |
| Sector: Health Care | |
| SubSector: Biotechnology | |
| MarketCap: 142.97 Millions | |
| Recent Price: 9.82 Market Intelligence Score: 0 | |
| Day Percent Change: -0.607287% Day Change: -9999 | |
| Week Change: -51.697% Year-to-date Change: 0.0% | |
| VTL Links: Profile News Message Board | |
| Charts:- Daily , Weekly | |
| Add VTL to Watchlist: View: Get Complete VTL Trend Analysis ➞ | |
 | BCLI Brainstorm Cell Therapeutics Inc. |
| Sector: Health Care | |
| SubSector: Biotechnology | |
| MarketCap: 141.285 Millions | |
| Recent Price: 0.65 Market Intelligence Score: 60 | |
| Day Percent Change: 0.0310078% Day Change: -9999 | |
| Week Change: 1.6063% Year-to-date Change: -69.9% | |
| BCLI Links: Profile News Message Board | |
| Charts:- Daily , Weekly | |
| Add BCLI to Watchlist: View: Get Complete BCLI Trend Analysis ➞ | |
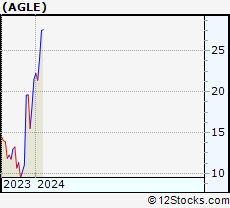 | AGLE Aeglea BioTherapeutics, Inc. |
| Sector: Health Care | |
| SubSector: Biotechnology | |
| MarketCap: 140.085 Millions | |
| Recent Price: 27.60 Market Intelligence Score: 60 | |
| Day Percent Change: -0.289017% Day Change: -9999 | |
| Week Change: 1.7324% Year-to-date Change: 0.0% | |
| AGLE Links: Profile News Message Board | |
| Charts:- Daily , Weekly | |
| Add AGLE to Watchlist: View: Get Complete AGLE Trend Analysis ➞ | |
 | VBIV VBI Vaccines Inc. |
| Sector: Health Care | |
| SubSector: Biotechnology | |
| MarketCap: 139.785 Millions | |
| Recent Price: 56.81 Market Intelligence Score: 70 | |
| Day Percent Change: 0.282436% Day Change: -9999 | |
| Week Change: 86898.5% Year-to-date Change: 0.0% | |
| VBIV Links: Profile News Message Board | |
| Charts:- Daily , Weekly | |
| Add VBIV to Watchlist: View: Get Complete VBIV Trend Analysis ➞ | |
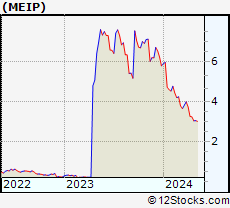 | MEIP MEI Pharma Inc |
| Sector: Health Care | |
| SubSector: Biotechnology | |
| MarketCap: 138.9 Millions | |
| Recent Price: 3.07 Market Intelligence Score: 30 | |
| Day Percent Change: 10.4317% Day Change: 0.03 | |
| Week Change: -36.701% Year-to-date Change: 20.4% | |
| MEIP Links: Profile News Message Board | |
| Charts:- Daily , Weekly | |
| Add MEIP to Watchlist: View: Get Complete MEIP Trend Analysis ➞ | |
 | LJPC La Jolla Pharmaceutical Company |
| Sector: Health Care | |
| SubSector: Biotechnology | |
| MarketCap: 138.185 Millions | |
| Recent Price: 6.22 Market Intelligence Score: 30 | |
| Day Percent Change: 0% Day Change: -9999 | |
| Week Change: 0% Year-to-date Change: 0.0% | |
| LJPC Links: Profile News Message Board | |
| Charts:- Daily , Weekly | |
| Add LJPC to Watchlist: View: Get Complete LJPC Trend Analysis ➞ | |
 | AGEN Agenus Inc |
| Sector: Health Care | |
| SubSector: Biotechnology | |
| MarketCap: 137.97 Millions | |
| Recent Price: 4.55 Market Intelligence Score: 40 | |
| Day Percent Change: 1.78971% Day Change: 0.06 | |
| Week Change: -10.2564% Year-to-date Change: 47.2% | |
| AGEN Links: Profile News Message Board | |
| Charts:- Daily , Weekly | |
| Add AGEN to Watchlist: View: Get Complete AGEN Trend Analysis ➞ | |
 | MOLN Molecular Partners AG ADR |
| Sector: Health Care | |
| SubSector: Biotechnology | |
| MarketCap: 133.86 Millions | |
| Recent Price: 3.63 Market Intelligence Score: 20 | |
| Day Percent Change: -6.6838% Day Change: 0.01 | |
| Week Change: 4.61095% Year-to-date Change: -25.5% | |
| MOLN Links: Profile News Message Board | |
| Charts:- Daily , Weekly | |
| Add MOLN to Watchlist: View: Get Complete MOLN Trend Analysis ➞ | |
 | CGEN Compugen Ltd |
| Sector: Health Care | |
| SubSector: Biotechnology | |
| MarketCap: 133.76 Millions | |
| Recent Price: 1.36 Market Intelligence Score: 10 | |
| Day Percent Change: -1.44928% Day Change: -0.01 | |
| Week Change: -4.8951% Year-to-date Change: -17.6% | |
| CGEN Links: Profile News Message Board | |
| Charts:- Daily , Weekly | |
| Add CGEN to Watchlist: View: Get Complete CGEN Trend Analysis ➞ | |
 | OCX OncoCyte Corporation |
| Sector: Health Care | |
| SubSector: Biotechnology | |
| MarketCap: 131.485 Millions | |
| Recent Price: 3.16 Market Intelligence Score: 50 | |
| Day Percent Change: -1.25% Day Change: -9999 | |
| Week Change: 14.7005% Year-to-date Change: 35.6% | |
| OCX Links: Profile News Message Board | |
| Charts:- Daily , Weekly | |
| Add OCX to Watchlist: View: Get Complete OCX Trend Analysis ➞ | |
 | VXRT Vaxart, Inc. |
| Sector: Health Care | |
| SubSector: Biotechnology | |
| MarketCap: 129.785 Millions | |
| Recent Price: 0.39 Market Intelligence Score: 30 | |
| Day Percent Change: -0.512821% Day Change: -0.01 | |
| Week Change: 4.77991% Year-to-date Change: -46.0% | |
| VXRT Links: Profile News Message Board | |
| Charts:- Daily , Weekly | |
| Add VXRT to Watchlist: View: Get Complete VXRT Trend Analysis ➞ | |
 | GNLX Genelux Corp |
| Sector: Health Care | |
| SubSector: Biotechnology | |
| MarketCap: 127.3 Millions | |
| Recent Price: 3.91 Market Intelligence Score: 53 | |
| Day Percent Change: 2.38% Day Change: 0.08 | |
| Week Change: 0.88% Year-to-date Change: 45.8% | |
| GNLX Links: Profile News Message Board | |
| Charts:- Daily , Weekly | |
| Add GNLX to Watchlist: View: Get Complete GNLX Trend Analysis ➞ | |
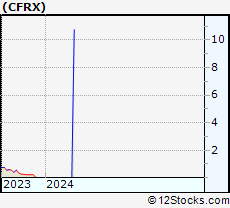 | CFRX ContraFect Corporation |
| Sector: Health Care | |
| SubSector: Biotechnology | |
| MarketCap: 126.685 Millions | |
| Recent Price: 10.75 Market Intelligence Score: 90 | |
| Day Percent Change: 1.41509% Day Change: -9999 | |
| Week Change: 47677.8% Year-to-date Change: 0.0% | |
| CFRX Links: Profile News Message Board | |
| Charts:- Daily , Weekly | |
| Add CFRX to Watchlist: View: Get Complete CFRX Trend Analysis ➞ | |
 | MGNX Macrogenics Inc |
| Sector: Health Care | |
| SubSector: Biotechnology | |
| MarketCap: 126.41 Millions | |
| Recent Price: 1.53 Market Intelligence Score: 30 | |
| Day Percent Change: 4.08163% Day Change: -0.05 | |
| Week Change: -11.5607% Year-to-date Change: -53.6% | |
| MGNX Links: Profile News Message Board | |
| Charts:- Daily , Weekly | |
| Add MGNX to Watchlist: View: Get Complete MGNX Trend Analysis ➞ | |
 | ZNTL Zentalis Pharmaceuticals Inc |
| Sector: Health Care | |
| SubSector: Biotechnology | |
| MarketCap: 126.24 Millions | |
| Recent Price: 1.42 Market Intelligence Score: 40 | |
| Day Percent Change: 0% Day Change: 0.23 | |
| Week Change: -11.25% Year-to-date Change: -52.7% | |
| ZNTL Links: Profile News Message Board | |
| Charts:- Daily , Weekly | |
| Add ZNTL to Watchlist: View: Get Complete ZNTL Trend Analysis ➞ | |
 | SRRA Sierra Oncology, Inc. |
| Sector: Health Care | |
| SubSector: Biotechnology | |
| MarketCap: 125.185 Millions | |
| Recent Price: 14.95 Market Intelligence Score: 30 | |
| Day Percent Change: 3.67545% Day Change: -9999 | |
| Week Change: -72.8132% Year-to-date Change: 0.0% | |
| SRRA Links: Profile News Message Board | |
| Charts:- Daily , Weekly | |
| Add SRRA to Watchlist: View: Get Complete SRRA Trend Analysis ➞ | |
 | OPHT Ophthotech Corporation |
| Sector: Health Care | |
| SubSector: Biotechnology | |
| MarketCap: 124.59 Millions | |
| Recent Price: 4.76 Market Intelligence Score: 10 | |
| Day Percent Change: -1.0395% Day Change: -9999 | |
| Week Change: -76.5863% Year-to-date Change: 0.0% | |
| OPHT Links: Profile News Message Board | |
| Charts:- Daily , Weekly | |
| Add OPHT to Watchlist: View: Get Complete OPHT Trend Analysis ➞ | |
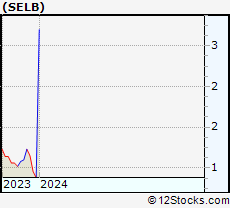 | SELB Selecta Biosciences, Inc. |
| Sector: Health Care | |
| SubSector: Biotechnology | |
| MarketCap: 123.885 Millions | |
| Recent Price: 2.70 Market Intelligence Score: 60 | |
| Day Percent Change: 0% Day Change: -9999 | |
| Week Change: 170% Year-to-date Change: 0.0% | |
| SELB Links: Profile News Message Board | |
| Charts:- Daily , Weekly | |
| Add SELB to Watchlist: View: Get Complete SELB Trend Analysis ➞ | |
 | TYME Tyme Technologies, Inc. |
| Sector: Health Care | |
| SubSector: Biotechnology | |
| MarketCap: 123.885 Millions | |
| Recent Price: 0.31 Market Intelligence Score: 20 | |
| Day Percent Change: 0% Day Change: -9999 | |
| Week Change: 0% Year-to-date Change: 0.0% | |
| TYME Links: Profile News Message Board | |
| Charts:- Daily , Weekly | |
| Add TYME to Watchlist: View: Get Complete TYME Trend Analysis ➞ | |
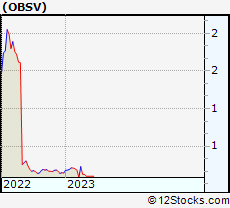 | OBSV ObsEva SA |
| Sector: Health Care | |
| SubSector: Biotechnology | |
| MarketCap: 123.585 Millions | |
| Recent Price: 0.08 Market Intelligence Score: 20 | |
| Day Percent Change: 1.20482% Day Change: -9999 | |
| Week Change: -8.79479% Year-to-date Change: 0.0% | |
| OBSV Links: Profile News Message Board | |
| Charts:- Daily , Weekly | |
| Add OBSV to Watchlist: View: Get Complete OBSV Trend Analysis ➞ | |
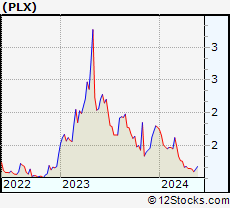 | PLX Protalix BioTherapeutics Inc |
| Sector: Health Care | |
| SubSector: Biotechnology | |
| MarketCap: 122.79 Millions | |
| Recent Price: 1.87 Market Intelligence Score: 100 | |
| Day Percent Change: -2.09424% Day Change: 0.01 | |
| Week Change: 19.1159% Year-to-date Change: -5.1% | |
| PLX Links: Profile News Message Board | |
| Charts:- Daily , Weekly | |
| Add PLX to Watchlist: View: Get Complete PLX Trend Analysis ➞ | |
 | TARA Protara Therapeutics Inc |
| Sector: Health Care | |
| SubSector: Biotechnology | |
| MarketCap: 121.53 Millions | |
| Recent Price: 3.03 Market Intelligence Score: 0 | |
| Day Percent Change: -1.30293% Day Change: 0.07 | |
| Week Change: -2.57235% Year-to-date Change: -45.7% | |
| TARA Links: Profile News Message Board | |
| Charts:- Daily , Weekly | |
| Add TARA to Watchlist: View: Get Complete TARA Trend Analysis ➞ | |
 | SPRO Spero Therapeutics Inc |
| Sector: Health Care | |
| SubSector: Biotechnology | |
| MarketCap: 120.99 Millions | |
| Recent Price: 1.90 Market Intelligence Score: 0 | |
| Day Percent Change: 0% Day Change: 0.03 | |
| Week Change: -4.0404% Year-to-date Change: 75.9% | |
| SPRO Links: Profile News Message Board | |
| Charts:- Daily , Weekly | |
| Add SPRO to Watchlist: View: Get Complete SPRO Trend Analysis ➞ | |
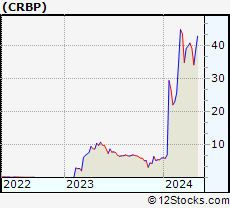 | CRBP Corbus Pharmaceuticals Holdings Inc |
| Sector: Health Care | |
| SubSector: Biotechnology | |
| MarketCap: 120.84 Millions | |
| Recent Price: 11.62 Market Intelligence Score: 100 | |
| Day Percent Change: 13.1451% Day Change: 0.48 | |
| Week Change: 21.9307% Year-to-date Change: -3.5% | |
| CRBP Links: Profile News Message Board | |
| Charts:- Daily , Weekly | |
| Add CRBP to Watchlist: View: Get Complete CRBP Trend Analysis ➞ | |
 | ENOB Enochian Biosciences Inc. |
| Sector: Health Care | |
| SubSector: Biotechnology | |
| MarketCap: 120.685 Millions | |
| Recent Price: 0.70 Market Intelligence Score: 30 | |
| Day Percent Change: 0% Day Change: -9999 | |
| Week Change: 0% Year-to-date Change: 0.0% | |
| ENOB Links: Profile News Message Board | |
| Charts:- Daily , Weekly | |
| Add ENOB to Watchlist: View: Get Complete ENOB Trend Analysis ➞ | |
| To view more stocks, click on Next / Previous arrows or select different range: 0 - 25 , 25 - 50 , 50 - 75 , 75 - 100 , 100 - 125 , 125 - 150 , 150 - 175 , 175 - 200 , 200 - 225 , 225 - 250 , 250 - 275 , 275 - 300 , 300 - 325 , 325 - 350 , 350 - 375 , 375 - 400 , 400 - 425 , 425 - 450 , 450 - 475 | ||
| Click To Change The Sort Order: By Market Cap or Company Size Performance: Year-to-date, Week and Day | |
| Select Chart Type: | ||
|
Best Stocks Today 12Stocks.com |
© 2025 12Stocks.com Terms & Conditions Privacy Contact Us
All Information Provided Only For Education And Not To Be Used For Investing or Trading. See Terms & Conditions


One More Thing ... Get Best Stocks Delivered Daily!
Never Ever Miss A Move With Our Top Ten Stocks Lists
Find Best Stocks In Any Market - Bull or Bear Market
Take A Peek At Our Top Ten Stocks Lists: Daily, Weekly, Year-to-Date & Top Trends
Find Best Stocks In Any Market - Bull or Bear Market
Take A Peek At Our Top Ten Stocks Lists: Daily, Weekly, Year-to-Date & Top Trends
Biotech Stocks With Best Up Trends [0-bearish to 100-bullish]: AlloVir [100], Monopar [100], Cara [100], Corbus [100], Spruce [100], Ocugen [100], Roivant [100], Xencor [100], Oncolytics [100], Tango [100], Arcus [100]
Best Biotech Stocks Year-to-Date:
Kaleido [9900%], Celcuity [315.842%], I-Mab ADR[307.285%], Galectin [292.308%], Immuneering Corp[265.158%], Nektar [254.284%], Precigen [253.704%], Nanobiotix ADR[251.814%], Gossamer Bio[208.247%], DBV Technologies[202.769%], Monopar [199.91%] Best Biotech Stocks This Week:
Athersys [193287%], VBI Vaccines[86898.5%], ContraFect [47677.8%], Clovis Oncology[39610.5%], NanoString Technologies[17224.7%], Neptune Wellness[14100%], Achillion [10033.3%], Kaleido [9900%], Nymox [8258.49%], Epizyme [5739.46%], Portola [4717.55%] Best Biotech Stocks Daily:
Kaleido [9900%], Neoleukin [332.665%], Syros [226.23%], Athenex [103.333%], Aptose [17.5439%], AlloVir [16.9215%], Monopar [16.9123%], Cara [14.3396%], Tyra [14.26%], Zura Bio[13.71%], Corbus [13.1451%]