
 Login Sign Up


| |||||
 |  | ||||

| 12Stocks.com Market Intelligence |
Best Asia Stocks
|
|
| Quick Read: Top Asia Stocks By Performances & Trends: Daily, Weekly, Year-to-Date, Market Cap (Size) & Technical Trends | |||
| Best Asia Views: Quick Browse View, Summary & Slide Show | |||
| 12Stocks.com Asia Stocks Performances & Trends Daily | |||||||||
|
|  The overall market intelligence score is 100 (0-bearish to 100-bullish) which puts Asia index in short term bullish trend. The market intelligence score from previous trading session is 90 and an improvement of trend continues.
| ||||||||
Here are the market intelligence trend scores of the most requested Asia stocks at 12Stocks.com (click stock name for detailed review):
|


| Consider signing up for our daily 12Stocks.com "Best Stocks Newsletter". You will never ever miss a big stock move again! |
| 12Stocks.com: Top Performing Asia Index Stocks | |||||||||||||||||||||||||||||||||||||||||||||||
 The top performing Asia Index stocks year to date are
Now, more recently, over last week, the top performing Asia Index stocks on the move are


|
|||||||||||||||||||||||||||||||||||||||||||||||
| 12Stocks.com: Investing in Asia Index with Stocks | |
|
The following table helps investors and traders sort through current performance and trends (as measured by market intelligence score) of various
stocks in the Asia Index. Quick View: Move mouse or cursor over stock symbol (ticker) to view short-term technical chart and over stock name to view long term chart. Click on  to add stock symbol to your watchlist and to add stock symbol to your watchlist and  to view watchlist. Click on any ticker or stock name for detailed market intelligence report for that stock. to view watchlist. Click on any ticker or stock name for detailed market intelligence report for that stock. |
12Stocks.com Performance of Stocks in Asia Index
| Ticker | Stock Name | Watchlist | Category | Recent Price | Market Intelligence Score | Change % | YTD Change% |
| PHH | Park Ha |   | Consumer Staples | 0.48 | 30 | 2.60% | -89.64% |
| GURE | Gulf Resources | | Materials | 0.70 | 30 | 2.47% | 17.47% |
| CIFS | China Internet | | Financials | 6.07 | 30 | 2.36% | 0.00% |
| SKYS | Sky Solar | | Utilities | 7.52 | 30 | 1.62% | 0.00% |
| GSH | Guangshen Railway | | Transports | 283.85 | 30 | 1.27% | 0.00% |
| YGMZ | MingZhu Logistics | | Industrials | 0.77 | 30 | 1.09% | -12.60% |
| PTI | Proteostasis | | Health Care | 18.73 | 30 | 0.48% | 0.00% |
| AIHS | Senmiao | | Industrials | 2.14 | 30 | 0.47% | -78.60% |
| DL | China Distance | | Services & Goods | 12.61 | 30 | 0.24% | 0.00% |
| UCL | Ucloudlink | | Technology | 2.57 | 30 | 0.19% | 47.70% |
| RNW | ReNew Energy | | Utilities | 7.62 | 30 | 0.13% | 12.06% |
| VDTH | Videocon d2h | | Services & Goods | 11.08 | 30 | 0.00% | 0.00% |
| QTT | Qutoutiao | | Technology | 0.18 | 30 | 0.00% | 0.00% |
| NEWA | Newater | | Industrials | 4.17 | 30 | 0.00% | 0.00% |
| CTEK | CynergisTek | | Technology | 1.25 | 30 | 0.00% | 0.00% |
| LN | LINE | | Technology | 20.80 | 30 | -0.29% | 0.00% |
| LU | Lufax Holding | | Financials | 3.01 | 30 | -0.33% | 25.94% |
| ATIF | ATIF | | Financials | 1.07 | 30 | -0.47% | -23.75% |
| INFY | Infosys | | Technology | 16.96 | 30 | -0.64% | -23.96% |
| HIMX | Himax | | Technology | 8.27 | 30 | -0.72% | 15.07% |
| SY | So-Young | | Health Care | 3.77 | 30 | -1.05% | 375.53% |
| SGOC | SGOCO | | Technology | 4.39 | 30 | -1.13% | 0.00% |
| CASI | CASI | | Health Care | 2.28 | 30 | -2.15% | -23.49% |
| IH | iHuman | | Consumer Staples | 2.86 | 30 | -2.96% | 77.38% |
| CREG | Smart Powerr | | Utilities | 1.54 | 30 | -3.14% | -78.61% |
| To view more stocks, click on Next / Previous arrows or select different range: 0 - 25 , 25 - 50 , 50 - 75 , 75 - 100 , 100 - 125 , 125 - 150 , 150 - 175 , 175 - 200 , 200 - 225 , 225 - 250 , 250 - 275 , 275 - 300 , 300 - 325 , 325 - 350 | ||
 | Click To Change The Sort Order: By Market Cap or Company Size Performance: Year-to-date, Week and Day |  |
|
Get the most comprehensive stock market coverage daily at 12Stocks.com ➞ Best Stocks Today ➞ Best Stocks Weekly ➞ Best Stocks Year-to-Date ➞ Best Stocks Trends ➞  Best Stocks Today 12Stocks.com Best Nasdaq Stocks ➞ Best S&P 500 Stocks ➞ Best Tech Stocks ➞ Best Biotech Stocks ➞ |
| Detailed Overview of Asia Stocks |
| Asia Technical Overview, Leaders & Laggards, Top Asia ETF Funds & Detailed Asia Stocks List, Charts, Trends & More |
| Asia: Technical Analysis, Trends & YTD Performance | |
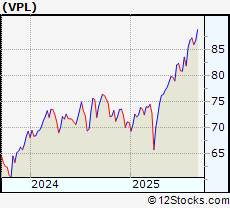
 VPL Weekly Chart |
|
| Long Term Trend: Very Good | |
| Medium Term Trend: Good | |
 VPL Daily Chart |
|
| Short Term Trend: Very Good | |
| Overall Trend Score: 100 | |
| YTD Performance: 26.1881% | |
| **Trend Scores & Views Are Only For Educational Purposes And Not For Investing | |
| 12Stocks.com: Investing in Asia Index using Exchange Traded Funds | |
|
The following table shows list of key exchange traded funds (ETF) that
help investors play Asia stock market. For detailed view, check out our ETF Funds section of our website. Quick View: Move mouse or cursor over ETF symbol (ticker) to view short-term technical chart and over ETF name to view long term chart. Click on ticker or stock name for detailed view. Click on to add stock symbol to your watchlist and to view watchlist. |
12Stocks.com List of ETFs that track Asia Index
| Ticker | ETF Name | Watchlist | Recent Price | Market Intelligence Score | Change % | Week % | Year-to-date % |
| AYT | GEMS Asia 8 | | 4.23 | 0 | 0.475059 | -79.1933 | 0% |
| ALD | Asia Local Debt | | 31.68 | 70 | -0.0946074 | 6.30872 | 0% |
| ADRA | Asia 50 ADR | | 3.29 | 50 | 9.66667 | 2.49221 | 0% |
| INP | India ETN | | 52.85 | 70 | 0.132626 | 7.6594 | 0% |
| 12Stocks.com: Charts, Trends, Fundamental Data and Performances of Asia Stocks | |
|
We now take in-depth look at all Asia stocks including charts, multi-period performances and overall trends (as measured by market intelligence score). One can sort Asia stocks (click link to choose) by Daily, Weekly and by Year-to-Date performances. Also, one can sort by size of the company or by market capitalization. |
| Select Your Default Chart Type: | |||||
| |||||
| Click on stock symbol or name for detailed view. Click on to add stock symbol to your watchlist and to view watchlist. Quick View: Move mouse or cursor over "Daily" to quickly view daily technical stock chart and over "Weekly" to view weekly technical stock chart. | |||||

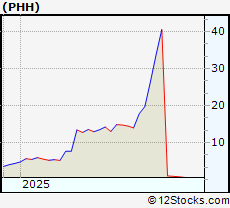 | PHH Park Ha Biological Technology Co Ltd |
| Sector: Consumer Staples | |
| SubSector: Household & Personal Products | |
| MarketCap: 11.58 Millions | |
| Recent Price: 0.48 Market Intelligence Score: 30 | |
| Day Percent Change: 2.60439% Day Change: 0.01 | |
| Week Change: 6.88341% Year-to-date Change: -89.6% | |
| PHH Links: Profile News Message Board | |
| Charts:- Daily , Weekly | |
| Add PHH to Watchlist: View: Get Complete PHH Trend Analysis ➞ | |
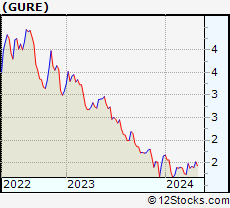 | GURE Gulf Resources Inc |
| Sector: Materials | |
| SubSector: Chemicals | |
| MarketCap: 10.01 Millions | |
| Recent Price: 0.70 Market Intelligence Score: 30 | |
| Day Percent Change: 2.47402% Day Change: -0.02 | |
| Week Change: -1.40845% Year-to-date Change: 17.5% | |
| GURE Links: Profile News Message Board | |
| Charts:- Daily , Weekly | |
| Add GURE to Watchlist: View: Get Complete GURE Trend Analysis ➞ | |
 | CIFS China Internet Nationwide Financial Services Inc. |
| Sector: Financials | |
| SubSector: Credit Services | |
| MarketCap: 12.2208 Millions | |
| Recent Price: 6.07 Market Intelligence Score: 30 | |
| Day Percent Change: 2.36088% Day Change: -9999 | |
| Week Change: -22.5765% Year-to-date Change: 0.0% | |
| CIFS Links: Profile News Message Board | |
| Charts:- Daily , Weekly | |
| Add CIFS to Watchlist: View: Get Complete CIFS Trend Analysis ➞ | |
 | SKYS Sky Solar Holdings, Ltd. |
| Sector: Utilities | |
| SubSector: Diversified Utilities | |
| MarketCap: 30.668 Millions | |
| Recent Price: 7.52 Market Intelligence Score: 30 | |
| Day Percent Change: 1.62162% Day Change: -9999 | |
| Week Change: -8.84848% Year-to-date Change: 0.0% | |
| SKYS Links: Profile News Message Board | |
| Charts:- Daily , Weekly | |
| Add SKYS to Watchlist: View: Get Complete SKYS Trend Analysis ➞ | |
 | GSH Guangshen Railway Company Limited |
| Sector: Transports | |
| SubSector: Railroads | |
| MarketCap: 2283.52 Millions | |
| Recent Price: 283.85 Market Intelligence Score: 30 | |
| Day Percent Change: 1.27373% Day Change: -9999 | |
| Week Change: -6.83057% Year-to-date Change: 0.0% | |
| GSH Links: Profile News Message Board | |
| Charts:- Daily , Weekly | |
| Add GSH to Watchlist: View: Get Complete GSH Trend Analysis ➞ | |
 | YGMZ MingZhu Logistics Holdings Ltd |
| Sector: Industrials | |
| SubSector: Trucking | |
| MarketCap: 81.28 Millions | |
| Recent Price: 0.77 Market Intelligence Score: 30 | |
| Day Percent Change: 1.08967% Day Change: 0.02 | |
| Week Change: -8.92963% Year-to-date Change: -12.6% | |
| YGMZ Links: Profile News Message Board | |
| Charts:- Daily , Weekly | |
| Add YGMZ to Watchlist: View: Get Complete YGMZ Trend Analysis ➞ | |
 | PTI Proteostasis Therapeutics, Inc. |
| Sector: Health Care | |
| SubSector: Biotechnology | |
| MarketCap: 79.8785 Millions | |
| Recent Price: 18.73 Market Intelligence Score: 30 | |
| Day Percent Change: 0.482833% Day Change: -9999 | |
| Week Change: -60.7913% Year-to-date Change: 0.0% | |
| PTI Links: Profile News Message Board | |
| Charts:- Daily , Weekly | |
| Add PTI to Watchlist: View: Get Complete PTI Trend Analysis ➞ | |
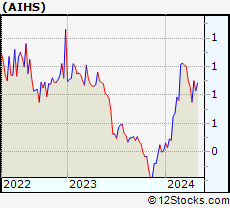 | AIHS Senmiao Technology Ltd |
| Sector: Industrials | |
| SubSector: Rental & Leasing Services | |
| MarketCap: 2.64 Millions | |
| Recent Price: 2.14 Market Intelligence Score: 30 | |
| Day Percent Change: 0.469484% Day Change: 0.1 | |
| Week Change: -32.0635% Year-to-date Change: -78.6% | |
| AIHS Links: Profile News Message Board | |
| Charts:- Daily , Weekly | |
| Add AIHS to Watchlist: View: Get Complete AIHS Trend Analysis ➞ | |
 | DL China Distance Education Holdings Limited |
| Sector: Services & Goods | |
| SubSector: Education & Training Services | |
| MarketCap: 257.606 Millions | |
| Recent Price: 12.61 Market Intelligence Score: 30 | |
| Day Percent Change: 0.238474% Day Change: -9999 | |
| Week Change: -36.6013% Year-to-date Change: 0.0% | |
| DL Links: Profile News Message Board | |
| Charts:- Daily , Weekly | |
| Add DL to Watchlist: View: Get Complete DL Trend Analysis ➞ | |
 | UCL Ucloudlink Group Inc ADR |
| Sector: Technology | |
| SubSector: Telecom Services | |
| MarketCap: 76.26 Millions | |
| Recent Price: 2.57 Market Intelligence Score: 30 | |
| Day Percent Change: 0.194932% Day Change: -0.03 | |
| Week Change: -22.8228% Year-to-date Change: 47.7% | |
| UCL Links: Profile News Message Board | |
| Charts:- Daily , Weekly | |
| Add UCL to Watchlist: View: Get Complete UCL Trend Analysis ➞ | |
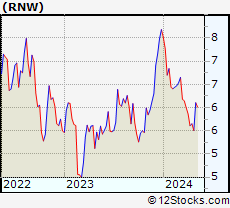 | RNW ReNew Energy Global plc |
| Sector: Utilities | |
| SubSector: Utilities - Renewable | |
| MarketCap: 2829.6 Millions | |
| Recent Price: 7.62 Market Intelligence Score: 30 | |
| Day Percent Change: 0.131406% Day Change: -0.04 | |
| Week Change: -0.26178% Year-to-date Change: 12.1% | |
| RNW Links: Profile News Message Board | |
| Charts:- Daily , Weekly | |
| Add RNW to Watchlist: View: Get Complete RNW Trend Analysis ➞ | |
 | VDTH Videocon d2h Limited |
| Sector: Services & Goods | |
| SubSector: CATV Systems | |
| MarketCap: 1099.81 Millions | |
| Recent Price: 11.08 Market Intelligence Score: 30 | |
| Day Percent Change: 0% Day Change: -9999 | |
| Week Change: 13.9918% Year-to-date Change: 0.0% | |
| VDTH Links: Profile News Message Board | |
| Charts:- Daily , Weekly | |
| Add VDTH to Watchlist: View: Get Complete VDTH Trend Analysis ➞ | |
 | QTT Qutoutiao Inc. |
| Sector: Technology | |
| SubSector: Internet Information Providers | |
| MarketCap: 956.98 Millions | |
| Recent Price: 0.18 Market Intelligence Score: 30 | |
| Day Percent Change: 0% Day Change: -9999 | |
| Week Change: 0% Year-to-date Change: 0.0% | |
| QTT Links: Profile News Message Board | |
| Charts:- Daily , Weekly | |
| Add QTT to Watchlist: View: Get Complete QTT Trend Analysis ➞ | |
 | NEWA Newater Technology, Inc. |
| Sector: Industrials | |
| SubSector: Waste Management | |
| MarketCap: 21.0988 Millions | |
| Recent Price: 4.17 Market Intelligence Score: 30 | |
| Day Percent Change: 0% Day Change: -9999 | |
| Week Change: 0% Year-to-date Change: 0.0% | |
| NEWA Links: Profile News Message Board | |
| Charts:- Daily , Weekly | |
| Add NEWA to Watchlist: View: Get Complete NEWA Trend Analysis ➞ | |
 | CTEK CynergisTek, Inc. |
| Sector: Technology | |
| SubSector: Information Technology Services | |
| MarketCap: 16.1468 Millions | |
| Recent Price: 1.25 Market Intelligence Score: 30 | |
| Day Percent Change: 0% Day Change: -9999 | |
| Week Change: 0% Year-to-date Change: 0.0% | |
| CTEK Links: Profile News Message Board | |
| Charts:- Daily , Weekly | |
| Add CTEK to Watchlist: View: Get Complete CTEK Trend Analysis ➞ | |
 | LN LINE Corporation |
| Sector: Technology | |
| SubSector: Application Software | |
| MarketCap: 11338.1 Millions | |
| Recent Price: 20.80 Market Intelligence Score: 30 | |
| Day Percent Change: -0.287632% Day Change: -9999 | |
| Week Change: 23.7359% Year-to-date Change: 0.0% | |
| LN Links: Profile News Message Board | |
| Charts:- Daily , Weekly | |
| Add LN to Watchlist: View: Get Complete LN Trend Analysis ➞ | |
 | LU Lufax Holding Ltd ADR |
| Sector: Financials | |
| SubSector: Credit Services | |
| MarketCap: 2522.68 Millions | |
| Recent Price: 3.01 Market Intelligence Score: 30 | |
| Day Percent Change: -0.331126% Day Change: 0.15 | |
| Week Change: -1.9544% Year-to-date Change: 25.9% | |
| LU Links: Profile News Message Board | |
| Charts:- Daily , Weekly | |
| Add LU to Watchlist: View: Get Complete LU Trend Analysis ➞ | |
 | ATIF ATIF Holdings Limited |
| Sector: Financials | |
| SubSector: Asset Management | |
| MarketCap: 68.5203 Millions | |
| Recent Price: 1.07 Market Intelligence Score: 30 | |
| Day Percent Change: -0.465116% Day Change: -9999 | |
| Week Change: 7% Year-to-date Change: -23.7% | |
| ATIF Links: Profile News Message Board | |
| Charts:- Daily , Weekly | |
| Add ATIF to Watchlist: View: Get Complete ATIF Trend Analysis ➞ | |
 | INFY Infosys Ltd ADR |
| Sector: Technology | |
| SubSector: Information Technology Services | |
| MarketCap: 68048.6 Millions | |
| Recent Price: 16.96 Market Intelligence Score: 30 | |
| Day Percent Change: -0.644405% Day Change: -0.07 | |
| Week Change: 2.23026% Year-to-date Change: -24.0% | |
| INFY Links: Profile News Message Board | |
| Charts:- Daily , Weekly | |
| Add INFY to Watchlist: View: Get Complete INFY Trend Analysis ➞ | |
 | HIMX Himax Technologies ADR |
| Sector: Technology | |
| SubSector: Semiconductors | |
| MarketCap: 1464.06 Millions | |
| Recent Price: 8.27 Market Intelligence Score: 30 | |
| Day Percent Change: -0.720288% Day Change: 0.01 | |
| Week Change: -0.600962% Year-to-date Change: 15.1% | |
| HIMX Links: Profile News Message Board | |
| Charts:- Daily , Weekly | |
| Add HIMX to Watchlist: View: Get Complete HIMX Trend Analysis ➞ | |
 | SY So-Young International Inc ADR |
| Sector: Health Care | |
| SubSector: Health Information Services | |
| MarketCap: 371.46 Millions | |
| Recent Price: 3.77 Market Intelligence Score: 30 | |
| Day Percent Change: -1.04987% Day Change: -0.17 | |
| Week Change: 8.95954% Year-to-date Change: 375.5% | |
| SY Links: Profile News Message Board | |
| Charts:- Daily , Weekly | |
| Add SY to Watchlist: View: Get Complete SY Trend Analysis ➞ | |
 | SGOC SGOCO Group, Ltd. |
| Sector: Technology | |
| SubSector: Electronic Equipment | |
| MarketCap: 73.47 Millions | |
| Recent Price: 4.39 Market Intelligence Score: 30 | |
| Day Percent Change: -1.12613% Day Change: -9999 | |
| Week Change: -2.00893% Year-to-date Change: 0.0% | |
| SGOC Links: Profile News Message Board | |
| Charts:- Daily , Weekly | |
| Add SGOC to Watchlist: View: Get Complete SGOC Trend Analysis ➞ | |
 | CASI CASI Pharmaceuticals Inc |
| Sector: Health Care | |
| SubSector: Biotechnology | |
| MarketCap: 36.25 Millions | |
| Recent Price: 2.28 Market Intelligence Score: 30 | |
| Day Percent Change: -2.14592% Day Change: 0.19 | |
| Week Change: 0% Year-to-date Change: -23.5% | |
| CASI Links: Profile News Message Board | |
| Charts:- Daily , Weekly | |
| Add CASI to Watchlist: View: Get Complete CASI Trend Analysis ➞ | |
 | IH iHuman Inc ADR |
| Sector: Consumer Staples | |
| SubSector: Education & Training Services | |
| MarketCap: 62.25 Millions | |
| Recent Price: 2.86 Market Intelligence Score: 30 | |
| Day Percent Change: -2.96203% Day Change: 0.1 | |
| Week Change: 4.7619% Year-to-date Change: 77.4% | |
| IH Links: Profile News Message Board | |
| Charts:- Daily , Weekly | |
| Add IH to Watchlist: View: Get Complete IH Trend Analysis ➞ | |
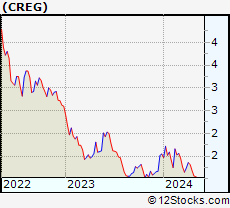 | CREG Smart Powerr Corp |
| Sector: Utilities | |
| SubSector: Utilities - Renewable | |
| MarketCap: 4.28 Millions | |
| Recent Price: 1.54 Market Intelligence Score: 30 | |
| Day Percent Change: -3.14465% Day Change: -0.08 | |
| Week Change: 14.9254% Year-to-date Change: -78.6% | |
| CREG Links: Profile News Message Board | |
| Charts:- Daily , Weekly | |
| Add CREG to Watchlist: View: Get Complete CREG Trend Analysis ➞ | |
| To view more stocks, click on Next / Previous arrows or select different range: 0 - 25 , 25 - 50 , 50 - 75 , 75 - 100 , 100 - 125 , 125 - 150 , 150 - 175 , 175 - 200 , 200 - 225 , 225 - 250 , 250 - 275 , 275 - 300 , 300 - 325 , 325 - 350 | ||
| Click To Change The Sort Order: By Market Cap or Company Size Performance: Year-to-date, Week and Day | |
| Select Chart Type: | ||
|
Best Stocks Today 12Stocks.com |
© 2025 12Stocks.com Terms & Conditions Privacy Contact Us
All Information Provided Only For Education And Not To Be Used For Investing or Trading. See Terms & Conditions


One More Thing ... Get Best Stocks Delivered Daily!
Never Ever Miss A Move With Our Top Ten Stocks Lists
Find Best Stocks In Any Market - Bull or Bear Market
Take A Peek At Our Top Ten Stocks Lists: Daily, Weekly, Year-to-Date & Top Trends
Find Best Stocks In Any Market - Bull or Bear Market
Take A Peek At Our Top Ten Stocks Lists: Daily, Weekly, Year-to-Date & Top Trends
Asia Stocks With Best Up Trends [0-bearish to 100-bullish]: Sony [100], Baozun [100], VNET [100], Baidu [100], NetEase [100], China [100], Ctrip.com [100], SINA [100], Hollysys Automation[100], Vipshop [100], Taiwan Semiconductor[100]
Best Asia Stocks Year-to-Date:
Regencell Bioscience[11493.1%], So-Young [375.53%], Sify [281.373%], QuantaSing [269.91%], Xunlei [259.524%], Oneconnect Financial[196.708%], Yatsen Holding[165.104%], Niu [132.759%], Masterbeef [128.049%], Tencent Music[120.848%], HUYA [104.307%] Best Asia Stocks This Week:
CNOOC [137266%], Nam Tai[5033.33%], Fang [4150%], Sinopec Shanghai[1992.58%], PetroChina [1137.09%], China [1104.2%], Internet Initiative[913.355%], China Life[690.958%], Leju [539.091%], Aluminum [516.255%], Global Cord[335.132%] Best Asia Stocks Daily:
Sony [194.565%], China SXT[15.1163%], HUTCHMED (China)[9.52963%], Regencell Bioscience[9.29368%], Perfect Corp[8.33333%], Jianpu [7.78054%], Baozun [6.95067%], JinkoSolar Holding[6.31356%], VNET [5.0494%], Bilibili [4.08998%], QuantaSing [3.9%]