
 Login Sign Up


| |||||
 |  | ||||

| 12Stocks.com Market Intelligence |
Best Asia Stocks
|
|
| Quick Read: Top Asia Stocks By Performances & Trends: Daily, Weekly, Year-to-Date, Market Cap (Size) & Technical Trends | |||
| Best Asia Views: Quick Browse View, Summary & Slide Show | |||
| 12Stocks.com Asia Stocks Performances & Trends Daily | |||||||||
|
|  The overall market intelligence score is 100 (0-bearish to 100-bullish) which puts Asia index in short term bullish trend. The market intelligence score from previous trading session is 90 and an improvement of trend continues.
| ||||||||
Here are the market intelligence trend scores of the most requested Asia stocks at 12Stocks.com (click stock name for detailed review):
|


| Consider signing up for our daily 12Stocks.com "Best Stocks Newsletter". You will never ever miss a big stock move again! |
| 12Stocks.com: Top Performing Asia Index Stocks | |||||||||||||||||||||||||||||||||||||||||||||||
 The top performing Asia Index stocks year to date are
Now, more recently, over last week, the top performing Asia Index stocks on the move are


|
|||||||||||||||||||||||||||||||||||||||||||||||
| 12Stocks.com: Investing in Asia Index with Stocks | |
|
The following table helps investors and traders sort through current performance and trends (as measured by market intelligence score) of various
stocks in the Asia Index. Quick View: Move mouse or cursor over stock symbol (ticker) to view short-term technical chart and over stock name to view long term chart. Click on  to add stock symbol to your watchlist and to add stock symbol to your watchlist and  to view watchlist. Click on any ticker or stock name for detailed market intelligence report for that stock. to view watchlist. Click on any ticker or stock name for detailed market intelligence report for that stock. |
12Stocks.com Performance of Stocks in Asia Index
| Ticker | Stock Name | Watchlist | Category | Recent Price | Market Intelligence Score | Change % | YTD Change% |
| SGOC | SGOCO |   | Technology | 4.39 | 30 | -1.13% | 0.00% |
| CXDC | China XD | | Consumer Staples | 0.91 | 10 | 0.00% | 0.00% |
| ATIF | ATIF | | Financials | 1.07 | 30 | -0.47% | -23.75% |
| CMCM | Cheetah Mobile | | Technology | 8.21 | 100 | -6.17% | 78.48% |
| DSWL | Deswell Industries | | Technology | 4.15 | 60 | -0.48% | 79.82% |
| SORL | SORL Auto | | Consumer Staples | 0.49 | 10 | -2.00% | 0.00% |
| AACG | ATA Creativity | | Consumer Staples | 2.13 | 70 | 0.47% | 142.05% |
| GMM | Global Mofy | | Technology | 1.92 | 10 | -14.29% | -49.93% |
| IH | iHuman | | Consumer Staples | 2.86 | 30 | -2.96% | 77.38% |
| RCON | Recon | | Energy | 2.21 | 50 | 0.68% | 2.79% |
| CJJD | China Jo-Jo | | Services & Goods | 1.44 | 10 | -5.26% | -21.31% |
| HPJ | Highpower | | Industrials | 2.46 | 20 | 1.23% | 0.00% |
| ICG | Intchains | | Technology | 1.86 | 46 | -2.00% | -40.61% |
| NHTC | Natural Health | | Services & Goods | 4.40 | 50 | 0.46% | 8.51% |
| JG | Aurora Mobile | | Technology | 10.04 | 40 | -1.08% | 46.58% |
| STG | Sunlands | | Consumer Staples | 8.82 | 50 | 1.97% | 63.33% |
| CCIH | ChinaCache | | Technology | 2.09 | 40 | -0.48% | 0.00% |
| YGE | Yingli Green | | Technology | 1.51 | 70 | 0.67% | 0.00% |
| WIMI | Wimi Hologram | | Technology | 4.46 | 100 | 1.59% | -73.45% |
| JP | Jupai | | Financials | 11.96 | 80 | -2.29% | 0.00% |
| APWC | Asia Pacific | | Industrials | 2.06 | 100 | 11.32% | 47.50% |
| CASI | CASI | | Health Care | 2.28 | 30 | -2.15% | -23.49% |
| FEDU | Four Seasons | | Consumer Staples | 13.64 | 20 | -4.74% | 31.15% |
| MDJH | MDJM | | Financials | 0.24 | 90 | 83.08% | -6.74% |
| CNF | CNFinance | | Financials | 3.05 | 80 | -5.86% | 193.27% |
| To view more stocks, click on Next / Previous arrows or select different range: 0 - 25 , 25 - 50 , 50 - 75 , 75 - 100 , 100 - 125 , 125 - 150 , 150 - 175 , 175 - 200 , 200 - 225 , 225 - 250 , 250 - 275 , 275 - 300 , 300 - 325 , 325 - 350 | ||
 | Click To Change The Sort Order: By Market Cap or Company Size Performance: Year-to-date, Week and Day |  |
|
Get the most comprehensive stock market coverage daily at 12Stocks.com ➞ Best Stocks Today ➞ Best Stocks Weekly ➞ Best Stocks Year-to-Date ➞ Best Stocks Trends ➞  Best Stocks Today 12Stocks.com Best Nasdaq Stocks ➞ Best S&P 500 Stocks ➞ Best Tech Stocks ➞ Best Biotech Stocks ➞ |
| Detailed Overview of Asia Stocks |
| Asia Technical Overview, Leaders & Laggards, Top Asia ETF Funds & Detailed Asia Stocks List, Charts, Trends & More |
| Asia: Technical Analysis, Trends & YTD Performance | |
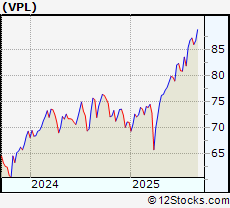
 VPL Weekly Chart |
|
| Long Term Trend: Very Good | |
| Medium Term Trend: Good | |
 VPL Daily Chart |
|
| Short Term Trend: Very Good | |
| Overall Trend Score: 100 | |
| YTD Performance: 26.1881% | |
| **Trend Scores & Views Are Only For Educational Purposes And Not For Investing | |
| 12Stocks.com: Investing in Asia Index using Exchange Traded Funds | |
|
The following table shows list of key exchange traded funds (ETF) that
help investors play Asia stock market. For detailed view, check out our ETF Funds section of our website. Quick View: Move mouse or cursor over ETF symbol (ticker) to view short-term technical chart and over ETF name to view long term chart. Click on ticker or stock name for detailed view. Click on to add stock symbol to your watchlist and to view watchlist. |
12Stocks.com List of ETFs that track Asia Index
| Ticker | ETF Name | Watchlist | Recent Price | Market Intelligence Score | Change % | Week % | Year-to-date % |
| AYT | GEMS Asia 8 | | 4.23 | 0 | 0.475059 | -79.1933 | 0% |
| ALD | Asia Local Debt | | 31.68 | 70 | -0.0946074 | 6.30872 | 0% |
| ADRA | Asia 50 ADR | | 3.29 | 50 | 9.66667 | 2.49221 | 0% |
| INP | India ETN | | 52.85 | 70 | 0.132626 | 7.6594 | 0% |
| 12Stocks.com: Charts, Trends, Fundamental Data and Performances of Asia Stocks | |
|
We now take in-depth look at all Asia stocks including charts, multi-period performances and overall trends (as measured by market intelligence score). One can sort Asia stocks (click link to choose) by Daily, Weekly and by Year-to-Date performances. Also, one can sort by size of the company or by market capitalization. |
| Select Your Default Chart Type: | |||||
| |||||
| Click on stock symbol or name for detailed view. Click on to add stock symbol to your watchlist and to view watchlist. Quick View: Move mouse or cursor over "Daily" to quickly view daily technical stock chart and over "Weekly" to view weekly technical stock chart. | |||||

 | SGOC SGOCO Group, Ltd. |
| Sector: Technology | |
| SubSector: Electronic Equipment | |
| MarketCap: 73.47 Millions | |
| Recent Price: 4.39 Market Intelligence Score: 30 | |
| Day Percent Change: -1.12613% Day Change: -9999 | |
| Week Change: -2.00893% Year-to-date Change: 0.0% | |
| SGOC Links: Profile News Message Board | |
| Charts:- Daily , Weekly | |
| Add SGOC to Watchlist: View: Get Complete SGOC Trend Analysis ➞ | |
 | CXDC China XD Plastics Company Limited |
| Sector: Consumer Staples | |
| SubSector: Rubber & Plastics | |
| MarketCap: 68.857 Millions | |
| Recent Price: 0.91 Market Intelligence Score: 10 | |
| Day Percent Change: 0% Day Change: -9999 | |
| Week Change: 0% Year-to-date Change: 0.0% | |
| CXDC Links: Profile News Message Board | |
| Charts:- Daily , Weekly | |
| Add CXDC to Watchlist: View: Get Complete CXDC Trend Analysis ➞ | |
 | ATIF ATIF Holdings Limited |
| Sector: Financials | |
| SubSector: Asset Management | |
| MarketCap: 68.5203 Millions | |
| Recent Price: 1.07 Market Intelligence Score: 30 | |
| Day Percent Change: -0.465116% Day Change: -9999 | |
| Week Change: 7% Year-to-date Change: -23.7% | |
| ATIF Links: Profile News Message Board | |
| Charts:- Daily , Weekly | |
| Add ATIF to Watchlist: View: Get Complete ATIF Trend Analysis ➞ | |
 | CMCM Cheetah Mobile Inc ADR |
| Sector: Technology | |
| SubSector: Internet Content & Information | |
| MarketCap: 66.3 Millions | |
| Recent Price: 8.21 Market Intelligence Score: 100 | |
| Day Percent Change: -6.17143% Day Change: 0.15 | |
| Week Change: 41.0653% Year-to-date Change: 78.5% | |
| CMCM Links: Profile News Message Board | |
| Charts:- Daily , Weekly | |
| Add CMCM to Watchlist: View: Get Complete CMCM Trend Analysis ➞ | |
 | DSWL Deswell Industries, Inc |
| Sector: Technology | |
| SubSector: Electronic Components | |
| MarketCap: 66.05 Millions | |
| Recent Price: 4.15 Market Intelligence Score: 60 | |
| Day Percent Change: -0.479616% Day Change: -0.03 | |
| Week Change: -1.65877% Year-to-date Change: 79.8% | |
| DSWL Links: Profile News Message Board | |
| Charts:- Daily , Weekly | |
| Add DSWL to Watchlist: View: Get Complete DSWL Trend Analysis ➞ | |
 | SORL SORL Auto Parts, Inc. |
| Sector: Consumer Staples | |
| SubSector: Auto Manufacturers - Major | |
| MarketCap: 65.6471 Millions | |
| Recent Price: 0.49 Market Intelligence Score: 10 | |
| Day Percent Change: -2% Day Change: -9999 | |
| Week Change: -28.9855% Year-to-date Change: 0.0% | |
| SORL Links: Profile News Message Board | |
| Charts:- Daily , Weekly | |
| Add SORL to Watchlist: View: Get Complete SORL Trend Analysis ➞ | |
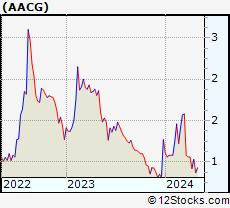 | AACG ATA Creativity Global ADR |
| Sector: Consumer Staples | |
| SubSector: Education & Training Services | |
| MarketCap: 64.94 Millions | |
| Recent Price: 2.13 Market Intelligence Score: 70 | |
| Day Percent Change: 0.471698% Day Change: -0.13 | |
| Week Change: -0.930233% Year-to-date Change: 142.0% | |
| AACG Links: Profile News Message Board | |
| Charts:- Daily , Weekly | |
| Add AACG to Watchlist: View: Get Complete AACG Trend Analysis ➞ | |
 | GMM Global Mofy AI Ltd |
| Sector: Technology | |
| SubSector: Information Technology Services | |
| MarketCap: 63.99 Millions | |
| Recent Price: 1.92 Market Intelligence Score: 10 | |
| Day Percent Change: -14.2857% Day Change: -0.01 | |
| Week Change: -17.5966% Year-to-date Change: -49.9% | |
| GMM Links: Profile News Message Board | |
| Charts:- Daily , Weekly | |
| Add GMM to Watchlist: View: Get Complete GMM Trend Analysis ➞ | |
 | IH iHuman Inc ADR |
| Sector: Consumer Staples | |
| SubSector: Education & Training Services | |
| MarketCap: 62.25 Millions | |
| Recent Price: 2.86 Market Intelligence Score: 30 | |
| Day Percent Change: -2.96203% Day Change: 0.1 | |
| Week Change: 4.7619% Year-to-date Change: 77.4% | |
| IH Links: Profile News Message Board | |
| Charts:- Daily , Weekly | |
| Add IH to Watchlist: View: Get Complete IH Trend Analysis ➞ | |
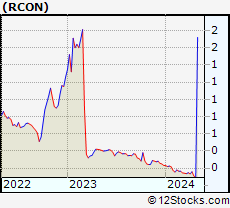 | RCON Recon Technology Ltd |
| Sector: Energy | |
| SubSector: Oil & Gas Equipment & Services | |
| MarketCap: 60.64 Millions | |
| Recent Price: 2.21 Market Intelligence Score: 50 | |
| Day Percent Change: 0.683371% Day Change: 0.06 | |
| Week Change: 12.7551% Year-to-date Change: 2.8% | |
| RCON Links: Profile News Message Board | |
| Charts:- Daily , Weekly | |
| Add RCON to Watchlist: View: Get Complete RCON Trend Analysis ➞ | |
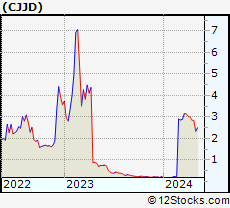 | CJJD China Jo-Jo Drugstores, Inc. |
| Sector: Services & Goods | |
| SubSector: Drug Stores | |
| MarketCap: 57.8351 Millions | |
| Recent Price: 1.44 Market Intelligence Score: 10 | |
| Day Percent Change: -5.26316% Day Change: -9999 | |
| Week Change: -12.1951% Year-to-date Change: -21.3% | |
| CJJD Links: Profile News Message Board | |
| Charts:- Daily , Weekly | |
| Add CJJD to Watchlist: View: Get Complete CJJD Trend Analysis ➞ | |
 | HPJ Highpower International, Inc. |
| Sector: Industrials | |
| SubSector: Industrial Electrical Equipment | |
| MarketCap: 53.13 Millions | |
| Recent Price: 2.46 Market Intelligence Score: 20 | |
| Day Percent Change: 1.23457% Day Change: -9999 | |
| Week Change: -37.7215% Year-to-date Change: 0.0% | |
| HPJ Links: Profile News Message Board | |
| Charts:- Daily , Weekly | |
| Add HPJ to Watchlist: View: Get Complete HPJ Trend Analysis ➞ | |
 | ICG Intchains Group Ltd ADR |
| Sector: Technology | |
| SubSector: Semiconductors | |
| MarketCap: 53.08 Millions | |
| Recent Price: 1.86 Market Intelligence Score: 46 | |
| Day Percent Change: -2% Day Change: -0.04 | |
| Week Change: -18.84% Year-to-date Change: -40.6% | |
| ICG Links: Profile News Message Board | |
| Charts:- Daily , Weekly | |
| Add ICG to Watchlist: View: Get Complete ICG Trend Analysis ➞ | |
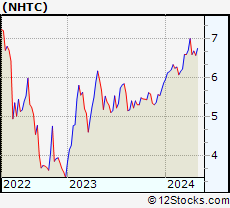 | NHTC Natural Health Trends Corp |
| Sector: Services & Goods | |
| SubSector: Internet Retail | |
| MarketCap: 52.62 Millions | |
| Recent Price: 4.40 Market Intelligence Score: 50 | |
| Day Percent Change: 0.456621% Day Change: -0.02 | |
| Week Change: 4.2654% Year-to-date Change: 8.5% | |
| NHTC Links: Profile News Message Board | |
| Charts:- Daily , Weekly | |
| Add NHTC to Watchlist: View: Get Complete NHTC Trend Analysis ➞ | |
 | JG Aurora Mobile Ltd ADR |
| Sector: Technology | |
| SubSector: Software - Infrastructure | |
| MarketCap: 46.35 Millions | |
| Recent Price: 10.04 Market Intelligence Score: 40 | |
| Day Percent Change: -1.07783% Day Change: 0.26 | |
| Week Change: 1.60597% Year-to-date Change: 46.6% | |
| JG Links: Profile News Message Board | |
| Charts:- Daily , Weekly | |
| Add JG to Watchlist: View: Get Complete JG Trend Analysis ➞ | |
 | STG Sunlands Technology Group ADR |
| Sector: Consumer Staples | |
| SubSector: Education & Training Services | |
| MarketCap: 45.15 Millions | |
| Recent Price: 8.82 Market Intelligence Score: 50 | |
| Day Percent Change: 1.96532% Day Change: 0.21 | |
| Week Change: 6.5861% Year-to-date Change: 63.3% | |
| STG Links: Profile News Message Board | |
| Charts:- Daily , Weekly | |
| Add STG to Watchlist: View: Get Complete STG Trend Analysis ➞ | |
 | CCIH ChinaCache International Holdings Ltd. |
| Sector: Technology | |
| SubSector: Internet Information Providers | |
| MarketCap: 44.73 Millions | |
| Recent Price: 2.09 Market Intelligence Score: 40 | |
| Day Percent Change: -0.47619% Day Change: -9999 | |
| Week Change: 41.2162% Year-to-date Change: 0.0% | |
| CCIH Links: Profile News Message Board | |
| Charts:- Daily , Weekly | |
| Add CCIH to Watchlist: View: Get Complete CCIH Trend Analysis ➞ | |
 | YGE Yingli Green Energy Holding Company Limited |
| Sector: Technology | |
| SubSector: Semiconductor - Specialized | |
| MarketCap: 40.75 Millions | |
| Recent Price: 1.51 Market Intelligence Score: 70 | |
| Day Percent Change: 0.666667% Day Change: -9999 | |
| Week Change: -92.5579% Year-to-date Change: 0.0% | |
| YGE Links: Profile News Message Board | |
| Charts:- Daily , Weekly | |
| Add YGE to Watchlist: View: Get Complete YGE Trend Analysis ➞ | |
 | WIMI Wimi Hologram Cloud Inc |
| Sector: Technology | |
| SubSector: Advertising Agencies | |
| MarketCap: 38.1 Millions | |
| Recent Price: 4.46 Market Intelligence Score: 100 | |
| Day Percent Change: 1.59453% Day Change: 0.02 | |
| Week Change: 18.9333% Year-to-date Change: -73.5% | |
| WIMI Links: Profile News Message Board | |
| Charts:- Daily , Weekly | |
| Add WIMI to Watchlist: View: Get Complete WIMI Trend Analysis ➞ | |
 | JP Jupai Holdings Limited |
| Sector: Financials | |
| SubSector: Asset Management | |
| MarketCap: 37.4203 Millions | |
| Recent Price: 11.96 Market Intelligence Score: 80 | |
| Day Percent Change: -2.28758% Day Change: -9999 | |
| Week Change: 3047.37% Year-to-date Change: 0.0% | |
| JP Links: Profile News Message Board | |
| Charts:- Daily , Weekly | |
| Add JP to Watchlist: View: Get Complete JP Trend Analysis ➞ | |
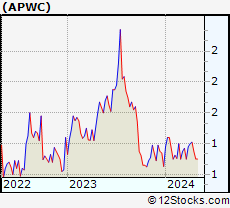 | APWC Asia Pacific Wire & Cable |
| Sector: Industrials | |
| SubSector: Electrical Equipment & Parts | |
| MarketCap: 37.09 Millions | |
| Recent Price: 2.06 Market Intelligence Score: 100 | |
| Day Percent Change: 11.3208% Day Change: 0.03 | |
| Week Change: 14.7222% Year-to-date Change: 47.5% | |
| APWC Links: Profile News Message Board | |
| Charts:- Daily , Weekly | |
| Add APWC to Watchlist: View: Get Complete APWC Trend Analysis ➞ | |
 | CASI CASI Pharmaceuticals Inc |
| Sector: Health Care | |
| SubSector: Biotechnology | |
| MarketCap: 36.25 Millions | |
| Recent Price: 2.28 Market Intelligence Score: 30 | |
| Day Percent Change: -2.14592% Day Change: 0.19 | |
| Week Change: 0% Year-to-date Change: -23.5% | |
| CASI Links: Profile News Message Board | |
| Charts:- Daily , Weekly | |
| Add CASI to Watchlist: View: Get Complete CASI Trend Analysis ➞ | |
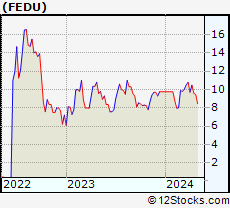 | FEDU Four Seasons Education (Cayman) Inc ADR |
| Sector: Consumer Staples | |
| SubSector: Education & Training Services | |
| MarketCap: 32.77 Millions | |
| Recent Price: 13.64 Market Intelligence Score: 20 | |
| Day Percent Change: -4.74328% Day Change: -9999 | |
| Week Change: -4.01126% Year-to-date Change: 31.2% | |
| FEDU Links: Profile News Message Board | |
| Charts:- Daily , Weekly | |
| Add FEDU to Watchlist: View: Get Complete FEDU Trend Analysis ➞ | |
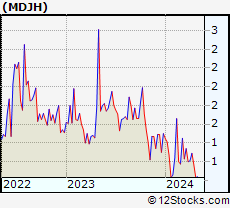 | MDJH MDJM Ltd. |
| Sector: Financials | |
| SubSector: Property Management | |
| MarketCap: 32.4242 Millions | |
| Recent Price: 0.24 Market Intelligence Score: 90 | |
| Day Percent Change: 83.0769% Day Change: -9999 | |
| Week Change: 40.8284% Year-to-date Change: -6.7% | |
| MDJH Links: Profile News Message Board | |
| Charts:- Daily , Weekly | |
| Add MDJH to Watchlist: View: Get Complete MDJH Trend Analysis ➞ | |
 | CNF CNFinance Holdings Ltd ADR |
| Sector: Financials | |
| SubSector: Mortgage Finance | |
| MarketCap: 31.96 Millions | |
| Recent Price: 3.05 Market Intelligence Score: 80 | |
| Day Percent Change: -5.8642% Day Change: 0.04 | |
| Week Change: 1170.83% Year-to-date Change: 193.3% | |
| CNF Links: Profile News Message Board | |
| Charts:- Daily , Weekly | |
| Add CNF to Watchlist: View: Get Complete CNF Trend Analysis ➞ | |
| To view more stocks, click on Next / Previous arrows or select different range: 0 - 25 , 25 - 50 , 50 - 75 , 75 - 100 , 100 - 125 , 125 - 150 , 150 - 175 , 175 - 200 , 200 - 225 , 225 - 250 , 250 - 275 , 275 - 300 , 300 - 325 , 325 - 350 | ||
| Click To Change The Sort Order: By Market Cap or Company Size Performance: Year-to-date, Week and Day | |
| Select Chart Type: | ||
|
Best Stocks Today 12Stocks.com |
© 2025 12Stocks.com Terms & Conditions Privacy Contact Us
All Information Provided Only For Education And Not To Be Used For Investing or Trading. See Terms & Conditions


One More Thing ... Get Best Stocks Delivered Daily!
Never Ever Miss A Move With Our Top Ten Stocks Lists
Find Best Stocks In Any Market - Bull or Bear Market
Take A Peek At Our Top Ten Stocks Lists: Daily, Weekly, Year-to-Date & Top Trends
Find Best Stocks In Any Market - Bull or Bear Market
Take A Peek At Our Top Ten Stocks Lists: Daily, Weekly, Year-to-Date & Top Trends
Asia Stocks With Best Up Trends [0-bearish to 100-bullish]: Sony [100], Baozun [100], VNET [100], Baidu [100], NetEase [100], China [100], Ctrip.com [100], SINA [100], Hollysys Automation[100], Vipshop [100], Taiwan Semiconductor[100]
Best Asia Stocks Year-to-Date:
Regencell Bioscience[11493.1%], So-Young [375.53%], Sify [281.373%], QuantaSing [269.91%], Xunlei [259.524%], Oneconnect Financial[196.708%], Yatsen Holding[165.104%], Niu [132.759%], Masterbeef [128.049%], Tencent Music[120.848%], HUYA [104.307%] Best Asia Stocks This Week:
CNOOC [137266%], Nam Tai[5033.33%], Fang [4150%], Sinopec Shanghai[1992.58%], PetroChina [1137.09%], China [1104.2%], Internet Initiative[913.355%], China Life[690.958%], Leju [539.091%], Aluminum [516.255%], Global Cord[335.132%] Best Asia Stocks Daily:
Sony [194.565%], China SXT[15.1163%], HUTCHMED (China)[9.52963%], Regencell Bioscience[9.29368%], Perfect Corp[8.33333%], Jianpu [7.78054%], Baozun [6.95067%], JinkoSolar Holding[6.31356%], VNET [5.0494%], Bilibili [4.08998%], QuantaSing [3.9%]