
 Login Sign Up


| |||||
 |  | ||||

| 12Stocks.com Market Intelligence |
Best Tech Stocks
| In a hurry? Tech Stocks Lists: Performance & Trends, Stock Charts, FANG Stocks
Sort Tech stocks: Daily, Weekly, Year-to-Date, Market Cap & Trends. Filter Tech stocks list by size:All Tech Large Mid-Range Small and MicroCap |
| 12Stocks.com Tech Stocks Performances & Trends Daily | |||||||||
|
|  The overall Smart Investing & Trading Score is 68 (0-bearish to 100-bullish) which puts Technology sector in short term neutral to bullish trend. The Smart Investing & Trading Score from previous trading session is 58 and hence an improvement of trend.
| ||||||||
Here are the Smart Investing & Trading Scores of the most requested Technology stocks at 12Stocks.com (click stock name for detailed review):
|


| 12Stocks.com: Investing in Technology sector with Stocks | |
|
The following table helps investors and traders sort through current performance and trends (as measured by Smart Investing & Trading Score) of various
stocks in the Tech sector. Quick View: Move mouse or cursor over stock symbol (ticker) to view short-term technical chart and over stock name to view long term chart. Click on  to add stock symbol to your watchlist and to add stock symbol to your watchlist and  to view watchlist. Click on any ticker or stock name for detailed market intelligence report for that stock. to view watchlist. Click on any ticker or stock name for detailed market intelligence report for that stock. |
12Stocks.com Performance of Stocks in Tech Sector
| Ticker | Stock Name | Watchlist | Category | Recent Price | Smart Investing & Trading Score | Change % | YTD Change% |
| BTDR | Bitdeer |   | Software - | 6.03 | 15 | -4.89% | -41.51% |
| CNXC | Concentrix | | IT | 56.49 | 65 | 2.70% | -42.48% |
| AIXI | Xiao-I | | Software - | 1.28 | 35 | 0.00% | -43.11% |
| SHLS | Shoals | | Solar | 8.76 | 18 | 2.76% | -43.48% |
| MEI | Methode Electronics | | Electronics | 12.56 | 59 | 2.78% | -44.74% |
| RUN | Sunrun | | Semiconductor | 10.83 | 52 | 5.25% | -44.83% |
| NVTS | Navitas Semiconductor | | Semiconductors | 4.46 | 30 | 0.22% | -45.05% |
| DDD | 3D Systems | | Computer | 3.48 | 52 | 1.46% | -45.20% |
| RDFN | Redfin | | Internet | 5.63 | 42 | 0.18% | -45.45% |
| FRGE | Forge Global | | Software - | 1.92 | 27 | -0.26% | -46.36% |
| AAOI | Applied Optoelectronics | | Semiconductor | 10.36 | 10 | -4.56% | -46.40% |
| TYGO | Tigo Energy | | Solar | 1.13 | 30 | 6.60% | -46.45% |
| UPLD | Upland Software | | Software | 2.26 | 42 | 2.73% | -46.57% |
| SSTI | ShotSpotter | | Software | 13.46 | 42 | -1.54% | -47.30% |
| ATNI | ATN | | Telecom | 20.04 | 0 | 2.66% | -48.58% |
| EBON | Ebang | | Computer Hardware | 7.82 | 20 | 0.19% | -48.81% |
| TXG | 10x Genomics | | Healthcare Information | 28.56 | 42 | 3.52% | -48.96% |
| CRNC | Cerence | | Software | 9.80 | 25 | 0.93% | -50.15% |
| STEM | Stem | | Software - Infrastructure | 1.88 | 30 | 2.46% | -51.17% |
| TWKS | Thoughtworks Holding | | IT | 2.37 | 20 | -0.84% | -51.23% |
| CCSI | Consensus Cloud | | Software - Infrastructure | 12.65 | 20 | 3.10% | -52.51% |
| WALD | Waldencast | | Software - | 5.24 | 20 | 1.75% | -53.61% |
| SPWR | SunPower | | Semiconductor | 2.15 | 47 | 7.79% | -55.59% |
| PERI | Perion Network | | Software | 12.07 | 49 | 1.34% | -60.90% |
| QH | Quhuo | | Software | 0.57 | 10 | 3.45% | -61.03% |
| For chart view version of above stock list: Chart View ➞ 0 - 25 , 25 - 50 , 50 - 75 , 75 - 100 , 100 - 125 , 125 - 150 , 150 - 175 , 175 - 200 , 200 - 225 , 225 - 250 , 250 - 275 , 275 - 300 , 300 - 325 , 325 - 350 , 350 - 375 , 375 - 400 , 400 - 425 , 425 - 450 , 450 - 475 , 475 - 500 , 500 - 525 , 525 - 550 , 550 - 575 , 575 - 600 , 600 - 625 , 625 - 650 | ||
 | Click To Change The Sort Order: By Market Cap or Company Size Performance: Year-to-date, Week and Day |  |
|
Get the most comprehensive stock market coverage daily at 12Stocks.com ➞ Best Stocks Today ➞ Best Stocks Weekly ➞ Best Stocks Year-to-Date ➞ Best Stocks Trends ➞  Best Stocks Today 12Stocks.com Best Nasdaq Stocks ➞ Best S&P 500 Stocks ➞ Best Tech Stocks ➞ Best Biotech Stocks ➞ |
| Detailed Overview of Tech Stocks |
| Tech Technical Overview, Leaders & Laggards, Top Tech ETF Funds & Detailed Tech Stocks List, Charts, Trends & More |
| Tech Sector: Technical Analysis, Trends & YTD Performance | |
| Technology sector is composed of stocks
from semiconductors, software, web, social media
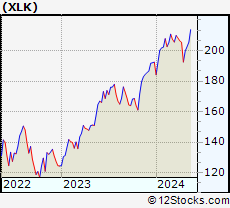
and services subsectors. Technology sector, as represented by XLK, an exchange-traded fund [ETF] that holds basket of tech stocks (e.g, Intel, Google) is up by 4.19% and is currently underperforming the overall market by -2.1% year-to-date. Below is a quick view of technical charts and trends: |
|
 XLK Weekly Chart |
|
| Long Term Trend: Good | |
| Medium Term Trend: Not Good | |
 XLK Daily Chart |
|
| Short Term Trend: Very Good | |
| Overall Trend Score: 68 | |
| YTD Performance: 4.19% | |
| **Trend Scores & Views Are Only For Educational Purposes And Not For Investing | |
| 12Stocks.com: Top Performing Technology Sector Stocks | ||||||||||||||||||||||||||||||||||||||||||||||||
 The top performing Technology sector stocks year to date are
Now, more recently, over last week, the top performing Technology sector stocks on the move are


|
||||||||||||||||||||||||||||||||||||||||||||||||
| 12Stocks.com: Investing in Tech Sector using Exchange Traded Funds | |
|
The following table shows list of key exchange traded funds (ETF) that
help investors track Tech Index. For detailed view, check out our ETF Funds section of our website. Quick View: Move mouse or cursor over ETF symbol (ticker) to view short-term technical chart and over ETF name to view long term chart. Click on ticker or stock name for detailed view. Click on to add stock symbol to your watchlist and to view watchlist. |
12Stocks.com List of ETFs that track Tech Index
| Ticker | ETF Name | Watchlist | Recent Price | Smart Investing & Trading Score | Change % | Week % | Year-to-date % |
| XLK | Technology | | 200.54 | 68 | 0.36 | 0.36 | 4.19% |
| QQQ | QQQ | | 431.87 | 68 | 0.20 | 0.2 | 5.46% |
| IYW | Technology | | 130.98 | 68 | 0.02 | 0.02 | 6.7% |
| VGT | Information Technology | | 505.39 | 75 | 0.29 | 0.29 | 4.42% |
| IXN | Global Tech | | 71.92 | 58 | 0.17 | 0.17 | 5.49% |
| IGV | Tech-Software | | 81.03 | 35 | -0.07 | -0.07 | -0.12% |
| XSD | Semiconductor | | 226.15 | 100 | 0.65 | 0.65 | 0.61% |
| TQQQ | QQQ | | 55.74 | 68 | 0.83 | 0.83 | 9.94% |
| SQQQ | Short QQQ | | 11.36 | 27 | -0.61 | -0.61 | -15.54% |
| SOXL | Semicondct Bull 3X | | 40.60 | 63 | 2.14 | 2.14 | 29.3% |
| SOXS | Semicondct Bear 3X | | 35.17 | 51 | 0.21 | 0.21 | 504.38% |
| SOXX | PHLX Semiconductor | | 216.99 | 78 | 0.04 | 0.04 | 12.99% |
| QTEC | First -100-Tech | | 183.52 | 75 | -0.26 | -0.26 | 4.59% |
| SMH | Semiconductor | | 218.13 | 63 | 0.22 | 0.22 | 24.74% |
| 12Stocks.com: Charts, Trends, Fundamental Data and Performances of Tech Stocks | |
|
We now take in-depth look at all Tech stocks including charts, multi-period performances and overall trends (as measured by Smart Investing & Trading Score). One can sort Tech stocks (click link to choose) by Daily, Weekly and by Year-to-Date performances. Also, one can sort by size of the company or by market capitalization. |
| Select Your Default Chart Type: | |||||
| |||||
| Click on stock symbol or name for detailed view. Click on to add stock symbol to your watchlist and to view watchlist. Quick View: Move mouse or cursor over "Daily" to quickly view daily technical stock chart and over "Weekly" to view weekly technical stock chart. | |||||


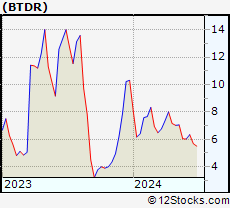 | BTDR Bitdeer Technologies Group |
| Sector: Technology | |
| SubSector: Software - Application | |
| MarketCap: 1100 Millions | |
| Recent Price: 6.03 Smart Investing & Trading Score: 15 | |
| Day Percent Change: -4.89% Day Change: -0.31 | |
| Week Change: -4.89% Year-to-date Change: -41.5% | |
| BTDR Links: Profile News Message Board | |
| Charts:- Daily , Weekly | |
| Add BTDR to Watchlist: View: Get Complete BTDR Trend Analysis ➞ | |
 | CNXC Concentrix Corporation |
| Sector: Technology | |
| SubSector: Information Technology Services | |
| MarketCap: 51987 Millions | |
| Recent Price: 56.49 Smart Investing & Trading Score: 65 | |
| Day Percent Change: 2.70% Day Change: 1.48 | |
| Week Change: 2.7% Year-to-date Change: -42.5% | |
| CNXC Links: Profile News Message Board | |
| Charts:- Daily , Weekly | |
| Add CNXC to Watchlist: View: Get Complete CNXC Trend Analysis ➞ | |
 | AIXI Xiao-I Corporation |
| Sector: Technology | |
| SubSector: Software - Application | |
| MarketCap: 431 Millions | |
| Recent Price: 1.28 Smart Investing & Trading Score: 35 | |
| Day Percent Change: 0.00% Day Change: 0.00 | |
| Week Change: 0% Year-to-date Change: -43.1% | |
| AIXI Links: Profile News Message Board | |
| Charts:- Daily , Weekly | |
| Add AIXI to Watchlist: View: Get Complete AIXI Trend Analysis ➞ | |
 | SHLS Shoals Technologies Group, Inc. |
| Sector: Technology | |
| SubSector: Solar | |
| MarketCap: 4360 Millions | |
| Recent Price: 8.76 Smart Investing & Trading Score: 18 | |
| Day Percent Change: 2.76% Day Change: 0.23 | |
| Week Change: 2.76% Year-to-date Change: -43.5% | |
| SHLS Links: Profile News Message Board | |
| Charts:- Daily , Weekly | |
| Add SHLS to Watchlist: View: Get Complete SHLS Trend Analysis ➞ | |
 | MEI Methode Electronics, Inc. |
| Sector: Technology | |
| SubSector: Diversified Electronics | |
| MarketCap: 941.896 Millions | |
| Recent Price: 12.56 Smart Investing & Trading Score: 59 | |
| Day Percent Change: 2.78% Day Change: 0.34 | |
| Week Change: 2.78% Year-to-date Change: -44.7% | |
| MEI Links: Profile News Message Board | |
| Charts:- Daily , Weekly | |
| Add MEI to Watchlist: View: Get Complete MEI Trend Analysis ➞ | |
 | RUN Sunrun Inc. |
| Sector: Technology | |
| SubSector: Semiconductor - Specialized | |
| MarketCap: 1286.2 Millions | |
| Recent Price: 10.83 Smart Investing & Trading Score: 52 | |
| Day Percent Change: 5.25% Day Change: 0.54 | |
| Week Change: 5.25% Year-to-date Change: -44.8% | |
| RUN Links: Profile News Message Board | |
| Charts:- Daily , Weekly | |
| Add RUN to Watchlist: View: Get Complete RUN Trend Analysis ➞ | |
 | NVTS Navitas Semiconductor Corporation |
| Sector: Technology | |
| SubSector: Semiconductors | |
| MarketCap: 1790 Millions | |
| Recent Price: 4.46 Smart Investing & Trading Score: 30 | |
| Day Percent Change: 0.22% Day Change: 0.01 | |
| Week Change: 0.22% Year-to-date Change: -45.1% | |
| NVTS Links: Profile News Message Board | |
| Charts:- Daily , Weekly | |
| Add NVTS to Watchlist: View: Get Complete NVTS Trend Analysis ➞ | |
 | DDD 3D Systems Corporation |
| Sector: Technology | |
| SubSector: Computer Peripherals | |
| MarketCap: 842.989 Millions | |
| Recent Price: 3.48 Smart Investing & Trading Score: 52 | |
| Day Percent Change: 1.46% Day Change: 0.05 | |
| Week Change: 1.46% Year-to-date Change: -45.2% | |
| DDD Links: Profile News Message Board | |
| Charts:- Daily , Weekly | |
| Add DDD to Watchlist: View: Get Complete DDD Trend Analysis ➞ | |
 | RDFN Redfin Corporation |
| Sector: Technology | |
| SubSector: Internet Information Providers | |
| MarketCap: 1356.2 Millions | |
| Recent Price: 5.63 Smart Investing & Trading Score: 42 | |
| Day Percent Change: 0.18% Day Change: 0.01 | |
| Week Change: 0.18% Year-to-date Change: -45.5% | |
| RDFN Links: Profile News Message Board | |
| Charts:- Daily , Weekly | |
| Add RDFN to Watchlist: View: Get Complete RDFN Trend Analysis ➞ | |
 | FRGE Forge Global Holdings, Inc. |
| Sector: Technology | |
| SubSector: Software - Application | |
| MarketCap: 426 Millions | |
| Recent Price: 1.92 Smart Investing & Trading Score: 27 | |
| Day Percent Change: -0.26% Day Change: 0.00 | |
| Week Change: -0.26% Year-to-date Change: -46.4% | |
| FRGE Links: Profile News Message Board | |
| Charts:- Daily , Weekly | |
| Add FRGE to Watchlist: View: Get Complete FRGE Trend Analysis ➞ | |
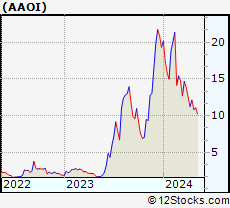 | AAOI Applied Optoelectronics, Inc. |
| Sector: Technology | |
| SubSector: Semiconductor - Integrated Circuits | |
| MarketCap: 168.91 Millions | |
| Recent Price: 10.36 Smart Investing & Trading Score: 10 | |
| Day Percent Change: -4.56% Day Change: -0.49 | |
| Week Change: -4.56% Year-to-date Change: -46.4% | |
| AAOI Links: Profile News Message Board | |
| Charts:- Daily , Weekly | |
| Add AAOI to Watchlist: View: Get Complete AAOI Trend Analysis ➞ | |
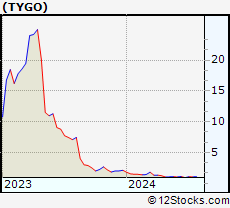 | TYGO Tigo Energy, Inc. |
| Sector: Technology | |
| SubSector: Solar | |
| MarketCap: 1250 Millions | |
| Recent Price: 1.13 Smart Investing & Trading Score: 30 | |
| Day Percent Change: 6.60% Day Change: 0.07 | |
| Week Change: 6.6% Year-to-date Change: -46.5% | |
| TYGO Links: Profile News Message Board | |
| Charts:- Daily , Weekly | |
| Add TYGO to Watchlist: View: Get Complete TYGO Trend Analysis ➞ | |
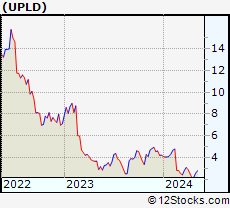 | UPLD Upland Software, Inc. |
| Sector: Technology | |
| SubSector: Application Software | |
| MarketCap: 654.562 Millions | |
| Recent Price: 2.26 Smart Investing & Trading Score: 42 | |
| Day Percent Change: 2.73% Day Change: 0.06 | |
| Week Change: 2.73% Year-to-date Change: -46.6% | |
| UPLD Links: Profile News Message Board | |
| Charts:- Daily , Weekly | |
| Add UPLD to Watchlist: View: Get Complete UPLD Trend Analysis ➞ | |
 | SSTI ShotSpotter, Inc. |
| Sector: Technology | |
| SubSector: Application Software | |
| MarketCap: 353.062 Millions | |
| Recent Price: 13.46 Smart Investing & Trading Score: 42 | |
| Day Percent Change: -1.54% Day Change: -0.21 | |
| Week Change: -1.54% Year-to-date Change: -47.3% | |
| SSTI Links: Profile News Message Board | |
| Charts:- Daily , Weekly | |
| Add SSTI to Watchlist: View: Get Complete SSTI Trend Analysis ➞ | |
 | ATNI ATN International, Inc. |
| Sector: Technology | |
| SubSector: Telecom Services - Domestic | |
| MarketCap: 1014.77 Millions | |
| Recent Price: 20.04 Smart Investing & Trading Score: 0 | |
| Day Percent Change: 2.66% Day Change: 0.52 | |
| Week Change: 2.66% Year-to-date Change: -48.6% | |
| ATNI Links: Profile News Message Board | |
| Charts:- Daily , Weekly | |
| Add ATNI to Watchlist: View: Get Complete ATNI Trend Analysis ➞ | |
 | EBON Ebang International Holdings Inc. |
| Sector: Technology | |
| SubSector: Computer Hardware | |
| MarketCap: 33787 Millions | |
| Recent Price: 7.82 Smart Investing & Trading Score: 20 | |
| Day Percent Change: 0.19% Day Change: 0.02 | |
| Week Change: 0.19% Year-to-date Change: -48.8% | |
| EBON Links: Profile News Message Board | |
| Charts:- Daily , Weekly | |
| Add EBON to Watchlist: View: Get Complete EBON Trend Analysis ➞ | |
 | TXG 10x Genomics, Inc. |
| Sector: Technology | |
| SubSector: Healthcare Information Services | |
| MarketCap: 5490.45 Millions | |
| Recent Price: 28.56 Smart Investing & Trading Score: 42 | |
| Day Percent Change: 3.52% Day Change: 0.97 | |
| Week Change: 3.52% Year-to-date Change: -49.0% | |
| TXG Links: Profile News Message Board | |
| Charts:- Daily , Weekly | |
| Add TXG to Watchlist: View: Get Complete TXG Trend Analysis ➞ | |
 | CRNC Cerence Inc. |
| Sector: Technology | |
| SubSector: Application Software | |
| MarketCap: 640.662 Millions | |
| Recent Price: 9.80 Smart Investing & Trading Score: 25 | |
| Day Percent Change: 0.93% Day Change: 0.09 | |
| Week Change: 0.93% Year-to-date Change: -50.2% | |
| CRNC Links: Profile News Message Board | |
| Charts:- Daily , Weekly | |
| Add CRNC to Watchlist: View: Get Complete CRNC Trend Analysis ➞ | |
 | STEM Stem, Inc. |
| Sector: Technology | |
| SubSector: Software - Infrastructure | |
| MarketCap: 836 Millions | |
| Recent Price: 1.88 Smart Investing & Trading Score: 30 | |
| Day Percent Change: 2.46% Day Change: 0.04 | |
| Week Change: 2.46% Year-to-date Change: -51.2% | |
| STEM Links: Profile News Message Board | |
| Charts:- Daily , Weekly | |
| Add STEM to Watchlist: View: Get Complete STEM Trend Analysis ➞ | |
 | TWKS Thoughtworks Holding, Inc. |
| Sector: Technology | |
| SubSector: Information Technology Services | |
| MarketCap: 2370 Millions | |
| Recent Price: 2.37 Smart Investing & Trading Score: 20 | |
| Day Percent Change: -0.84% Day Change: -0.02 | |
| Week Change: -0.84% Year-to-date Change: -51.2% | |
| TWKS Links: Profile News Message Board | |
| Charts:- Daily , Weekly | |
| Add TWKS to Watchlist: View: Get Complete TWKS Trend Analysis ➞ | |
 | CCSI Consensus Cloud Solutions, Inc. |
| Sector: Technology | |
| SubSector: Software - Infrastructure | |
| MarketCap: 609 Millions | |
| Recent Price: 12.65 Smart Investing & Trading Score: 20 | |
| Day Percent Change: 3.10% Day Change: 0.38 | |
| Week Change: 3.1% Year-to-date Change: -52.5% | |
| CCSI Links: Profile News Message Board | |
| Charts:- Daily , Weekly | |
| Add CCSI to Watchlist: View: Get Complete CCSI Trend Analysis ➞ | |
 | WALD Waldencast plc |
| Sector: Technology | |
| SubSector: Software - Application | |
| MarketCap: 897 Millions | |
| Recent Price: 5.24 Smart Investing & Trading Score: 20 | |
| Day Percent Change: 1.75% Day Change: 0.09 | |
| Week Change: 1.75% Year-to-date Change: -53.6% | |
| WALD Links: Profile News Message Board | |
| Charts:- Daily , Weekly | |
| Add WALD to Watchlist: View: Get Complete WALD Trend Analysis ➞ | |
 | SPWR SunPower Corporation |
| Sector: Technology | |
| SubSector: Semiconductor - Specialized | |
| MarketCap: 1202.6 Millions | |
| Recent Price: 2.15 Smart Investing & Trading Score: 47 | |
| Day Percent Change: 7.79% Day Change: 0.16 | |
| Week Change: 7.79% Year-to-date Change: -55.6% | |
| SPWR Links: Profile News Message Board | |
| Charts:- Daily , Weekly | |
| Add SPWR to Watchlist: View: Get Complete SPWR Trend Analysis ➞ | |
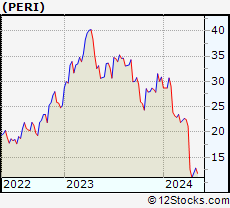 | PERI Perion Network Ltd. |
| Sector: Technology | |
| SubSector: Business Software & Services | |
| MarketCap: 127.058 Millions | |
| Recent Price: 12.07 Smart Investing & Trading Score: 49 | |
| Day Percent Change: 1.34% Day Change: 0.16 | |
| Week Change: 1.34% Year-to-date Change: -60.9% | |
| PERI Links: Profile News Message Board | |
| Charts:- Daily , Weekly | |
| Add PERI to Watchlist: View: Get Complete PERI Trend Analysis ➞ | |
 | QH Quhuo Limited |
| Sector: Technology | |
| SubSector: Software Application | |
| MarketCap: 37787 Millions | |
| Recent Price: 0.57 Smart Investing & Trading Score: 10 | |
| Day Percent Change: 3.45% Day Change: 0.02 | |
| Week Change: 3.45% Year-to-date Change: -61.0% | |
| QH Links: Profile News Message Board | |
| Charts:- Daily , Weekly | |
| Add QH to Watchlist: View: Get Complete QH Trend Analysis ➞ | |
| For tabular summary view of above stock list: Summary View ➞ 0 - 25 , 25 - 50 , 50 - 75 , 75 - 100 , 100 - 125 , 125 - 150 , 150 - 175 , 175 - 200 , 200 - 225 , 225 - 250 , 250 - 275 , 275 - 300 , 300 - 325 , 325 - 350 , 350 - 375 , 375 - 400 , 400 - 425 , 425 - 450 , 450 - 475 , 475 - 500 , 500 - 525 , 525 - 550 , 550 - 575 , 575 - 600 , 600 - 625 , 625 - 650 | ||
| Click To Change The Sort Order: By Market Cap or Company Size Performance: Year-to-date, Week and Day | |
| Select Chart Type: | ||
|
Best Stocks Today 12Stocks.com |
© 2024 12Stocks.com Terms & Conditions Privacy Contact Us
All Information Provided Only For Education And Not To Be Used For Investing or Trading. See Terms & Conditions


One More Thing ... Get Best Stocks Delivered Daily!
Never Ever Miss A Move With Our Top Ten Stocks Lists
Find Best Stocks In Any Market - Bull or Bear Market
Take A Peek At Our Top Ten Stocks Lists: Daily, Weekly, Year-to-Date & Top Trends
Find Best Stocks In Any Market - Bull or Bear Market
Take A Peek At Our Top Ten Stocks Lists: Daily, Weekly, Year-to-Date & Top Trends
Technology Stocks With Best Up Trends [0-bearish to 100-bullish]: Bakkt [100], Koninklijke Philips[100], GDS [100], Ouster [100], Baidu [100], Impinj [100], Skyworks [100], Teradyne [100], Liberty Latin[100], America Movil[100], Rogers [100]
Best Technology Stocks Year-to-Date:
MicroCloud Hologram[584.89%], Bakkt [355.16%], MediaCo Holding[277.93%], Super Micro[213.88%], Uxin [182.45%], Smith Micro[179.66%], CXApp [171.04%], SoundHound AI[113.79%], NextNav [111.12%], MicroStrategy [103.37%], CuriosityStream [99.96%] Best Technology Stocks This Week:
Bakkt [2439.4%], Koninklijke Philips[26.48%], Velo3D [14.96%], uCloudlink [14.6%], Phoenix New[12.57%], 2U [11.86%], 21Vianet [10.13%], Cogint [9.63%], GDS [9.47%], Uxin [8.79%], Xperi [8.64%] Best Technology Stocks Daily:
Bakkt [2439.40%], Koninklijke Philips[26.48%], Velo3D [14.96%], uCloudlink [14.60%], Phoenix New[12.57%], 2U [11.86%], 21Vianet [10.13%], Cogint [9.63%], GDS [9.47%], Uxin [8.79%], Xperi [8.64%]