
 Login Sign Up


| |||||
 |  | ||||

| 12Stocks.com Market Intelligence |
Best Tech Stocks
| In a hurry? Tech Stocks Lists: Performance & Trends, Stock Charts, FANG Stocks
Sort Tech stocks: Daily, Weekly, Year-to-Date, Market Cap & Trends. Filter Tech stocks list by size:All Tech Large Mid-Range Small and MicroCap |
| 12Stocks.com Tech Stocks Performances & Trends Daily | |||||||||
|
|  The overall Smart Investing & Trading Score is 68 (0-bearish to 100-bullish) which puts Technology sector in short term neutral to bullish trend. The Smart Investing & Trading Score from previous trading session is 58 and hence an improvement of trend.
| ||||||||
Here are the Smart Investing & Trading Scores of the most requested Technology stocks at 12Stocks.com (click stock name for detailed review):
|


| 12Stocks.com: Investing in Technology sector with Stocks | |
|
The following table helps investors and traders sort through current performance and trends (as measured by Smart Investing & Trading Score) of various
stocks in the Tech sector. Quick View: Move mouse or cursor over stock symbol (ticker) to view short-term technical chart and over stock name to view long term chart. Click on  to add stock symbol to your watchlist and to add stock symbol to your watchlist and  to view watchlist. Click on any ticker or stock name for detailed market intelligence report for that stock. to view watchlist. Click on any ticker or stock name for detailed market intelligence report for that stock. |
12Stocks.com Performance of Stocks in Tech Sector
| Ticker | Stock Name | Watchlist | Category | Recent Price | Smart Investing & Trading Score | Change % | YTD Change% |
| CALX | Calix |   | Communication | 27.98 | 38 | -1.48% | -35.96% |
| ROKU | Roku | | CATV | 58.52 | 10 | 3.86% | -36.15% |
| SIFY | Sify | | Internet Service Providers | 1.19 | 20 | 0.00% | -36.19% |
| KLTR | Kaltura | | Software - | 1.25 | 20 | 0.00% | -36.22% |
| FTCI | FTC Solar | | Solar | 0.44 | 32 | 2.42% | -36.33% |
| EB | Eventbrite | | Software | 5.31 | 49 | -1.30% | -36.48% |
| LBRDA | Liberty Broadband | | CATV | 50.59 | 64 | 2.08% | -37.26% |
| EXFY | Expensify | | Software - | 1.58 | 20 | -3.37% | -37.50% |
| HIVE | Aerohive Networks | | Communication | 2.83 | 73 | -7.38% | -37.64% |
| SHEN | Shenandoah Tele | | Telecom | 13.48 | 20 | 0.67% | -37.65% |
| INTC | Intel | | Semiconductor | 31.29 | 0 | -1.85% | -37.73% |
| BCOV | Brightcove | | Software | 1.61 | 27 | -1.23% | -37.84% |
| CSIQ | Canadian Solar | | Semiconductor | 16.27 | 74 | 7.43% | -37.95% |
| EGHT | 8x8 | | Communication | 2.34 | 32 | 3.08% | -38.10% |
| OCFT | OneConnect Financial | | Software | 1.95 | 35 | -2.50% | -38.10% |
| TDOC | Teladoc Health | | Healthcare Information | 13.33 | 25 | 2.46% | -38.14% |
| CMBM | Cambium Networks | | Communication | 3.70 | 54 | 3.93% | -38.33% |
| ADTN | ADTRAN | | Communication | 4.50 | 20 | 1.47% | -38.76% |
| DMRC | Digimarc | | IT | 22.08 | 35 | -1.34% | -38.87% |
| U | Unity Software | | Software | 24.85 | 49 | 2.98% | -39.23% |
| VNET | 21Vianet | | IT | 1.74 | 95 | 10.13% | -39.37% |
| BIGC | BigCommerce | | Software | 5.83 | 35 | -1.19% | -40.14% |
| MKTW | MarketWise | | Software - | 1.62 | 30 | 0.62% | -40.19% |
| VSAT | Viasat | | Communication | 16.56 | 74 | 3.44% | -40.75% |
| AGMH | AGM | | Software | 1.06 | 10 | 0.00% | -41.44% |
| For chart view version of above stock list: Chart View ➞ 0 - 25 , 25 - 50 , 50 - 75 , 75 - 100 , 100 - 125 , 125 - 150 , 150 - 175 , 175 - 200 , 200 - 225 , 225 - 250 , 250 - 275 , 275 - 300 , 300 - 325 , 325 - 350 , 350 - 375 , 375 - 400 , 400 - 425 , 425 - 450 , 450 - 475 , 475 - 500 , 500 - 525 , 525 - 550 , 550 - 575 , 575 - 600 , 600 - 625 , 625 - 650 | ||
 | Click To Change The Sort Order: By Market Cap or Company Size Performance: Year-to-date, Week and Day |  |
|
Get the most comprehensive stock market coverage daily at 12Stocks.com ➞ Best Stocks Today ➞ Best Stocks Weekly ➞ Best Stocks Year-to-Date ➞ Best Stocks Trends ➞  Best Stocks Today 12Stocks.com Best Nasdaq Stocks ➞ Best S&P 500 Stocks ➞ Best Tech Stocks ➞ Best Biotech Stocks ➞ |
| Detailed Overview of Tech Stocks |
| Tech Technical Overview, Leaders & Laggards, Top Tech ETF Funds & Detailed Tech Stocks List, Charts, Trends & More |
| Tech Sector: Technical Analysis, Trends & YTD Performance | |
| Technology sector is composed of stocks
from semiconductors, software, web, social media
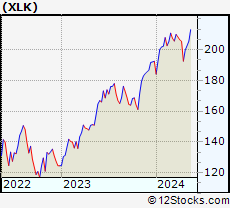
and services subsectors. Technology sector, as represented by XLK, an exchange-traded fund [ETF] that holds basket of tech stocks (e.g, Intel, Google) is up by 4.19% and is currently underperforming the overall market by -2.1% year-to-date. Below is a quick view of technical charts and trends: |
|
 XLK Weekly Chart |
|
| Long Term Trend: Good | |
| Medium Term Trend: Not Good | |
 XLK Daily Chart |
|
| Short Term Trend: Very Good | |
| Overall Trend Score: 68 | |
| YTD Performance: 4.19% | |
| **Trend Scores & Views Are Only For Educational Purposes And Not For Investing | |
| 12Stocks.com: Top Performing Technology Sector Stocks | ||||||||||||||||||||||||||||||||||||||||||||||||
 The top performing Technology sector stocks year to date are
Now, more recently, over last week, the top performing Technology sector stocks on the move are


|
||||||||||||||||||||||||||||||||||||||||||||||||
| 12Stocks.com: Investing in Tech Sector using Exchange Traded Funds | |
|
The following table shows list of key exchange traded funds (ETF) that
help investors track Tech Index. For detailed view, check out our ETF Funds section of our website. Quick View: Move mouse or cursor over ETF symbol (ticker) to view short-term technical chart and over ETF name to view long term chart. Click on ticker or stock name for detailed view. Click on to add stock symbol to your watchlist and to view watchlist. |
12Stocks.com List of ETFs that track Tech Index
| Ticker | ETF Name | Watchlist | Recent Price | Smart Investing & Trading Score | Change % | Week % | Year-to-date % |
| XLK | Technology | | 200.54 | 68 | 0.36 | 0.36 | 4.19% |
| QQQ | QQQ | | 431.87 | 68 | 0.20 | 0.2 | 5.46% |
| IYW | Technology | | 130.98 | 68 | 0.02 | 0.02 | 6.7% |
| VGT | Information Technology | | 505.39 | 75 | 0.29 | 0.29 | 4.42% |
| IXN | Global Tech | | 71.92 | 58 | 0.17 | 0.17 | 5.49% |
| IGV | Tech-Software | | 81.03 | 35 | -0.07 | -0.07 | -0.12% |
| XSD | Semiconductor | | 226.15 | 100 | 0.65 | 0.65 | 0.61% |
| TQQQ | QQQ | | 55.74 | 68 | 0.83 | 0.83 | 9.94% |
| SQQQ | Short QQQ | | 11.36 | 27 | -0.61 | -0.61 | -15.54% |
| SOXL | Semicondct Bull 3X | | 40.60 | 80 | 2.14 | 2.14 | 29.3% |
| SOXS | Semicondct Bear 3X | | 35.17 | 51 | 0.21 | 0.21 | 504.38% |
| SOXX | PHLX Semiconductor | | 216.99 | 78 | 0.04 | 0.04 | 12.99% |
| QTEC | First -100-Tech | | 183.52 | 75 | -0.26 | -0.26 | 4.59% |
| SMH | Semiconductor | | 218.13 | 63 | 0.22 | 0.22 | 24.74% |
| 12Stocks.com: Charts, Trends, Fundamental Data and Performances of Tech Stocks | |
|
We now take in-depth look at all Tech stocks including charts, multi-period performances and overall trends (as measured by Smart Investing & Trading Score). One can sort Tech stocks (click link to choose) by Daily, Weekly and by Year-to-Date performances. Also, one can sort by size of the company or by market capitalization. |
| Select Your Default Chart Type: | |||||
| |||||
| Click on stock symbol or name for detailed view. Click on to add stock symbol to your watchlist and to view watchlist. Quick View: Move mouse or cursor over "Daily" to quickly view daily technical stock chart and over "Weekly" to view weekly technical stock chart. | |||||


 | CALX Calix, Inc. |
| Sector: Technology | |
| SubSector: Communication Equipment | |
| MarketCap: 390.039 Millions | |
| Recent Price: 27.98 Smart Investing & Trading Score: 38 | |
| Day Percent Change: -1.48% Day Change: -0.42 | |
| Week Change: -1.48% Year-to-date Change: -36.0% | |
| CALX Links: Profile News Message Board | |
| Charts:- Daily , Weekly | |
| Add CALX to Watchlist: View: Get Complete CALX Trend Analysis ➞ | |
 | ROKU Roku, Inc. |
| Sector: Technology | |
| SubSector: CATV Systems | |
| MarketCap: 10503.6 Millions | |
| Recent Price: 58.52 Smart Investing & Trading Score: 10 | |
| Day Percent Change: 3.86% Day Change: 2.17 | |
| Week Change: 3.86% Year-to-date Change: -36.2% | |
| ROKU Links: Profile News Message Board | |
| Charts:- Daily , Weekly | |
| Add ROKU to Watchlist: View: Get Complete ROKU Trend Analysis ➞ | |
 | SIFY Sify Technologies Limited |
| Sector: Technology | |
| SubSector: Internet Service Providers | |
| MarketCap: 159.38 Millions | |
| Recent Price: 1.19 Smart Investing & Trading Score: 20 | |
| Day Percent Change: 0.00% Day Change: 0.00 | |
| Week Change: 0% Year-to-date Change: -36.2% | |
| SIFY Links: Profile News Message Board | |
| Charts:- Daily , Weekly | |
| Add SIFY to Watchlist: View: Get Complete SIFY Trend Analysis ➞ | |
 | KLTR Kaltura, Inc. |
| Sector: Technology | |
| SubSector: Software - Application | |
| MarketCap: 293 Millions | |
| Recent Price: 1.25 Smart Investing & Trading Score: 20 | |
| Day Percent Change: 0.00% Day Change: 0.00 | |
| Week Change: 0% Year-to-date Change: -36.2% | |
| KLTR Links: Profile News Message Board | |
| Charts:- Daily , Weekly | |
| Add KLTR to Watchlist: View: Get Complete KLTR Trend Analysis ➞ | |
 | FTCI FTC Solar, Inc. |
| Sector: Technology | |
| SubSector: Solar | |
| MarketCap: 345 Millions | |
| Recent Price: 0.44 Smart Investing & Trading Score: 32 | |
| Day Percent Change: 2.42% Day Change: 0.01 | |
| Week Change: 2.42% Year-to-date Change: -36.3% | |
| FTCI Links: Profile News Message Board | |
| Charts:- Daily , Weekly | |
| Add FTCI to Watchlist: View: Get Complete FTCI Trend Analysis ➞ | |
 | EB Eventbrite, Inc. |
| Sector: Technology | |
| SubSector: Application Software | |
| MarketCap: 805.262 Millions | |
| Recent Price: 5.31 Smart Investing & Trading Score: 49 | |
| Day Percent Change: -1.30% Day Change: -0.07 | |
| Week Change: -1.3% Year-to-date Change: -36.5% | |
| EB Links: Profile News Message Board | |
| Charts:- Daily , Weekly | |
| Add EB to Watchlist: View: Get Complete EB Trend Analysis ➞ | |
 | LBRDA Liberty Broadband Corporation |
| Sector: Technology | |
| SubSector: CATV Systems | |
| MarketCap: 17001.5 Millions | |
| Recent Price: 50.59 Smart Investing & Trading Score: 64 | |
| Day Percent Change: 2.08% Day Change: 1.03 | |
| Week Change: 2.08% Year-to-date Change: -37.3% | |
| LBRDA Links: Profile News Message Board | |
| Charts:- Daily , Weekly | |
| Add LBRDA to Watchlist: View: Get Complete LBRDA Trend Analysis ➞ | |
 | EXFY Expensify, Inc. |
| Sector: Technology | |
| SubSector: Software - Application | |
| MarketCap: 678 Millions | |
| Recent Price: 1.58 Smart Investing & Trading Score: 20 | |
| Day Percent Change: -3.37% Day Change: -0.05 | |
| Week Change: -3.37% Year-to-date Change: -37.5% | |
| EXFY Links: Profile News Message Board | |
| Charts:- Daily , Weekly | |
| Add EXFY to Watchlist: View: Get Complete EXFY Trend Analysis ➞ | |
 | HIVE Aerohive Networks, Inc. |
| Sector: Technology | |
| SubSector: Communication Equipment | |
| MarketCap: 225.85 Millions | |
| Recent Price: 2.83 Smart Investing & Trading Score: 73 | |
| Day Percent Change: -7.38% Day Change: -0.22 | |
| Week Change: -7.38% Year-to-date Change: -37.6% | |
| HIVE Links: Profile News Message Board | |
| Charts:- Daily , Weekly | |
| Add HIVE to Watchlist: View: Get Complete HIVE Trend Analysis ➞ | |
 | SHEN Shenandoah Telecommunications Company |
| Sector: Technology | |
| SubSector: Telecom Services - Domestic | |
| MarketCap: 2329.67 Millions | |
| Recent Price: 13.48 Smart Investing & Trading Score: 20 | |
| Day Percent Change: 0.67% Day Change: 0.09 | |
| Week Change: 0.67% Year-to-date Change: -37.7% | |
| SHEN Links: Profile News Message Board | |
| Charts:- Daily , Weekly | |
| Add SHEN to Watchlist: View: Get Complete SHEN Trend Analysis ➞ | |
 | INTC Intel Corporation |
| Sector: Technology | |
| SubSector: Semiconductor - Broad Line | |
| MarketCap: 222357 Millions | |
| Recent Price: 31.29 Smart Investing & Trading Score: 0 | |
| Day Percent Change: -1.85% Day Change: -0.59 | |
| Week Change: -1.85% Year-to-date Change: -37.7% | |
| INTC Links: Profile News Message Board | |
| Charts:- Daily , Weekly | |
| Add INTC to Watchlist: View: Get Complete INTC Trend Analysis ➞ | |
 | BCOV Brightcove Inc. |
| Sector: Technology | |
| SubSector: Application Software | |
| MarketCap: 266.162 Millions | |
| Recent Price: 1.61 Smart Investing & Trading Score: 27 | |
| Day Percent Change: -1.23% Day Change: -0.02 | |
| Week Change: -1.23% Year-to-date Change: -37.8% | |
| BCOV Links: Profile News Message Board | |
| Charts:- Daily , Weekly | |
| Add BCOV to Watchlist: View: Get Complete BCOV Trend Analysis ➞ | |
 | CSIQ Canadian Solar Inc. |
| Sector: Technology | |
| SubSector: Semiconductor - Specialized | |
| MarketCap: 957.96 Millions | |
| Recent Price: 16.27 Smart Investing & Trading Score: 74 | |
| Day Percent Change: 7.43% Day Change: 1.12 | |
| Week Change: 7.43% Year-to-date Change: -38.0% | |
| CSIQ Links: Profile News Message Board | |
| Charts:- Daily , Weekly | |
| Add CSIQ to Watchlist: View: Get Complete CSIQ Trend Analysis ➞ | |
 | EGHT 8x8, Inc. |
| Sector: Technology | |
| SubSector: Diversified Communication Services | |
| MarketCap: 1861.64 Millions | |
| Recent Price: 2.34 Smart Investing & Trading Score: 32 | |
| Day Percent Change: 3.08% Day Change: 0.07 | |
| Week Change: 3.08% Year-to-date Change: -38.1% | |
| EGHT Links: Profile News Message Board | |
| Charts:- Daily , Weekly | |
| Add EGHT to Watchlist: View: Get Complete EGHT Trend Analysis ➞ | |
 | OCFT OneConnect Financial Technology Co., Ltd. |
| Sector: Technology | |
| SubSector: Software Application | |
| MarketCap: 80387 Millions | |
| Recent Price: 1.95 Smart Investing & Trading Score: 35 | |
| Day Percent Change: -2.50% Day Change: -0.05 | |
| Week Change: -2.5% Year-to-date Change: -38.1% | |
| OCFT Links: Profile News Message Board | |
| Charts:- Daily , Weekly | |
| Add OCFT to Watchlist: View: Get Complete OCFT Trend Analysis ➞ | |
 | TDOC Teladoc Health, Inc. |
| Sector: Technology | |
| SubSector: Healthcare Information Services | |
| MarketCap: 11968.5 Millions | |
| Recent Price: 13.33 Smart Investing & Trading Score: 25 | |
| Day Percent Change: 2.46% Day Change: 0.32 | |
| Week Change: 2.46% Year-to-date Change: -38.1% | |
| TDOC Links: Profile News Message Board | |
| Charts:- Daily , Weekly | |
| Add TDOC to Watchlist: View: Get Complete TDOC Trend Analysis ➞ | |
 | CMBM Cambium Networks Corporation |
| Sector: Technology | |
| SubSector: Communication Equipment | |
| MarketCap: 143.739 Millions | |
| Recent Price: 3.70 Smart Investing & Trading Score: 54 | |
| Day Percent Change: 3.93% Day Change: 0.14 | |
| Week Change: 3.93% Year-to-date Change: -38.3% | |
| CMBM Links: Profile News Message Board | |
| Charts:- Daily , Weekly | |
| Add CMBM to Watchlist: View: Get Complete CMBM Trend Analysis ➞ | |
 | ADTN ADTRAN, Inc. |
| Sector: Technology | |
| SubSector: Communication Equipment | |
| MarketCap: 303.539 Millions | |
| Recent Price: 4.50 Smart Investing & Trading Score: 20 | |
| Day Percent Change: 1.47% Day Change: 0.07 | |
| Week Change: 1.47% Year-to-date Change: -38.8% | |
| ADTN Links: Profile News Message Board | |
| Charts:- Daily , Weekly | |
| Add ADTN to Watchlist: View: Get Complete ADTN Trend Analysis ➞ | |
 | DMRC Digimarc Corporation |
| Sector: Technology | |
| SubSector: Information Technology Services | |
| MarketCap: 222.268 Millions | |
| Recent Price: 22.08 Smart Investing & Trading Score: 35 | |
| Day Percent Change: -1.34% Day Change: -0.30 | |
| Week Change: -1.34% Year-to-date Change: -38.9% | |
| DMRC Links: Profile News Message Board | |
| Charts:- Daily , Weekly | |
| Add DMRC to Watchlist: View: Get Complete DMRC Trend Analysis ➞ | |
 | U Unity Software Inc. |
| Sector: Technology | |
| SubSector: Software Application | |
| MarketCap: 42837 Millions | |
| Recent Price: 24.85 Smart Investing & Trading Score: 49 | |
| Day Percent Change: 2.98% Day Change: 0.72 | |
| Week Change: 2.98% Year-to-date Change: -39.2% | |
| U Links: Profile News Message Board | |
| Charts:- Daily , Weekly | |
| Add U to Watchlist: View: Get Complete U Trend Analysis ➞ | |
 | VNET 21Vianet Group, Inc. |
| Sector: Technology | |
| SubSector: Information Technology Services | |
| MarketCap: 1846.98 Millions | |
| Recent Price: 1.74 Smart Investing & Trading Score: 95 | |
| Day Percent Change: 10.13% Day Change: 0.16 | |
| Week Change: 10.13% Year-to-date Change: -39.4% | |
| VNET Links: Profile News Message Board | |
| Charts:- Daily , Weekly | |
| Add VNET to Watchlist: View: Get Complete VNET Trend Analysis ➞ | |
 | BIGC BigCommerce Holdings, Inc. |
| Sector: Technology | |
| SubSector: Software Application | |
| MarketCap: 47587 Millions | |
| Recent Price: 5.83 Smart Investing & Trading Score: 35 | |
| Day Percent Change: -1.19% Day Change: -0.07 | |
| Week Change: -1.19% Year-to-date Change: -40.1% | |
| BIGC Links: Profile News Message Board | |
| Charts:- Daily , Weekly | |
| Add BIGC to Watchlist: View: Get Complete BIGC Trend Analysis ➞ | |
 | MKTW MarketWise, Inc. |
| Sector: Technology | |
| SubSector: Software - Application | |
| MarketCap: 646 Millions | |
| Recent Price: 1.62 Smart Investing & Trading Score: 30 | |
| Day Percent Change: 0.62% Day Change: 0.01 | |
| Week Change: 0.62% Year-to-date Change: -40.2% | |
| MKTW Links: Profile News Message Board | |
| Charts:- Daily , Weekly | |
| Add MKTW to Watchlist: View: Get Complete MKTW Trend Analysis ➞ | |
 | VSAT Viasat, Inc. |
| Sector: Technology | |
| SubSector: Communication Equipment | |
| MarketCap: 1939.59 Millions | |
| Recent Price: 16.56 Smart Investing & Trading Score: 74 | |
| Day Percent Change: 3.44% Day Change: 0.55 | |
| Week Change: 3.44% Year-to-date Change: -40.8% | |
| VSAT Links: Profile News Message Board | |
| Charts:- Daily , Weekly | |
| Add VSAT to Watchlist: View: Get Complete VSAT Trend Analysis ➞ | |
 | AGMH AGM Group Holdings Inc. |
| Sector: Technology | |
| SubSector: Application Software | |
| MarketCap: 320.362 Millions | |
| Recent Price: 1.06 Smart Investing & Trading Score: 10 | |
| Day Percent Change: 0.00% Day Change: 0.00 | |
| Week Change: 0% Year-to-date Change: -41.4% | |
| AGMH Links: Profile News Message Board | |
| Charts:- Daily , Weekly | |
| Add AGMH to Watchlist: View: Get Complete AGMH Trend Analysis ➞ | |
| For tabular summary view of above stock list: Summary View ➞ 0 - 25 , 25 - 50 , 50 - 75 , 75 - 100 , 100 - 125 , 125 - 150 , 150 - 175 , 175 - 200 , 200 - 225 , 225 - 250 , 250 - 275 , 275 - 300 , 300 - 325 , 325 - 350 , 350 - 375 , 375 - 400 , 400 - 425 , 425 - 450 , 450 - 475 , 475 - 500 , 500 - 525 , 525 - 550 , 550 - 575 , 575 - 600 , 600 - 625 , 625 - 650 | ||
| Click To Change The Sort Order: By Market Cap or Company Size Performance: Year-to-date, Week and Day | |
| Select Chart Type: | ||
|
Best Stocks Today 12Stocks.com |
© 2024 12Stocks.com Terms & Conditions Privacy Contact Us
All Information Provided Only For Education And Not To Be Used For Investing or Trading. See Terms & Conditions


One More Thing ... Get Best Stocks Delivered Daily!
Never Ever Miss A Move With Our Top Ten Stocks Lists
Find Best Stocks In Any Market - Bull or Bear Market
Take A Peek At Our Top Ten Stocks Lists: Daily, Weekly, Year-to-Date & Top Trends
Find Best Stocks In Any Market - Bull or Bear Market
Take A Peek At Our Top Ten Stocks Lists: Daily, Weekly, Year-to-Date & Top Trends
Technology Stocks With Best Up Trends [0-bearish to 100-bullish]: Bakkt [100], Koninklijke Philips[100], GDS [100], Ouster [100], Baidu [100], Impinj [100], Skyworks [100], Teradyne [100], MACOM [100], Liberty Latin[100], America Movil[100]
Best Technology Stocks Year-to-Date:
MicroCloud Hologram[584.89%], Bakkt [355.16%], MediaCo Holding[277.93%], Super Micro[213.88%], Uxin [182.45%], Smith Micro[179.66%], CXApp [171.04%], SoundHound AI[113.79%], NextNav [111.12%], MicroStrategy [103.37%], CuriosityStream [99.96%] Best Technology Stocks This Week:
Bakkt [2439.4%], Koninklijke Philips[26.48%], Velo3D [14.96%], uCloudlink [14.6%], Phoenix New[12.57%], 2U [11.86%], 21Vianet [10.13%], Cogint [9.63%], GDS [9.47%], Uxin [8.79%], Xperi [8.64%] Best Technology Stocks Daily:
Bakkt [2439.40%], Koninklijke Philips[26.48%], Velo3D [14.96%], uCloudlink [14.60%], Phoenix New[12.57%], 2U [11.86%], 21Vianet [10.13%], Cogint [9.63%], GDS [9.47%], Uxin [8.79%], Xperi [8.64%]