
 Login Sign Up


| |||||
 |  | ||||

| 12Stocks.com Market Intelligence |
Best Tech Stocks
| In a hurry? Tech Stocks Lists: Performance & Trends, Stock Charts, FANG Stocks
Sort Tech stocks: Daily, Weekly, Year-to-Date, Market Cap & Trends. Filter Tech stocks list by size:All Tech Large Mid-Range Small and MicroCap |
| 12Stocks.com Tech Stocks Performances & Trends Daily | |||||||||
|
|  The overall Smart Investing & Trading Score is 38 (0-bearish to 100-bullish) which puts Technology sector in short term bearish to neutral trend. The Smart Investing & Trading Score from previous trading session is 10 and hence an improvement of trend.
| ||||||||
Here are the Smart Investing & Trading Scores of the most requested Technology stocks at 12Stocks.com (click stock name for detailed review):
|


| 12Stocks.com: Investing in Technology sector with Stocks | |
|
The following table helps investors and traders sort through current performance and trends (as measured by Smart Investing & Trading Score) of various
stocks in the Tech sector. Quick View: Move mouse or cursor over stock symbol (ticker) to view short-term technical chart and over stock name to view long term chart. Click on  to add stock symbol to your watchlist and to add stock symbol to your watchlist and  to view watchlist. Click on any ticker or stock name for detailed market intelligence report for that stock. to view watchlist. Click on any ticker or stock name for detailed market intelligence report for that stock. |
12Stocks.com Performance of Stocks in Tech Sector
| Ticker | Stock Name | Watchlist | Category | Recent Price | Smart Investing & Trading Score | Change % | YTD Change% |
| KLAC | KLA |   | Semiconductor | 648.84 | 58 | 2.40% | 11.62% |
| QCOM | QUALCOMM | | Communication | 161.35 | 61 | 0.73% | 11.56% |
| IBM | IBM | | IT | 182.19 | 45 | 0.16% | 11.40% |
| RCM | R1 RCM | | Healthcare Information | 11.75 | 46 | -1.34% | 11.16% |
| AIP | Arteris | | Semiconductors | 6.54 | 56 | 0.62% | 11.04% |
| IIIV | i3 Verticals | | Software | 23.48 | 60 | 4.26% | 10.91% |
| GRMN | Garmin | | Instruments | 142.51 | 63 | 1.06% | 10.87% |
| FTNT | Fortinet | | Software | 64.80 | 55 | 1.74% | 10.71% |
| BHE | Benchmark Electronics | | Circuit Boards | 30.55 | 100 | 1.56% | 10.53% |
| INFA | Informatica | | Software - Infrastructure | 31.39 | 26 | -0.32% | 10.45% |
| MSI | Motorola | | Communication | 345.55 | 70 | 0.09% | 10.37% |
| KARO | Karooooo | | Software - | 27.28 | 95 | 0.70% | 10.22% |
| ARQQ | Arqit Quantum | | Software - Infrastructure | 0.50 | 53 | 3.18% | 10.18% |
| CAMT | Camtek | | Semiconductor | 76.41 | 17 | 0.55% | 10.13% |
| MODN | Model N | | Software | 29.65 | 64 | 0.30% | 10.10% |
| STER | Sterling Check | | Software - Infrastructure | 15.32 | 63 | 1.22% | 9.94% |
| ASX | ASE | | Semiconductor | 10.32 | 51 | 1.38% | 9.67% |
| CYBR | CyberArk Software | | Software | 240.22 | 58 | 2.37% | 9.66% |
| FTV | Fortive | | Instruments | 80.70 | 58 | 0.42% | 9.60% |
| DAKT | Daktronics | | Computer Based | 9.29 | 51 | 1.92% | 9.49% |
| IRM | Iron Mountain | | Software | 76.60 | 70 | 0.99% | 9.46% |
| SQSP | Squarespace | | Software - Infrastructure | 36.31 | 63 | 2.60% | 9.40% |
| MKSI | MKS | | Instruments | 112.53 | 63 | 2.56% | 9.39% |
| ACIW | ACI Worldwide | | Software | 33.45 | 100 | 3.72% | 9.31% |
| GRND | Grindr | | Software - | 9.79 | 53 | 1.14% | 9.26% |
| For chart view version of above stock list: Chart View ➞ 0 - 25 , 25 - 50 , 50 - 75 , 75 - 100 , 100 - 125 , 125 - 150 , 150 - 175 , 175 - 200 , 200 - 225 , 225 - 250 , 250 - 275 , 275 - 300 , 300 - 325 , 325 - 350 , 350 - 375 , 375 - 400 , 400 - 425 , 425 - 450 , 450 - 475 , 475 - 500 , 500 - 525 , 525 - 550 , 550 - 575 , 575 - 600 , 600 - 625 , 625 - 650 | ||
 | Click To Change The Sort Order: By Market Cap or Company Size Performance: Year-to-date, Week and Day |  |
|
Get the most comprehensive stock market coverage daily at 12Stocks.com ➞ Best Stocks Today ➞ Best Stocks Weekly ➞ Best Stocks Year-to-Date ➞ Best Stocks Trends ➞  Best Stocks Today 12Stocks.com Best Nasdaq Stocks ➞ Best S&P 500 Stocks ➞ Best Tech Stocks ➞ Best Biotech Stocks ➞ |
| Detailed Overview of Tech Stocks |
| Tech Technical Overview, Leaders & Laggards, Top Tech ETF Funds & Detailed Tech Stocks List, Charts, Trends & More |
| Tech Sector: Technical Analysis, Trends & YTD Performance | |
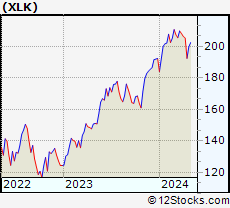
| Technology sector is composed of stocks
from semiconductors, software, web, social media
and services subsectors. Technology sector, as represented by XLK, an exchange-traded fund [ETF] that holds basket of tech stocks (e.g, Intel, Google) is up by 2.42% and is currently underperforming the overall market by -3.22% year-to-date. Below is a quick view of technical charts and trends: |
|
 XLK Weekly Chart |
|
| Long Term Trend: Not Good | |
| Medium Term Trend: Not Good | |
 XLK Daily Chart |
|
| Short Term Trend: Very Good | |
| Overall Trend Score: 38 | |
| YTD Performance: 2.42% | |
| **Trend Scores & Views Are Only For Educational Purposes And Not For Investing | |
| 12Stocks.com: Top Performing Technology Sector Stocks | ||||||||||||||||||||||||||||||||||||||||||||||||
 The top performing Technology sector stocks year to date are
Now, more recently, over last week, the top performing Technology sector stocks on the move are


|
||||||||||||||||||||||||||||||||||||||||||||||||
| 12Stocks.com: Investing in Tech Sector using Exchange Traded Funds | |
|
The following table shows list of key exchange traded funds (ETF) that
help investors track Tech Index. For detailed view, check out our ETF Funds section of our website. Quick View: Move mouse or cursor over ETF symbol (ticker) to view short-term technical chart and over ETF name to view long term chart. Click on ticker or stock name for detailed view. Click on to add stock symbol to your watchlist and to view watchlist. |
12Stocks.com List of ETFs that track Tech Index
| Ticker | ETF Name | Watchlist | Recent Price | Smart Investing & Trading Score | Change % | Week % | Year-to-date % |
| XLK | Technology | | 197.13 | 38 | 1.48 | 2.39 | 2.42% |
| QQQ | QQQ | | 424.02 | 51 | 2.34 | 2.26 | 3.54% |
| IYW | Technology | | 128.72 | 51 | 1.96 | 3.18 | 4.86% |
| VGT | Information Technology | | 495.19 | 38 | 1.80 | 3.19 | 2.31% |
| IXN | Global Tech | | 70.61 | 38 | 1.77 | 2.74 | 3.56% |
| IGV | Tech-Software | | 81.04 | 32 | 1.96 | 3.2 | -0.11% |
| XSD | Semiconductor | | 212.01 | 38 | 2.61 | 4.15 | -5.68% |
| TQQQ | QQQ | | 53.26 | 58 | 4.59 | 7.63 | 5.04% |
| SQQQ | Short QQQ | | 11.93 | 37 | -4.33 | -7.09 | -11.3% |
| SOXL | Semicondct Bull 3X | | 34.11 | 43 | 6.36 | 10.78 | 8.63% |
| SOXS | Semicondct Bear 3X | | 41.60 | 73 | -5.39 | -9.82 | 614.78% |
| SOXX | PHLX Semiconductor | | 206.62 | 51 | 2.46 | 4.15 | 7.6% |
| QTEC | First -100-Tech | | 180.57 | 38 | 2.39 | 3.81 | 2.91% |
| SMH | Semiconductor | | 207.78 | 51 | 2.34 | 4.3 | 18.82% |
| 12Stocks.com: Charts, Trends, Fundamental Data and Performances of Tech Stocks | |
|
We now take in-depth look at all Tech stocks including charts, multi-period performances and overall trends (as measured by Smart Investing & Trading Score). One can sort Tech stocks (click link to choose) by Daily, Weekly and by Year-to-Date performances. Also, one can sort by size of the company or by market capitalization. |
| Select Your Default Chart Type: | |||||
| |||||
| Click on stock symbol or name for detailed view. Click on to add stock symbol to your watchlist and to view watchlist. Quick View: Move mouse or cursor over "Daily" to quickly view daily technical stock chart and over "Weekly" to view weekly technical stock chart. | |||||


 | KLAC KLA Corporation |
| Sector: Technology | |
| SubSector: Semiconductor Equipment & Materials | |
| MarketCap: 20663.8 Millions | |
| Recent Price: 648.84 Smart Investing & Trading Score: 58 | |
| Day Percent Change: 2.40% Day Change: 15.20 | |
| Week Change: 3.29% Year-to-date Change: 11.6% | |
| KLAC Links: Profile News Message Board | |
| Charts:- Daily , Weekly | |
| Add KLAC to Watchlist: View: Get Complete KLAC Trend Analysis ➞ | |
 | QCOM QUALCOMM Incorporated |
| Sector: Technology | |
| SubSector: Communication Equipment | |
| MarketCap: 77517.7 Millions | |
| Recent Price: 161.35 Smart Investing & Trading Score: 61 | |
| Day Percent Change: 0.73% Day Change: 1.17 | |
| Week Change: 2.36% Year-to-date Change: 11.6% | |
| QCOM Links: Profile News Message Board | |
| Charts:- Daily , Weekly | |
| Add QCOM to Watchlist: View: Get Complete QCOM Trend Analysis ➞ | |
 | IBM International Business Machines Corporation |
| Sector: Technology | |
| SubSector: Information Technology Services | |
| MarketCap: 97241.6 Millions | |
| Recent Price: 182.19 Smart Investing & Trading Score: 45 | |
| Day Percent Change: 0.16% Day Change: 0.29 | |
| Week Change: 0.34% Year-to-date Change: 11.4% | |
| IBM Links: Profile News Message Board | |
| Charts:- Daily , Weekly | |
| Add IBM to Watchlist: View: Get Complete IBM Trend Analysis ➞ | |
 | RCM R1 RCM Inc. |
| Sector: Technology | |
| SubSector: Healthcare Information Services | |
| MarketCap: 1082.15 Millions | |
| Recent Price: 11.75 Smart Investing & Trading Score: 46 | |
| Day Percent Change: -1.34% Day Change: -0.16 | |
| Week Change: -1.92% Year-to-date Change: 11.2% | |
| RCM Links: Profile News Message Board | |
| Charts:- Daily , Weekly | |
| Add RCM to Watchlist: View: Get Complete RCM Trend Analysis ➞ | |
 | AIP Arteris, Inc. |
| Sector: Technology | |
| SubSector: Semiconductors | |
| MarketCap: 234 Millions | |
| Recent Price: 6.54 Smart Investing & Trading Score: 56 | |
| Day Percent Change: 0.62% Day Change: 0.04 | |
| Week Change: 2.35% Year-to-date Change: 11.0% | |
| AIP Links: Profile News Message Board | |
| Charts:- Daily , Weekly | |
| Add AIP to Watchlist: View: Get Complete AIP Trend Analysis ➞ | |
 | IIIV i3 Verticals, Inc. |
| Sector: Technology | |
| SubSector: Business Software & Services | |
| MarketCap: 448.458 Millions | |
| Recent Price: 23.48 Smart Investing & Trading Score: 60 | |
| Day Percent Change: 4.26% Day Change: 0.96 | |
| Week Change: 5.2% Year-to-date Change: 10.9% | |
| IIIV Links: Profile News Message Board | |
| Charts:- Daily , Weekly | |
| Add IIIV to Watchlist: View: Get Complete IIIV Trend Analysis ➞ | |
 | GRMN Garmin Ltd. |
| Sector: Technology | |
| SubSector: Scientific & Technical Instruments | |
| MarketCap: 13909.3 Millions | |
| Recent Price: 142.51 Smart Investing & Trading Score: 63 | |
| Day Percent Change: 1.06% Day Change: 1.49 | |
| Week Change: 2.14% Year-to-date Change: 10.9% | |
| GRMN Links: Profile News Message Board | |
| Charts:- Daily , Weekly | |
| Add GRMN to Watchlist: View: Get Complete GRMN Trend Analysis ➞ | |
 | FTNT Fortinet, Inc. |
| Sector: Technology | |
| SubSector: Application Software | |
| MarketCap: 16993.8 Millions | |
| Recent Price: 64.80 Smart Investing & Trading Score: 55 | |
| Day Percent Change: 1.74% Day Change: 1.11 | |
| Week Change: 2.21% Year-to-date Change: 10.7% | |
| FTNT Links: Profile News Message Board | |
| Charts:- Daily , Weekly | |
| Add FTNT to Watchlist: View: Get Complete FTNT Trend Analysis ➞ | |
 | BHE Benchmark Electronics, Inc. |
| Sector: Technology | |
| SubSector: Printed Circuit Boards | |
| MarketCap: 766.835 Millions | |
| Recent Price: 30.55 Smart Investing & Trading Score: 100 | |
| Day Percent Change: 1.56% Day Change: 0.47 | |
| Week Change: 3.1% Year-to-date Change: 10.5% | |
| BHE Links: Profile News Message Board | |
| Charts:- Daily , Weekly | |
| Add BHE to Watchlist: View: Get Complete BHE Trend Analysis ➞ | |
 | INFA Informatica Inc. |
| Sector: Technology | |
| SubSector: Software - Infrastructure | |
| MarketCap: 5340 Millions | |
| Recent Price: 31.39 Smart Investing & Trading Score: 26 | |
| Day Percent Change: -0.32% Day Change: -0.10 | |
| Week Change: -10.8% Year-to-date Change: 10.5% | |
| INFA Links: Profile News Message Board | |
| Charts:- Daily , Weekly | |
| Add INFA to Watchlist: View: Get Complete INFA Trend Analysis ➞ | |
 | MSI Motorola Solutions, Inc. |
| Sector: Technology | |
| SubSector: Communication Equipment | |
| MarketCap: 26573.3 Millions | |
| Recent Price: 345.55 Smart Investing & Trading Score: 70 | |
| Day Percent Change: 0.09% Day Change: 0.32 | |
| Week Change: 1.74% Year-to-date Change: 10.4% | |
| MSI Links: Profile News Message Board | |
| Charts:- Daily , Weekly | |
| Add MSI to Watchlist: View: Get Complete MSI Trend Analysis ➞ | |
 | KARO Karooooo Ltd. |
| Sector: Technology | |
| SubSector: Software - Application | |
| MarketCap: 728 Millions | |
| Recent Price: 27.28 Smart Investing & Trading Score: 95 | |
| Day Percent Change: 0.70% Day Change: 0.19 | |
| Week Change: 0.7% Year-to-date Change: 10.2% | |
| KARO Links: Profile News Message Board | |
| Charts:- Daily , Weekly | |
| Add KARO to Watchlist: View: Get Complete KARO Trend Analysis ➞ | |
 | ARQQ Arqit Quantum Inc. |
| Sector: Technology | |
| SubSector: Software - Infrastructure | |
| MarketCap: 165 Millions | |
| Recent Price: 0.50 Smart Investing & Trading Score: 53 | |
| Day Percent Change: 3.18% Day Change: 0.02 | |
| Week Change: 6.79% Year-to-date Change: 10.2% | |
| ARQQ Links: Profile News Message Board | |
| Charts:- Daily , Weekly | |
| Add ARQQ to Watchlist: View: Get Complete ARQQ Trend Analysis ➞ | |
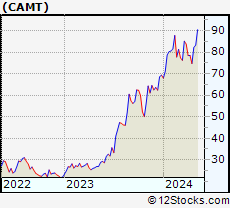 | CAMT Camtek Ltd. |
| Sector: Technology | |
| SubSector: Semiconductor Equipment & Materials | |
| MarketCap: 310.618 Millions | |
| Recent Price: 76.41 Smart Investing & Trading Score: 17 | |
| Day Percent Change: 0.55% Day Change: 0.42 | |
| Week Change: 2.32% Year-to-date Change: 10.1% | |
| CAMT Links: Profile News Message Board | |
| Charts:- Daily , Weekly | |
| Add CAMT to Watchlist: View: Get Complete CAMT Trend Analysis ➞ | |
 | MODN Model N, Inc. |
| Sector: Technology | |
| SubSector: Application Software | |
| MarketCap: 670.162 Millions | |
| Recent Price: 29.65 Smart Investing & Trading Score: 64 | |
| Day Percent Change: 0.30% Day Change: 0.09 | |
| Week Change: 0.1% Year-to-date Change: 10.1% | |
| MODN Links: Profile News Message Board | |
| Charts:- Daily , Weekly | |
| Add MODN to Watchlist: View: Get Complete MODN Trend Analysis ➞ | |
 | STER Sterling Check Corp. |
| Sector: Technology | |
| SubSector: Software - Infrastructure | |
| MarketCap: 1180 Millions | |
| Recent Price: 15.32 Smart Investing & Trading Score: 63 | |
| Day Percent Change: 1.22% Day Change: 0.18 | |
| Week Change: 2.24% Year-to-date Change: 9.9% | |
| STER Links: Profile News Message Board | |
| Charts:- Daily , Weekly | |
| Add STER to Watchlist: View: Get Complete STER Trend Analysis ➞ | |
 | ASX ASE Technology Holding Co., Ltd. |
| Sector: Technology | |
| SubSector: Semiconductor Equipment & Materials | |
| MarketCap: 8513.18 Millions | |
| Recent Price: 10.32 Smart Investing & Trading Score: 51 | |
| Day Percent Change: 1.38% Day Change: 0.14 | |
| Week Change: 2.69% Year-to-date Change: 9.7% | |
| ASX Links: Profile News Message Board | |
| Charts:- Daily , Weekly | |
| Add ASX to Watchlist: View: Get Complete ASX Trend Analysis ➞ | |
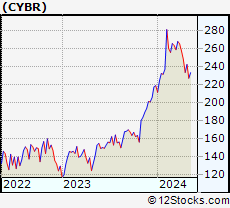 | CYBR CyberArk Software Ltd. |
| Sector: Technology | |
| SubSector: Business Software & Services | |
| MarketCap: 3223.58 Millions | |
| Recent Price: 240.22 Smart Investing & Trading Score: 58 | |
| Day Percent Change: 2.37% Day Change: 5.56 | |
| Week Change: 2.79% Year-to-date Change: 9.7% | |
| CYBR Links: Profile News Message Board | |
| Charts:- Daily , Weekly | |
| Add CYBR to Watchlist: View: Get Complete CYBR Trend Analysis ➞ | |
 | FTV Fortive Corporation |
| Sector: Technology | |
| SubSector: Scientific & Technical Instruments | |
| MarketCap: 16351.9 Millions | |
| Recent Price: 80.70 Smart Investing & Trading Score: 58 | |
| Day Percent Change: 0.42% Day Change: 0.34 | |
| Week Change: 1.52% Year-to-date Change: 9.6% | |
| FTV Links: Profile News Message Board | |
| Charts:- Daily , Weekly | |
| Add FTV to Watchlist: View: Get Complete FTV Trend Analysis ➞ | |
 | DAKT Daktronics, Inc. |
| Sector: Technology | |
| SubSector: Computer Based Systems | |
| MarketCap: 223.539 Millions | |
| Recent Price: 9.29 Smart Investing & Trading Score: 51 | |
| Day Percent Change: 1.92% Day Change: 0.18 | |
| Week Change: 1.59% Year-to-date Change: 9.5% | |
| DAKT Links: Profile News Message Board | |
| Charts:- Daily , Weekly | |
| Add DAKT to Watchlist: View: Get Complete DAKT Trend Analysis ➞ | |
 | IRM Iron Mountain Incorporated |
| Sector: Technology | |
| SubSector: Business Software & Services | |
| MarketCap: 7339.18 Millions | |
| Recent Price: 76.60 Smart Investing & Trading Score: 70 | |
| Day Percent Change: 0.99% Day Change: 0.75 | |
| Week Change: 2% Year-to-date Change: 9.5% | |
| IRM Links: Profile News Message Board | |
| Charts:- Daily , Weekly | |
| Add IRM to Watchlist: View: Get Complete IRM Trend Analysis ➞ | |
 | SQSP Squarespace, Inc. |
| Sector: Technology | |
| SubSector: Software - Infrastructure | |
| MarketCap: 4150 Millions | |
| Recent Price: 36.31 Smart Investing & Trading Score: 63 | |
| Day Percent Change: 2.60% Day Change: 0.92 | |
| Week Change: 5.28% Year-to-date Change: 9.4% | |
| SQSP Links: Profile News Message Board | |
| Charts:- Daily , Weekly | |
| Add SQSP to Watchlist: View: Get Complete SQSP Trend Analysis ➞ | |
 | MKSI MKS Instruments, Inc. |
| Sector: Technology | |
| SubSector: Scientific & Technical Instruments | |
| MarketCap: 4502.93 Millions | |
| Recent Price: 112.53 Smart Investing & Trading Score: 63 | |
| Day Percent Change: 2.56% Day Change: 2.81 | |
| Week Change: 4.03% Year-to-date Change: 9.4% | |
| MKSI Links: Profile News Message Board | |
| Charts:- Daily , Weekly | |
| Add MKSI to Watchlist: View: Get Complete MKSI Trend Analysis ➞ | |
 | ACIW ACI Worldwide, Inc. |
| Sector: Technology | |
| SubSector: Technical & System Software | |
| MarketCap: 2645.7 Millions | |
| Recent Price: 33.45 Smart Investing & Trading Score: 100 | |
| Day Percent Change: 3.72% Day Change: 1.20 | |
| Week Change: 4.69% Year-to-date Change: 9.3% | |
| ACIW Links: Profile News Message Board | |
| Charts:- Daily , Weekly | |
| Add ACIW to Watchlist: View: Get Complete ACIW Trend Analysis ➞ | |
 | GRND Grindr Inc. |
| Sector: Technology | |
| SubSector: Software - Application | |
| MarketCap: 929 Millions | |
| Recent Price: 9.79 Smart Investing & Trading Score: 53 | |
| Day Percent Change: 1.14% Day Change: 0.11 | |
| Week Change: 0.1% Year-to-date Change: 9.3% | |
| GRND Links: Profile News Message Board | |
| Charts:- Daily , Weekly | |
| Add GRND to Watchlist: View: Get Complete GRND Trend Analysis ➞ | |
| For tabular summary view of above stock list: Summary View ➞ 0 - 25 , 25 - 50 , 50 - 75 , 75 - 100 , 100 - 125 , 125 - 150 , 150 - 175 , 175 - 200 , 200 - 225 , 225 - 250 , 250 - 275 , 275 - 300 , 300 - 325 , 325 - 350 , 350 - 375 , 375 - 400 , 400 - 425 , 425 - 450 , 450 - 475 , 475 - 500 , 500 - 525 , 525 - 550 , 550 - 575 , 575 - 600 , 600 - 625 , 625 - 650 | ||
| Click To Change The Sort Order: By Market Cap or Company Size Performance: Year-to-date, Week and Day | |
| Select Chart Type: | ||
|
Best Stocks Today 12Stocks.com |
© 2024 12Stocks.com Terms & Conditions Privacy Contact Us
All Information Provided Only For Education And Not To Be Used For Investing or Trading. See Terms & Conditions


One More Thing ... Get Best Stocks Delivered Daily!
Never Ever Miss A Move With Our Top Ten Stocks Lists
Find Best Stocks In Any Market - Bull or Bear Market
Take A Peek At Our Top Ten Stocks Lists: Daily, Weekly, Year-to-Date & Top Trends
Find Best Stocks In Any Market - Bull or Bear Market
Take A Peek At Our Top Ten Stocks Lists: Daily, Weekly, Year-to-Date & Top Trends
Technology Stocks With Best Up Trends [0-bearish to 100-bullish]: HashiCorp [100], Payoneer Global[100], Grab [100], Sea [100], ACI Worldwide[100], NextNav [100], Full Truck[100], Badger Meter[100], Descartes Systems[100], Bentley Systems[100], JD.com [100]
Best Technology Stocks Year-to-Date:
Pagaya [574.82%], MediaCo Holding[370.66%], CXApp [172.59%], Super Micro[168.16%], Smith Micro[155.45%], Uxin [131.81%], MicroStrategy [111.59%], GigaCloud [102.02%], CuriosityStream [101.81%], SoundHound AI[95.09%], NextNav [94.49%] Best Technology Stocks This Week:
Matterport [164.37%], HashiCorp [22.53%], Akoustis [21.27%], BigBear.ai [17.93%], SoundHound AI[17.61%], Cheetah Mobile[14.69%], MicroStrategy [13.83%], So-Young [13.3%], Sea [12.62%], Aerohive Networks[12.55%], IonQ [12.41%] Best Technology Stocks Daily:
HashiCorp [19.54%], Akoustis [10.46%], SoundHound AI[10.45%], MediaCo Holding[10.16%], on [9.92%], BigBear.ai [9.62%], HealthStream [9.42%], Vacasa [9.18%], Cheetah Mobile[8.85%], Viasat [7.99%], CuriosityStream [7.92%]