
 Login Sign Up


| |||||
 |  | ||||

| 12Stocks.com Market Intelligence |
Best Tech Stocks
| In a hurry? Tech Stocks Lists: Performance & Trends, Stock Charts, FANG Stocks
Sort Tech stocks: Daily, Weekly, Year-to-Date, Market Cap & Trends. Filter Tech stocks list by size:All Tech Large Mid-Range Small and MicroCap |
| 12Stocks.com Tech Stocks Performances & Trends Daily | |||||||||
|
|  The overall Smart Investing & Trading Score is 38 (0-bearish to 100-bullish) which puts Technology sector in short term bearish to neutral trend. The Smart Investing & Trading Score from previous trading session is 45 and hence a deterioration of trend.
| ||||||||
Here are the Smart Investing & Trading Scores of the most requested Technology stocks at 12Stocks.com (click stock name for detailed review):
|


| 12Stocks.com: Investing in Technology sector with Stocks | |
|
The following table helps investors and traders sort through current performance and trends (as measured by Smart Investing & Trading Score) of various
stocks in the Tech sector. Quick View: Move mouse or cursor over stock symbol (ticker) to view short-term technical chart and over stock name to view long term chart. Click on  to add stock symbol to your watchlist and to add stock symbol to your watchlist and  to view watchlist. Click on any ticker or stock name for detailed market intelligence report for that stock. to view watchlist. Click on any ticker or stock name for detailed market intelligence report for that stock. |
12Stocks.com Performance of Stocks in Tech Sector
| Ticker | Stock Name | Watchlist | Category | Recent Price | Smart Investing & Trading Score | Change % | YTD Change% |
| BOX | Box |   | Software | 26.98 | 76 | -1.10% | 5.35% |
| FORM | FormFactor | | Semiconductor | 43.86 | 58 | 5.13% | 5.15% |
| CRUS | Cirrus Logic | | Semiconductor | 87.31 | 68 | 1.18% | 4.95% |
| ARQQ | Arqit Quantum | | Software - Infrastructure | 0.48 | 61 | -1.24% | 4.92% |
| ZUO | Zuora | | Software | 9.86 | 73 | -1.69% | 4.89% |
| MPWR | Monolithic Power | | Semiconductor | 660.34 | 68 | 2.82% | 4.69% |
| IGLD | Internet Gold- | | Communication | 20.11 | 17 | 0.30% | 4.63% |
| INFN | Infinera | | Communication | 4.97 | 62 | -0.20% | 4.63% |
| TRVG | trivago N.V | | Internet | 2.55 | 41 | 0.00% | 4.51% |
| CTS | CTS | | Electronics | 45.68 | 76 | 0.09% | 4.44% |
| AMD | Advanced Micro | | Semiconductor | 153.76 | 32 | 1.33% | 4.31% |
| NET | Cloudflare | | Software | 86.76 | 36 | -1.05% | 4.20% |
| IMOS | ChipMOS | | Semiconductor | 28.34 | 56 | -0.21% | 4.15% |
| VZ | Verizon | | Telecom | 39.22 | 32 | -0.68% | 4.03% |
| SNCR | Synchronoss | | Software | 6.46 | 25 | -0.92% | 4.03% |
| SAIC | Science Applications | | IT | 129.12 | 62 | 0.51% | 3.86% |
| CRM | salesforce.com | | Software | 273.14 | 18 | -1.10% | 3.80% |
| IOT | Samsara | | Software - Infrastructure | 34.39 | 68 | 1.30% | 3.68% |
| RELX | RELX | | IT | 41.12 | 49 | -0.75% | 3.68% |
| NXPI | NXP Semiconductors | | Semiconductor | 238.08 | 75 | 1.29% | 3.66% |
| BASE | Couchbase | | Software - Infrastructure | 23.60 | 25 | -2.16% | 3.55% |
| FTV | Fortive | | Instruments | 76.21 | 0 | 0.21% | 3.50% |
| UEIC | Universal Electronics | | Electronic | 9.71 | 36 | -0.92% | 3.41% |
| VEEV | Veeva Systems | | Healthcare Information | 199.09 | 25 | -0.71% | 3.41% |
| NGMS | NeoGames S.A | | Electronic Gaming & Multimedia | 29.45 | 66 | 0.00% | 3.41% |
| For chart view version of above stock list: Chart View ➞ 0 - 25 , 25 - 50 , 50 - 75 , 75 - 100 , 100 - 125 , 125 - 150 , 150 - 175 , 175 - 200 , 200 - 225 , 225 - 250 , 250 - 275 , 275 - 300 , 300 - 325 , 325 - 350 , 350 - 375 , 375 - 400 , 400 - 425 , 425 - 450 , 450 - 475 , 475 - 500 , 500 - 525 , 525 - 550 , 550 - 575 , 575 - 600 , 600 - 625 , 625 - 650 | ||
 | Click To Change The Sort Order: By Market Cap or Company Size Performance: Year-to-date, Week and Day |  |
|
Get the most comprehensive stock market coverage daily at 12Stocks.com ➞ Best Stocks Today ➞ Best Stocks Weekly ➞ Best Stocks Year-to-Date ➞ Best Stocks Trends ➞  Best Stocks Today 12Stocks.com Best Nasdaq Stocks ➞ Best S&P 500 Stocks ➞ Best Tech Stocks ➞ Best Biotech Stocks ➞ |
| Detailed Overview of Tech Stocks |
| Tech Technical Overview, Leaders & Laggards, Top Tech ETF Funds & Detailed Tech Stocks List, Charts, Trends & More |
| Tech Sector: Technical Analysis, Trends & YTD Performance | |
| Technology sector is composed of stocks
from semiconductors, software, web, social media
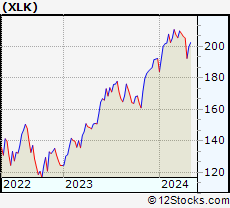
and services subsectors. Technology sector, as represented by XLK, an exchange-traded fund [ETF] that holds basket of tech stocks (e.g, Intel, Google) is up by 2.66% and is currently underperforming the overall market by -2.5% year-to-date. Below is a quick view of technical charts and trends: |
|
 XLK Weekly Chart |
|
| Long Term Trend: Not Good | |
| Medium Term Trend: Not Good | |
 XLK Daily Chart |
|
| Short Term Trend: Very Good | |
| Overall Trend Score: 38 | |
| YTD Performance: 2.66% | |
| **Trend Scores & Views Are Only For Educational Purposes And Not For Investing | |
| 12Stocks.com: Top Performing Technology Sector Stocks | ||||||||||||||||||||||||||||||||||||||||||||||||
 The top performing Technology sector stocks year to date are
Now, more recently, over last week, the top performing Technology sector stocks on the move are


|
||||||||||||||||||||||||||||||||||||||||||||||||
| 12Stocks.com: Investing in Tech Sector using Exchange Traded Funds | |
|
The following table shows list of key exchange traded funds (ETF) that
help investors track Tech Index. For detailed view, check out our ETF Funds section of our website. Quick View: Move mouse or cursor over ETF symbol (ticker) to view short-term technical chart and over ETF name to view long term chart. Click on ticker or stock name for detailed view. Click on to add stock symbol to your watchlist and to view watchlist. |
12Stocks.com List of ETFs that track Tech Index
| Ticker | ETF Name | Watchlist | Recent Price | Smart Investing & Trading Score | Change % | Week % | Year-to-date % |
| XLK | Technology | | 197.60 | 38 | -0.22 | 2.63 | 2.66% |
| QQQ | QQQ | | 424.45 | 51 | -0.48 | 2.36 | 3.65% |
| IYW | Technology | | 128.20 | 51 | -0.50 | 2.77 | 4.44% |
| VGT | Information Technology | | 495.44 | 38 | 0.04 | 3.24 | 2.36% |
| IXN | Global Tech | | 70.75 | 36 | -0.13 | 2.95 | 3.77% |
| IGV | Tech-Software | | 80.19 | 25 | -0.93 | 2.11 | -1.16% |
| XSD | Semiconductor | | 220.63 | 30 | 2.36 | 8.39 | -1.85% |
| TQQQ | QQQ | | 52.85 | 38 | -1.60 | 6.81 | 4.24% |
| SQQQ | Short QQQ | | 12.00 | 44 | 1.61 | -6.54 | -10.78% |
| SOXL | Semicondct Bull 3X | | 37.41 | 58 | 5.41 | 21.5 | 19.14% |
| SOXS | Semicondct Bear 3X | | 37.44 | 51 | -5.48 | -18.84 | 543.3% |
| SOXX | PHLX Semiconductor | | 212.41 | 51 | 1.86 | 7.07 | 10.61% |
| QTEC | First -100-Tech | | 181.18 | 51 | 0.02 | 4.16 | 3.25% |
| SMH | Semiconductor | | 212.20 | 63 | 2.00 | 6.52 | 21.35% |
| 12Stocks.com: Charts, Trends, Fundamental Data and Performances of Tech Stocks | |
|
We now take in-depth look at all Tech stocks including charts, multi-period performances and overall trends (as measured by Smart Investing & Trading Score). One can sort Tech stocks (click link to choose) by Daily, Weekly and by Year-to-Date performances. Also, one can sort by size of the company or by market capitalization. |
| Select Your Default Chart Type: | |||||
| |||||
| Click on stock symbol or name for detailed view. Click on to add stock symbol to your watchlist and to view watchlist. Quick View: Move mouse or cursor over "Daily" to quickly view daily technical stock chart and over "Weekly" to view weekly technical stock chart. | |||||


 | BOX Box, Inc. |
| Sector: Technology | |
| SubSector: Application Software | |
| MarketCap: 2154.42 Millions | |
| Recent Price: 26.98 Smart Investing & Trading Score: 76 | |
| Day Percent Change: -1.10% Day Change: -0.30 | |
| Week Change: 1.16% Year-to-date Change: 5.4% | |
| BOX Links: Profile News Message Board | |
| Charts:- Daily , Weekly | |
| Add BOX to Watchlist: View: Get Complete BOX Trend Analysis ➞ | |
 | FORM FormFactor, Inc. |
| Sector: Technology | |
| SubSector: Semiconductor - Broad Line | |
| MarketCap: 1426.42 Millions | |
| Recent Price: 43.86 Smart Investing & Trading Score: 58 | |
| Day Percent Change: 5.13% Day Change: 2.14 | |
| Week Change: 7.61% Year-to-date Change: 5.2% | |
| FORM Links: Profile News Message Board | |
| Charts:- Daily , Weekly | |
| Add FORM to Watchlist: View: Get Complete FORM Trend Analysis ➞ | |
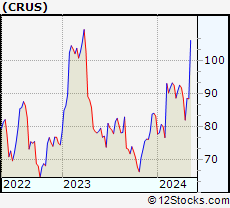 | CRUS Cirrus Logic, Inc. |
| Sector: Technology | |
| SubSector: Semiconductor - Specialized | |
| MarketCap: 3852.6 Millions | |
| Recent Price: 87.31 Smart Investing & Trading Score: 68 | |
| Day Percent Change: 1.18% Day Change: 1.02 | |
| Week Change: 6.45% Year-to-date Change: 5.0% | |
| CRUS Links: Profile News Message Board | |
| Charts:- Daily , Weekly | |
| Add CRUS to Watchlist: View: Get Complete CRUS Trend Analysis ➞ | |
 | ARQQ Arqit Quantum Inc. |
| Sector: Technology | |
| SubSector: Software - Infrastructure | |
| MarketCap: 165 Millions | |
| Recent Price: 0.48 Smart Investing & Trading Score: 61 | |
| Day Percent Change: -1.24% Day Change: -0.01 | |
| Week Change: 1.7% Year-to-date Change: 4.9% | |
| ARQQ Links: Profile News Message Board | |
| Charts:- Daily , Weekly | |
| Add ARQQ to Watchlist: View: Get Complete ARQQ Trend Analysis ➞ | |
 | ZUO Zuora, Inc. |
| Sector: Technology | |
| SubSector: Application Software | |
| MarketCap: 1063.22 Millions | |
| Recent Price: 9.86 Smart Investing & Trading Score: 73 | |
| Day Percent Change: -1.69% Day Change: -0.17 | |
| Week Change: 6.59% Year-to-date Change: 4.9% | |
| ZUO Links: Profile News Message Board | |
| Charts:- Daily , Weekly | |
| Add ZUO to Watchlist: View: Get Complete ZUO Trend Analysis ➞ | |
 | MPWR Monolithic Power Systems, Inc. |
| Sector: Technology | |
| SubSector: Semiconductor - Specialized | |
| MarketCap: 6436.4 Millions | |
| Recent Price: 660.34 Smart Investing & Trading Score: 68 | |
| Day Percent Change: 2.82% Day Change: 18.13 | |
| Week Change: 11.63% Year-to-date Change: 4.7% | |
| MPWR Links: Profile News Message Board | |
| Charts:- Daily , Weekly | |
| Add MPWR to Watchlist: View: Get Complete MPWR Trend Analysis ➞ | |
 | IGLD Internet Gold- Golden Lines Ltd. |
| Sector: Technology | |
| SubSector: Diversified Communication Services | |
| MarketCap: 204.84 Millions | |
| Recent Price: 20.11 Smart Investing & Trading Score: 17 | |
| Day Percent Change: 0.30% Day Change: 0.06 | |
| Week Change: -0.59% Year-to-date Change: 4.6% | |
| IGLD Links: Profile News Message Board | |
| Charts:- Daily , Weekly | |
| Add IGLD to Watchlist: View: Get Complete IGLD Trend Analysis ➞ | |
 | INFN Infinera Corporation |
| Sector: Technology | |
| SubSector: Communication Equipment | |
| MarketCap: 943 Millions | |
| Recent Price: 4.97 Smart Investing & Trading Score: 62 | |
| Day Percent Change: -0.20% Day Change: -0.01 | |
| Week Change: 5.3% Year-to-date Change: 4.6% | |
| INFN Links: Profile News Message Board | |
| Charts:- Daily , Weekly | |
| Add INFN to Watchlist: View: Get Complete INFN Trend Analysis ➞ | |
 | TRVG trivago N.V. |
| Sector: Technology | |
| SubSector: Internet Information Providers | |
| MarketCap: 587.88 Millions | |
| Recent Price: 2.55 Smart Investing & Trading Score: 41 | |
| Day Percent Change: 0.00% Day Change: 0.00 | |
| Week Change: -0.78% Year-to-date Change: 4.5% | |
| TRVG Links: Profile News Message Board | |
| Charts:- Daily , Weekly | |
| Add TRVG to Watchlist: View: Get Complete TRVG Trend Analysis ➞ | |
 | CTS CTS Corporation |
| Sector: Technology | |
| SubSector: Diversified Electronics | |
| MarketCap: 645.896 Millions | |
| Recent Price: 45.68 Smart Investing & Trading Score: 76 | |
| Day Percent Change: 0.09% Day Change: 0.04 | |
| Week Change: 5.18% Year-to-date Change: 4.4% | |
| CTS Links: Profile News Message Board | |
| Charts:- Daily , Weekly | |
| Add CTS to Watchlist: View: Get Complete CTS Trend Analysis ➞ | |
 | AMD Advanced Micro Devices, Inc. |
| Sector: Technology | |
| SubSector: Semiconductor - Broad Line | |
| MarketCap: 54275.1 Millions | |
| Recent Price: 153.76 Smart Investing & Trading Score: 32 | |
| Day Percent Change: 1.33% Day Change: 2.02 | |
| Week Change: 4.86% Year-to-date Change: 4.3% | |
| AMD Links: Profile News Message Board | |
| Charts:- Daily , Weekly | |
| Add AMD to Watchlist: View: Get Complete AMD Trend Analysis ➞ | |
 | NET Cloudflare, Inc. |
| Sector: Technology | |
| SubSector: Application Software | |
| MarketCap: 7063.72 Millions | |
| Recent Price: 86.76 Smart Investing & Trading Score: 36 | |
| Day Percent Change: -1.05% Day Change: -0.92 | |
| Week Change: 3.16% Year-to-date Change: 4.2% | |
| NET Links: Profile News Message Board | |
| Charts:- Daily , Weekly | |
| Add NET to Watchlist: View: Get Complete NET Trend Analysis ➞ | |
 | IMOS ChipMOS TECHNOLOGIES INC. |
| Sector: Technology | |
| SubSector: Semiconductor Equipment & Materials | |
| MarketCap: 658.918 Millions | |
| Recent Price: 28.34 Smart Investing & Trading Score: 56 | |
| Day Percent Change: -0.21% Day Change: -0.06 | |
| Week Change: 1.91% Year-to-date Change: 4.2% | |
| IMOS Links: Profile News Message Board | |
| Charts:- Daily , Weekly | |
| Add IMOS to Watchlist: View: Get Complete IMOS Trend Analysis ➞ | |
 | VZ Verizon Communications Inc. |
| Sector: Technology | |
| SubSector: Telecom Services - Domestic | |
| MarketCap: 229427 Millions | |
| Recent Price: 39.22 Smart Investing & Trading Score: 32 | |
| Day Percent Change: -0.68% Day Change: -0.27 | |
| Week Change: -3.14% Year-to-date Change: 4.0% | |
| VZ Links: Profile News Message Board | |
| Charts:- Daily , Weekly | |
| Add VZ to Watchlist: View: Get Complete VZ Trend Analysis ➞ | |
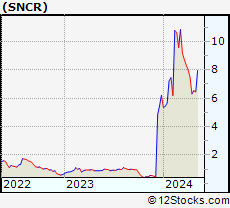 | SNCR Synchronoss Technologies, Inc. |
| Sector: Technology | |
| SubSector: Application Software | |
| MarketCap: 232.262 Millions | |
| Recent Price: 6.46 Smart Investing & Trading Score: 25 | |
| Day Percent Change: -0.92% Day Change: -0.06 | |
| Week Change: 2.38% Year-to-date Change: 4.0% | |
| SNCR Links: Profile News Message Board | |
| Charts:- Daily , Weekly | |
| Add SNCR to Watchlist: View: Get Complete SNCR Trend Analysis ➞ | |
 | SAIC Science Applications International Corporation |
| Sector: Technology | |
| SubSector: Information Technology Services | |
| MarketCap: 3388.78 Millions | |
| Recent Price: 129.12 Smart Investing & Trading Score: 62 | |
| Day Percent Change: 0.51% Day Change: 0.65 | |
| Week Change: 3.35% Year-to-date Change: 3.9% | |
| SAIC Links: Profile News Message Board | |
| Charts:- Daily , Weekly | |
| Add SAIC to Watchlist: View: Get Complete SAIC Trend Analysis ➞ | |
 | CRM salesforce.com, inc. |
| Sector: Technology | |
| SubSector: Application Software | |
| MarketCap: 137120 Millions | |
| Recent Price: 273.14 Smart Investing & Trading Score: 18 | |
| Day Percent Change: -1.10% Day Change: -3.05 | |
| Week Change: 1.02% Year-to-date Change: 3.8% | |
| CRM Links: Profile News Message Board | |
| Charts:- Daily , Weekly | |
| Add CRM to Watchlist: View: Get Complete CRM Trend Analysis ➞ | |
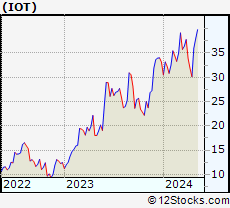 | IOT Samsara Inc. |
| Sector: Technology | |
| SubSector: Software - Infrastructure | |
| MarketCap: 14320 Millions | |
| Recent Price: 34.39 Smart Investing & Trading Score: 68 | |
| Day Percent Change: 1.30% Day Change: 0.44 | |
| Week Change: 14.06% Year-to-date Change: 3.7% | |
| IOT Links: Profile News Message Board | |
| Charts:- Daily , Weekly | |
| Add IOT to Watchlist: View: Get Complete IOT Trend Analysis ➞ | |
 | RELX RELX PLC |
| Sector: Technology | |
| SubSector: Information & Delivery Services | |
| MarketCap: 36730.7 Millions | |
| Recent Price: 41.12 Smart Investing & Trading Score: 49 | |
| Day Percent Change: -0.75% Day Change: -0.31 | |
| Week Change: 0.12% Year-to-date Change: 3.7% | |
| RELX Links: Profile News Message Board | |
| Charts:- Daily , Weekly | |
| Add RELX to Watchlist: View: Get Complete RELX Trend Analysis ➞ | |
 | NXPI NXP Semiconductors N.V. |
| Sector: Technology | |
| SubSector: Semiconductor - Broad Line | |
| MarketCap: 22497.9 Millions | |
| Recent Price: 238.08 Smart Investing & Trading Score: 75 | |
| Day Percent Change: 1.29% Day Change: 3.04 | |
| Week Change: 10.67% Year-to-date Change: 3.7% | |
| NXPI Links: Profile News Message Board | |
| Charts:- Daily , Weekly | |
| Add NXPI to Watchlist: View: Get Complete NXPI Trend Analysis ➞ | |
 | BASE Couchbase, Inc. |
| Sector: Technology | |
| SubSector: Software - Infrastructure | |
| MarketCap: 724 Millions | |
| Recent Price: 23.60 Smart Investing & Trading Score: 25 | |
| Day Percent Change: -2.16% Day Change: -0.52 | |
| Week Change: 3.06% Year-to-date Change: 3.6% | |
| BASE Links: Profile News Message Board | |
| Charts:- Daily , Weekly | |
| Add BASE to Watchlist: View: Get Complete BASE Trend Analysis ➞ | |
 | FTV Fortive Corporation |
| Sector: Technology | |
| SubSector: Scientific & Technical Instruments | |
| MarketCap: 16351.9 Millions | |
| Recent Price: 76.21 Smart Investing & Trading Score: 0 | |
| Day Percent Change: 0.21% Day Change: 0.16 | |
| Week Change: -4.13% Year-to-date Change: 3.5% | |
| FTV Links: Profile News Message Board | |
| Charts:- Daily , Weekly | |
| Add FTV to Watchlist: View: Get Complete FTV Trend Analysis ➞ | |
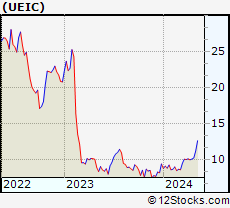 | UEIC Universal Electronics Inc. |
| Sector: Technology | |
| SubSector: Electronic Equipment | |
| MarketCap: 482.7 Millions | |
| Recent Price: 9.71 Smart Investing & Trading Score: 36 | |
| Day Percent Change: -0.92% Day Change: -0.09 | |
| Week Change: -3.67% Year-to-date Change: 3.4% | |
| UEIC Links: Profile News Message Board | |
| Charts:- Daily , Weekly | |
| Add UEIC to Watchlist: View: Get Complete UEIC Trend Analysis ➞ | |
 | VEEV Veeva Systems Inc. |
| Sector: Technology | |
| SubSector: Healthcare Information Services | |
| MarketCap: 21492.1 Millions | |
| Recent Price: 199.09 Smart Investing & Trading Score: 25 | |
| Day Percent Change: -0.71% Day Change: -1.43 | |
| Week Change: 0.36% Year-to-date Change: 3.4% | |
| VEEV Links: Profile News Message Board | |
| Charts:- Daily , Weekly | |
| Add VEEV to Watchlist: View: Get Complete VEEV Trend Analysis ➞ | |
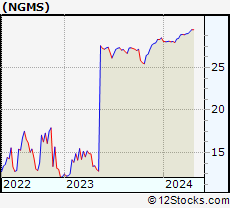 | NGMS NeoGames S.A. |
| Sector: Technology | |
| SubSector: Electronic Gaming & Multimedia | |
| MarketCap: 49837 Millions | |
| Recent Price: 29.45 Smart Investing & Trading Score: 66 | |
| Day Percent Change: 0.00% Day Change: 0.00 | |
| Week Change: -0.02% Year-to-date Change: 3.4% | |
| NGMS Links: Profile News Message Board | |
| Charts:- Daily , Weekly | |
| Add NGMS to Watchlist: View: Get Complete NGMS Trend Analysis ➞ | |
| For tabular summary view of above stock list: Summary View ➞ 0 - 25 , 25 - 50 , 50 - 75 , 75 - 100 , 100 - 125 , 125 - 150 , 150 - 175 , 175 - 200 , 200 - 225 , 225 - 250 , 250 - 275 , 275 - 300 , 300 - 325 , 325 - 350 , 350 - 375 , 375 - 400 , 400 - 425 , 425 - 450 , 450 - 475 , 475 - 500 , 500 - 525 , 525 - 550 , 550 - 575 , 575 - 600 , 600 - 625 , 625 - 650 | ||
| Click To Change The Sort Order: By Market Cap or Company Size Performance: Year-to-date, Week and Day | |
| Select Chart Type: | ||
|
Best Stocks Today 12Stocks.com |
© 2024 12Stocks.com Terms & Conditions Privacy Contact Us
All Information Provided Only For Education And Not To Be Used For Investing or Trading. See Terms & Conditions


One More Thing ... Get Best Stocks Delivered Daily!
Never Ever Miss A Move With Our Top Ten Stocks Lists
Find Best Stocks In Any Market - Bull or Bear Market
Take A Peek At Our Top Ten Stocks Lists: Daily, Weekly, Year-to-Date & Top Trends
Find Best Stocks In Any Market - Bull or Bear Market
Take A Peek At Our Top Ten Stocks Lists: Daily, Weekly, Year-to-Date & Top Trends
Technology Stocks With Best Up Trends [0-bearish to 100-bullish]: HashiCorp [100], Teradyne [100], Karooooo [100], Cricut [100], Grab [100], Microchip [100], Sanmina [100], JD.com [100], EchoStar [100], Analog Devices[100], Allegro MicroSystems[100]
Best Technology Stocks Year-to-Date:
MediaCo Holding[390.61%], Super Micro[177%], Uxin [172.47%], Smith Micro[168.77%], CXApp [166.41%], CuriosityStream [103.67%], GigaCloud [97.54%], MicroStrategy [96.39%], SoundHound AI[94.39%], Cheetah Mobile[88.16%], NextNav [85.73%] Best Technology Stocks This Week:
Matterport [168.97%], Amesite [58.44%], HashiCorp [36.92%], Impinj [33.73%], WiMi Hologram[33.51%], Ribbon [25.58%], Cheetah Mobile[21.19%], on [20.61%], iQIYI [17.99%], SoundHound AI[17.18%], IonQ [15.37%] Best Technology Stocks Daily:
Impinj [28.65%], HashiCorp [10.69%], Tyler [9.32%], SiTime [8.84%], Cheetah Mobile[8.33%], on [8.21%], Teradyne [8.15%], Karooooo [7.84%], Viomi [7.13%], Comtech Tele[6.86%], CACI [5.93%]