
 Login Sign Up


| |||||
 |  | ||||

| 12Stocks.com Market Intelligence |
Best Tech Stocks
| In a hurry? Tech Stocks Lists: Performance & Trends, Stock Charts, FANG Stocks
Sort Tech stocks: Daily, Weekly, Year-to-Date, Market Cap & Trends. Filter Tech stocks list by size:All Tech Large Mid-Range Small and MicroCap |
| 12Stocks.com Tech Stocks Performances & Trends Daily | |||||||||
|
|  The overall Smart Investing & Trading Score is 38 (0-bearish to 100-bullish) which puts Technology sector in short term bearish to neutral trend. The Smart Investing & Trading Score from previous trading session is 45 and hence a deterioration of trend.
| ||||||||
Here are the Smart Investing & Trading Scores of the most requested Technology stocks at 12Stocks.com (click stock name for detailed review):
|


| 12Stocks.com: Investing in Technology sector with Stocks | |
|
The following table helps investors and traders sort through current performance and trends (as measured by Smart Investing & Trading Score) of various
stocks in the Tech sector. Quick View: Move mouse or cursor over stock symbol (ticker) to view short-term technical chart and over stock name to view long term chart. Click on  to add stock symbol to your watchlist and to add stock symbol to your watchlist and  to view watchlist. Click on any ticker or stock name for detailed market intelligence report for that stock. to view watchlist. Click on any ticker or stock name for detailed market intelligence report for that stock. |
12Stocks.com Performance of Stocks in Tech Sector
| Ticker | Stock Name | Watchlist | Category | Recent Price | Smart Investing & Trading Score | Change % | YTD Change% |
| CDNS | Cadence Design |   | Software | 277.08 | 10 | -0.21% | 1.73% |
| NTGR | NETGEAR | | Communication | 14.82 | 68 | 0.54% | 1.65% |
| LILAK | Liberty Latin | | CATV | 7.46 | 93 | -0.27% | 1.63% |
| FFIV | F5 Networks | | Software | 181.85 | 45 | -0.27% | 1.60% |
| FSLR | First Solar | | Semiconductor | 175.02 | 44 | -1.39% | 1.59% |
| JKHY | Jack Henry | | IT | 165.89 | 41 | 0.42% | 1.52% |
| CIEN | Ciena | | Communication | 45.68 | 42 | 1.42% | 1.49% |
| NOW | ServiceNow | | IT | 716.25 | 0 | -4.03% | 1.38% |
| CCCS | CCC Intelligent | | Software - Infrastructure | 11.50 | 44 | -0.09% | 1.37% |
| NVEC | NVE | | Semiconductor | 79.37 | 45 | -1.26% | 1.20% |
| NTES | NetEase | | Internet | 94.12 | 25 | 0.11% | 1.03% |
| IMMR | Immersion | | Software | 7.13 | 36 | -1.11% | 0.99% |
| CLFD | Clearfield | | Communication | 29.36 | 68 | -0.81% | 0.96% |
| ALRM | Alarm.com | | Software | 65.23 | 51 | -0.85% | 0.94% |
| TRNS | Transcat | | Instruments | 109.84 | 88 | -1.29% | 0.47% |
| MORN | Morningstar | | IT | 287.46 | 56 | -4.93% | 0.43% |
| TER | Teradyne | | Semiconductor | 108.91 | 100 | 8.15% | 0.36% |
| SSNC | SS&C | | Software | 61.31 | 51 | -0.37% | 0.33% |
| INTU | Intuit | | Software | 626.39 | 55 | -1.43% | 0.22% |
| CHKP | Check Point | | Security Software | 152.95 | 51 | -5.00% | 0.10% |
| TEL | TE Connectivity | | Electronics | 140.48 | 0 | 0.34% | -0.01% |
| HPE | Hewlett Packard | | Communication | 16.97 | 61 | 0.24% | -0.06% |
| PCOR | Procore | | Software - | 69.82 | 10 | -1.66% | -0.09% |
| SONO | Sonos | | Electronics | 17.12 | 53 | -1.27% | -0.12% |
| SPOK | Spok | | Wireless | 15.44 | 49 | -0.71% | -0.26% |
| For chart view version of above stock list: Chart View ➞ 0 - 25 , 25 - 50 , 50 - 75 , 75 - 100 , 100 - 125 , 125 - 150 , 150 - 175 , 175 - 200 , 200 - 225 , 225 - 250 , 250 - 275 , 275 - 300 , 300 - 325 , 325 - 350 , 350 - 375 , 375 - 400 , 400 - 425 , 425 - 450 , 450 - 475 , 475 - 500 , 500 - 525 , 525 - 550 , 550 - 575 , 575 - 600 , 600 - 625 , 625 - 650 | ||
 | Click To Change The Sort Order: By Market Cap or Company Size Performance: Year-to-date, Week and Day |  |
|
Get the most comprehensive stock market coverage daily at 12Stocks.com ➞ Best Stocks Today ➞ Best Stocks Weekly ➞ Best Stocks Year-to-Date ➞ Best Stocks Trends ➞  Best Stocks Today 12Stocks.com Best Nasdaq Stocks ➞ Best S&P 500 Stocks ➞ Best Tech Stocks ➞ Best Biotech Stocks ➞ |
| Detailed Overview of Tech Stocks |
| Tech Technical Overview, Leaders & Laggards, Top Tech ETF Funds & Detailed Tech Stocks List, Charts, Trends & More |
| Tech Sector: Technical Analysis, Trends & YTD Performance | |
| Technology sector is composed of stocks
from semiconductors, software, web, social media
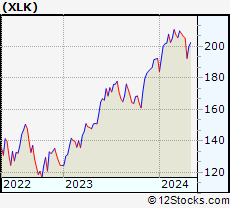
and services subsectors. Technology sector, as represented by XLK, an exchange-traded fund [ETF] that holds basket of tech stocks (e.g, Intel, Google) is up by 2.66% and is currently underperforming the overall market by -2.5% year-to-date. Below is a quick view of technical charts and trends: |
|
 XLK Weekly Chart |
|
| Long Term Trend: Not Good | |
| Medium Term Trend: Not Good | |
 XLK Daily Chart |
|
| Short Term Trend: Very Good | |
| Overall Trend Score: 38 | |
| YTD Performance: 2.66% | |
| **Trend Scores & Views Are Only For Educational Purposes And Not For Investing | |
| 12Stocks.com: Top Performing Technology Sector Stocks | ||||||||||||||||||||||||||||||||||||||||||||||||
 The top performing Technology sector stocks year to date are
Now, more recently, over last week, the top performing Technology sector stocks on the move are


|
||||||||||||||||||||||||||||||||||||||||||||||||
| 12Stocks.com: Investing in Tech Sector using Exchange Traded Funds | |
|
The following table shows list of key exchange traded funds (ETF) that
help investors track Tech Index. For detailed view, check out our ETF Funds section of our website. Quick View: Move mouse or cursor over ETF symbol (ticker) to view short-term technical chart and over ETF name to view long term chart. Click on ticker or stock name for detailed view. Click on to add stock symbol to your watchlist and to view watchlist. |
12Stocks.com List of ETFs that track Tech Index
| Ticker | ETF Name | Watchlist | Recent Price | Smart Investing & Trading Score | Change % | Week % | Year-to-date % |
| XLK | Technology | | 197.60 | 38 | -0.22 | 2.63 | 2.66% |
| QQQ | QQQ | | 424.45 | 51 | -0.48 | 2.36 | 3.65% |
| IYW | Technology | | 128.20 | 51 | -0.50 | 2.77 | 4.44% |
| VGT | Information Technology | | 495.44 | 38 | 0.04 | 3.24 | 2.36% |
| IXN | Global Tech | | 70.75 | 36 | -0.13 | 2.95 | 3.77% |
| IGV | Tech-Software | | 80.19 | 25 | -0.93 | 2.11 | -1.16% |
| XSD | Semiconductor | | 220.63 | 30 | 2.36 | 8.39 | -1.85% |
| TQQQ | QQQ | | 52.85 | 38 | -1.60 | 6.81 | 4.24% |
| SQQQ | Short QQQ | | 12.00 | 44 | 1.61 | -6.54 | -10.78% |
| SOXL | Semicondct Bull 3X | | 37.41 | 58 | 5.41 | 21.5 | 19.14% |
| SOXS | Semicondct Bear 3X | | 37.44 | 51 | -5.48 | -18.84 | 543.3% |
| SOXX | PHLX Semiconductor | | 212.41 | 51 | 1.86 | 7.07 | 10.61% |
| QTEC | First -100-Tech | | 181.18 | 51 | 0.02 | 4.16 | 3.25% |
| SMH | Semiconductor | | 212.20 | 63 | 2.00 | 6.52 | 21.35% |
| 12Stocks.com: Charts, Trends, Fundamental Data and Performances of Tech Stocks | |
|
We now take in-depth look at all Tech stocks including charts, multi-period performances and overall trends (as measured by Smart Investing & Trading Score). One can sort Tech stocks (click link to choose) by Daily, Weekly and by Year-to-Date performances. Also, one can sort by size of the company or by market capitalization. |
| Select Your Default Chart Type: | |||||
| |||||
| Click on stock symbol or name for detailed view. Click on to add stock symbol to your watchlist and to view watchlist. Quick View: Move mouse or cursor over "Daily" to quickly view daily technical stock chart and over "Weekly" to view weekly technical stock chart. | |||||


 | CDNS Cadence Design Systems, Inc. |
| Sector: Technology | |
| SubSector: Application Software | |
| MarketCap: 16865.8 Millions | |
| Recent Price: 277.08 Smart Investing & Trading Score: 10 | |
| Day Percent Change: -0.21% Day Change: -0.58 | |
| Week Change: -1.13% Year-to-date Change: 1.7% | |
| CDNS Links: Profile News Message Board | |
| Charts:- Daily , Weekly | |
| Add CDNS to Watchlist: View: Get Complete CDNS Trend Analysis ➞ | |
 | NTGR NETGEAR, Inc. |
| Sector: Technology | |
| SubSector: Communication Equipment | |
| MarketCap: 558.839 Millions | |
| Recent Price: 14.82 Smart Investing & Trading Score: 68 | |
| Day Percent Change: 0.54% Day Change: 0.08 | |
| Week Change: 3.93% Year-to-date Change: 1.7% | |
| NTGR Links: Profile News Message Board | |
| Charts:- Daily , Weekly | |
| Add NTGR to Watchlist: View: Get Complete NTGR Trend Analysis ➞ | |
 | LILAK Liberty Latin America Ltd. |
| Sector: Technology | |
| SubSector: CATV Systems | |
| MarketCap: 1210.32 Millions | |
| Recent Price: 7.46 Smart Investing & Trading Score: 93 | |
| Day Percent Change: -0.27% Day Change: -0.02 | |
| Week Change: 2.75% Year-to-date Change: 1.6% | |
| LILAK Links: Profile News Message Board | |
| Charts:- Daily , Weekly | |
| Add LILAK to Watchlist: View: Get Complete LILAK Trend Analysis ➞ | |
 | FFIV F5 Networks, Inc. |
| Sector: Technology | |
| SubSector: Business Software & Services | |
| MarketCap: 6675.38 Millions | |
| Recent Price: 181.85 Smart Investing & Trading Score: 45 | |
| Day Percent Change: -0.27% Day Change: -0.50 | |
| Week Change: 2.55% Year-to-date Change: 1.6% | |
| FFIV Links: Profile News Message Board | |
| Charts:- Daily , Weekly | |
| Add FFIV to Watchlist: View: Get Complete FFIV Trend Analysis ➞ | |
 | FSLR First Solar, Inc. |
| Sector: Technology | |
| SubSector: Semiconductor - Specialized | |
| MarketCap: 3617.9 Millions | |
| Recent Price: 175.02 Smart Investing & Trading Score: 44 | |
| Day Percent Change: -1.39% Day Change: -2.46 | |
| Week Change: -0.01% Year-to-date Change: 1.6% | |
| FSLR Links: Profile News Message Board | |
| Charts:- Daily , Weekly | |
| Add FSLR to Watchlist: View: Get Complete FSLR Trend Analysis ➞ | |
 | JKHY Jack Henry & Associates, Inc. |
| Sector: Technology | |
| SubSector: Information Technology Services | |
| MarketCap: 10695.4 Millions | |
| Recent Price: 165.89 Smart Investing & Trading Score: 41 | |
| Day Percent Change: 0.42% Day Change: 0.69 | |
| Week Change: 0.18% Year-to-date Change: 1.5% | |
| JKHY Links: Profile News Message Board | |
| Charts:- Daily , Weekly | |
| Add JKHY to Watchlist: View: Get Complete JKHY Trend Analysis ➞ | |
 | CIEN Ciena Corporation |
| Sector: Technology | |
| SubSector: Communication Equipment | |
| MarketCap: 6206.99 Millions | |
| Recent Price: 45.68 Smart Investing & Trading Score: 42 | |
| Day Percent Change: 1.42% Day Change: 0.64 | |
| Week Change: 4.87% Year-to-date Change: 1.5% | |
| CIEN Links: Profile News Message Board | |
| Charts:- Daily , Weekly | |
| Add CIEN to Watchlist: View: Get Complete CIEN Trend Analysis ➞ | |
 | NOW ServiceNow, Inc. |
| Sector: Technology | |
| SubSector: Information Technology Services | |
| MarketCap: 53599.1 Millions | |
| Recent Price: 716.25 Smart Investing & Trading Score: 0 | |
| Day Percent Change: -4.03% Day Change: -30.04 | |
| Week Change: 0.33% Year-to-date Change: 1.4% | |
| NOW Links: Profile News Message Board | |
| Charts:- Daily , Weekly | |
| Add NOW to Watchlist: View: Get Complete NOW Trend Analysis ➞ | |
 | CCCS CCC Intelligent Solutions Holdings Inc. |
| Sector: Technology | |
| SubSector: Software - Infrastructure | |
| MarketCap: 6990 Millions | |
| Recent Price: 11.50 Smart Investing & Trading Score: 44 | |
| Day Percent Change: -0.09% Day Change: -0.01 | |
| Week Change: 0.52% Year-to-date Change: 1.4% | |
| CCCS Links: Profile News Message Board | |
| Charts:- Daily , Weekly | |
| Add CCCS to Watchlist: View: Get Complete CCCS Trend Analysis ➞ | |
 | NVEC NVE Corporation |
| Sector: Technology | |
| SubSector: Semiconductor - Specialized | |
| MarketCap: 231.26 Millions | |
| Recent Price: 79.37 Smart Investing & Trading Score: 45 | |
| Day Percent Change: -1.26% Day Change: -1.01 | |
| Week Change: 1.76% Year-to-date Change: 1.2% | |
| NVEC Links: Profile News Message Board | |
| Charts:- Daily , Weekly | |
| Add NVEC to Watchlist: View: Get Complete NVEC Trend Analysis ➞ | |
 | NTES NetEase, Inc. |
| Sector: Technology | |
| SubSector: Internet Software & Services | |
| MarketCap: 40105.1 Millions | |
| Recent Price: 94.12 Smart Investing & Trading Score: 25 | |
| Day Percent Change: 0.11% Day Change: 0.10 | |
| Week Change: 0.65% Year-to-date Change: 1.0% | |
| NTES Links: Profile News Message Board | |
| Charts:- Daily , Weekly | |
| Add NTES to Watchlist: View: Get Complete NTES Trend Analysis ➞ | |
 | IMMR Immersion Corporation |
| Sector: Technology | |
| SubSector: Application Software | |
| MarketCap: 173.462 Millions | |
| Recent Price: 7.13 Smart Investing & Trading Score: 36 | |
| Day Percent Change: -1.11% Day Change: -0.08 | |
| Week Change: -0.56% Year-to-date Change: 1.0% | |
| IMMR Links: Profile News Message Board | |
| Charts:- Daily , Weekly | |
| Add IMMR to Watchlist: View: Get Complete IMMR Trend Analysis ➞ | |
 | CLFD Clearfield, Inc. |
| Sector: Technology | |
| SubSector: Communication Equipment | |
| MarketCap: 138.439 Millions | |
| Recent Price: 29.36 Smart Investing & Trading Score: 68 | |
| Day Percent Change: -0.81% Day Change: -0.24 | |
| Week Change: 3.82% Year-to-date Change: 1.0% | |
| CLFD Links: Profile News Message Board | |
| Charts:- Daily , Weekly | |
| Add CLFD to Watchlist: View: Get Complete CLFD Trend Analysis ➞ | |
 | ALRM Alarm.com Holdings, Inc. |
| Sector: Technology | |
| SubSector: Application Software | |
| MarketCap: 2035.62 Millions | |
| Recent Price: 65.23 Smart Investing & Trading Score: 51 | |
| Day Percent Change: -0.85% Day Change: -0.56 | |
| Week Change: 1.75% Year-to-date Change: 0.9% | |
| ALRM Links: Profile News Message Board | |
| Charts:- Daily , Weekly | |
| Add ALRM to Watchlist: View: Get Complete ALRM Trend Analysis ➞ | |
 | TRNS Transcat, Inc. |
| Sector: Technology | |
| SubSector: Scientific & Technical Instruments | |
| MarketCap: 216.653 Millions | |
| Recent Price: 109.84 Smart Investing & Trading Score: 88 | |
| Day Percent Change: -1.29% Day Change: -1.43 | |
| Week Change: 1.67% Year-to-date Change: 0.5% | |
| TRNS Links: Profile News Message Board | |
| Charts:- Daily , Weekly | |
| Add TRNS to Watchlist: View: Get Complete TRNS Trend Analysis ➞ | |
 | MORN Morningstar, Inc. |
| Sector: Technology | |
| SubSector: Information & Delivery Services | |
| MarketCap: 4997.87 Millions | |
| Recent Price: 287.46 Smart Investing & Trading Score: 56 | |
| Day Percent Change: -4.93% Day Change: -14.90 | |
| Week Change: -3.52% Year-to-date Change: 0.4% | |
| MORN Links: Profile News Message Board | |
| Charts:- Daily , Weekly | |
| Add MORN to Watchlist: View: Get Complete MORN Trend Analysis ➞ | |
 | TER Teradyne, Inc. |
| Sector: Technology | |
| SubSector: Semiconductor Equipment & Materials | |
| MarketCap: 8135.68 Millions | |
| Recent Price: 108.91 Smart Investing & Trading Score: 100 | |
| Day Percent Change: 8.15% Day Change: 8.21 | |
| Week Change: 13.48% Year-to-date Change: 0.4% | |
| TER Links: Profile News Message Board | |
| Charts:- Daily , Weekly | |
| Add TER to Watchlist: View: Get Complete TER Trend Analysis ➞ | |
 | SSNC SS&C Technologies Holdings, Inc. |
| Sector: Technology | |
| SubSector: Business Software & Services | |
| MarketCap: 9884.08 Millions | |
| Recent Price: 61.31 Smart Investing & Trading Score: 51 | |
| Day Percent Change: -0.37% Day Change: -0.23 | |
| Week Change: 0.81% Year-to-date Change: 0.3% | |
| SSNC Links: Profile News Message Board | |
| Charts:- Daily , Weekly | |
| Add SSNC to Watchlist: View: Get Complete SSNC Trend Analysis ➞ | |
 | INTU Intuit Inc. |
| Sector: Technology | |
| SubSector: Application Software | |
| MarketCap: 577035 Millions | |
| Recent Price: 626.39 Smart Investing & Trading Score: 55 | |
| Day Percent Change: -1.43% Day Change: -9.10 | |
| Week Change: 3.51% Year-to-date Change: 0.2% | |
| INTU Links: Profile News Message Board | |
| Charts:- Daily , Weekly | |
| Add INTU to Watchlist: View: Get Complete INTU Trend Analysis ➞ | |
 | CHKP Check Point Software Technologies Ltd. |
| Sector: Technology | |
| SubSector: Security Software & Services | |
| MarketCap: 15112.2 Millions | |
| Recent Price: 152.95 Smart Investing & Trading Score: 51 | |
| Day Percent Change: -5.00% Day Change: -8.05 | |
| Week Change: -3.17% Year-to-date Change: 0.1% | |
| CHKP Links: Profile News Message Board | |
| Charts:- Daily , Weekly | |
| Add CHKP to Watchlist: View: Get Complete CHKP Trend Analysis ➞ | |
 | TEL TE Connectivity Ltd. |
| Sector: Technology | |
| SubSector: Diversified Electronics | |
| MarketCap: 20044.9 Millions | |
| Recent Price: 140.48 Smart Investing & Trading Score: 0 | |
| Day Percent Change: 0.34% Day Change: 0.48 | |
| Week Change: -0.05% Year-to-date Change: 0.0% | |
| TEL Links: Profile News Message Board | |
| Charts:- Daily , Weekly | |
| Add TEL to Watchlist: View: Get Complete TEL Trend Analysis ➞ | |
 | HPE Hewlett Packard Enterprise Company |
| Sector: Technology | |
| SubSector: Communication Equipment | |
| MarketCap: 12886.1 Millions | |
| Recent Price: 16.97 Smart Investing & Trading Score: 61 | |
| Day Percent Change: 0.24% Day Change: 0.04 | |
| Week Change: 1.07% Year-to-date Change: -0.1% | |
| HPE Links: Profile News Message Board | |
| Charts:- Daily , Weekly | |
| Add HPE to Watchlist: View: Get Complete HPE Trend Analysis ➞ | |
 | PCOR Procore Technologies, Inc. |
| Sector: Technology | |
| SubSector: Software - Application | |
| MarketCap: 9180 Millions | |
| Recent Price: 69.82 Smart Investing & Trading Score: 10 | |
| Day Percent Change: -1.66% Day Change: -1.18 | |
| Week Change: -0.67% Year-to-date Change: -0.1% | |
| PCOR Links: Profile News Message Board | |
| Charts:- Daily , Weekly | |
| Add PCOR to Watchlist: View: Get Complete PCOR Trend Analysis ➞ | |
 | SONO Sonos, Inc. |
| Sector: Technology | |
| SubSector: Diversified Electronics | |
| MarketCap: 1047.96 Millions | |
| Recent Price: 17.12 Smart Investing & Trading Score: 53 | |
| Day Percent Change: -1.27% Day Change: -0.22 | |
| Week Change: 1.3% Year-to-date Change: -0.1% | |
| SONO Links: Profile News Message Board | |
| Charts:- Daily , Weekly | |
| Add SONO to Watchlist: View: Get Complete SONO Trend Analysis ➞ | |
 | SPOK Spok Holdings, Inc. |
| Sector: Technology | |
| SubSector: Wireless Communications | |
| MarketCap: 220.827 Millions | |
| Recent Price: 15.44 Smart Investing & Trading Score: 49 | |
| Day Percent Change: -0.71% Day Change: -0.11 | |
| Week Change: 2.86% Year-to-date Change: -0.3% | |
| SPOK Links: Profile News Message Board | |
| Charts:- Daily , Weekly | |
| Add SPOK to Watchlist: View: Get Complete SPOK Trend Analysis ➞ | |
| For tabular summary view of above stock list: Summary View ➞ 0 - 25 , 25 - 50 , 50 - 75 , 75 - 100 , 100 - 125 , 125 - 150 , 150 - 175 , 175 - 200 , 200 - 225 , 225 - 250 , 250 - 275 , 275 - 300 , 300 - 325 , 325 - 350 , 350 - 375 , 375 - 400 , 400 - 425 , 425 - 450 , 450 - 475 , 475 - 500 , 500 - 525 , 525 - 550 , 550 - 575 , 575 - 600 , 600 - 625 , 625 - 650 | ||
| Click To Change The Sort Order: By Market Cap or Company Size Performance: Year-to-date, Week and Day | |
| Select Chart Type: | ||
|
Best Stocks Today 12Stocks.com |
© 2024 12Stocks.com Terms & Conditions Privacy Contact Us
All Information Provided Only For Education And Not To Be Used For Investing or Trading. See Terms & Conditions


One More Thing ... Get Best Stocks Delivered Daily!
Never Ever Miss A Move With Our Top Ten Stocks Lists
Find Best Stocks In Any Market - Bull or Bear Market
Take A Peek At Our Top Ten Stocks Lists: Daily, Weekly, Year-to-Date & Top Trends
Find Best Stocks In Any Market - Bull or Bear Market
Take A Peek At Our Top Ten Stocks Lists: Daily, Weekly, Year-to-Date & Top Trends
Technology Stocks With Best Up Trends [0-bearish to 100-bullish]: HashiCorp [100], Teradyne [100], Karooooo [100], Cricut [100], Grab [100], Microchip [100], Sanmina [100], JD.com [100], EchoStar [100], Analog Devices[100], Allegro MicroSystems[100]
Best Technology Stocks Year-to-Date:
MediaCo Holding[390.61%], Super Micro[177%], Uxin [172.47%], Smith Micro[168.77%], CXApp [166.41%], CuriosityStream [103.67%], GigaCloud [97.54%], MicroStrategy [96.39%], SoundHound AI[94.39%], Cheetah Mobile[88.16%], NextNav [85.73%] Best Technology Stocks This Week:
Matterport [168.97%], Amesite [58.44%], HashiCorp [36.92%], Impinj [33.73%], WiMi Hologram[33.51%], Ribbon [25.58%], Cheetah Mobile[21.19%], on [20.61%], iQIYI [17.99%], SoundHound AI[17.18%], IonQ [15.37%] Best Technology Stocks Daily:
Impinj [28.65%], HashiCorp [10.69%], Tyler [9.32%], SiTime [8.84%], Cheetah Mobile[8.33%], on [8.21%], Teradyne [8.15%], Karooooo [7.84%], Viomi [7.13%], Comtech Tele[6.86%], CACI [5.93%]